1171
Simultaneous T1, T2 and Diffusion Quantification using Multiple Contrast Prepared Magnetic Resonance Fingerprinting1Department of Biomedical Engineering, Case Western Reserve University, Cleveland, OH, United States, 2Department of Radiology, University Hospitals of Cleveland, Cleveland, OH, United States, 3Department of Radiology, University Hospital (CHUV), Lausanne, Switzerland
Synopsis
A novel MRF sequence is designed for generating high quality, distortion-free T1, T2 and apparent diffusion coefficient (ADC) maps simultaneously in less than 60 seconds per slice. The method inserts multiple magnetization preparation modules in
Introduction
The purpose of the study is to develop a method for simultaneous quantification of T1, T2, and diffusion (ADC) using the Magnetic Resonance Fingerprinting (MRF) framework1. These tissue properties are important in pathology characterization, disease diagnoses and treatment efficacy monitoring. The multidimensional distribution of these parameters shows unique features in the characterization of tissues and materials2. However, they are conventionally measured separately, which leads to long acquisition times. Additionally, image distortions in the diffusion-weighted EPI acquisition prohibit the adoption of a co-registered combination of T1, T2 and diffusion maps in the clinic.
Pattern matching used in MRF allows for the use of variable acquisition parameters that continuously change the image contrast over time, enabling simultaneous estimation of multiple tissue properties from one acquisition. Here, it is shown that the proposed MRF method can quantify T1, T2 and diffusion simultaneously in a phantom and in vivo human brain.
Methods
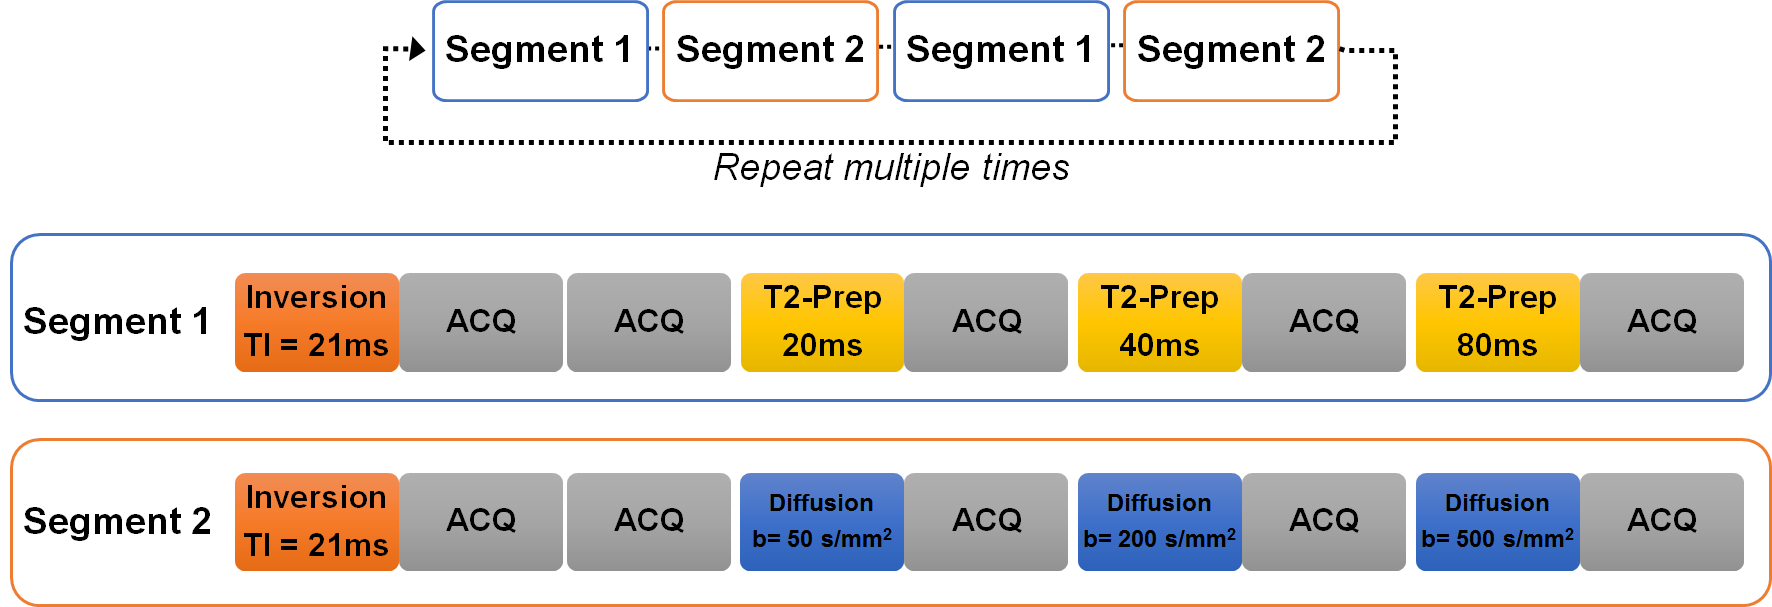
Similar to the method in cardiac MRF3, multiple magnetization preparation modules, namely T1-inversion, T2-preparation4 and diffusion-preparation5 are inserted in a FISP-based MRF sequence6. The proposed pulse sequence contains two segments as shown in Figure 1. One segment contains one inversion with TI of 21 ms and three T2-preparation modules with TE of 20, 40 and 80 ms. The other segment contains one inversion with TI of 21 ms and three diffusion-preparation modules with b-values of 50, 200 and 500 s/mm2. After each preparation module, fifty time points were acquired with a TR of 7.42 ms and variable flip angles 4° - 25° in each acquisition window. Highly undersampled images were acquired with one interleaf of a variable density spiral trajectory at each time point. The spiral requires 24 interleaves to fully sample the inner 25% of k-space and 48 interleaves to meet the Nyquist criterion with a spatial resolution of 1.2 × 1.2 mm2. To fully resolve the three tissue properties, these two segments in Figure 1 were alternatively repeated 3 times (1500 time points, 30 seconds total acquisition time) in the phantom and 6 times (3000 frames, 60 seconds total acquisition time) in the in vivo experiments for one diffusion direction in the current study. The lower SNR of the in vivo experiment compared to the phantom required more time points to resolve the maps.
All experiments were performed on a Siemens Skyra 3T scanner (Siemens AG Healthcare, Erlangen, Germany) with a 32-channel head receiver array. For validation, ADC values were derived using the proposed method in a quantitative diffusion phantom from National Institute of Standards and Technology (NIST) and were compared to ADC values estimated by a diffusion-weighted spin echo sequence (DW-SE) (b-values of 50, 200, and 500 s/mm2) at room temperature. T1 and T2 values of the T2 layer in the ISMRM/NIST MRI system phantom were derived by the proposed method and were compared to values reported by the NIST7. In vivo imaging was performed after informed consent in this IRB-approved study. To mitigate non-rigid motion from cardiac pulsatility, ECG triggering was used to synchronize the 371 ms acquisition window to the same cardiac phase.
A dictionary was calculated using these acquisition parameters in Bloch simulations. The dictionary has a total of 173922 elements with T1 ranging from 10 – 3000 ms, T2 from 2 – 800 ms and ADC value from 0 – 3000×10-6 mm2/s. T1, T2 and diffusion values were derived from a multiscale iterative reconstruction8 that matches the undersampled signals to the dictionary.
Results
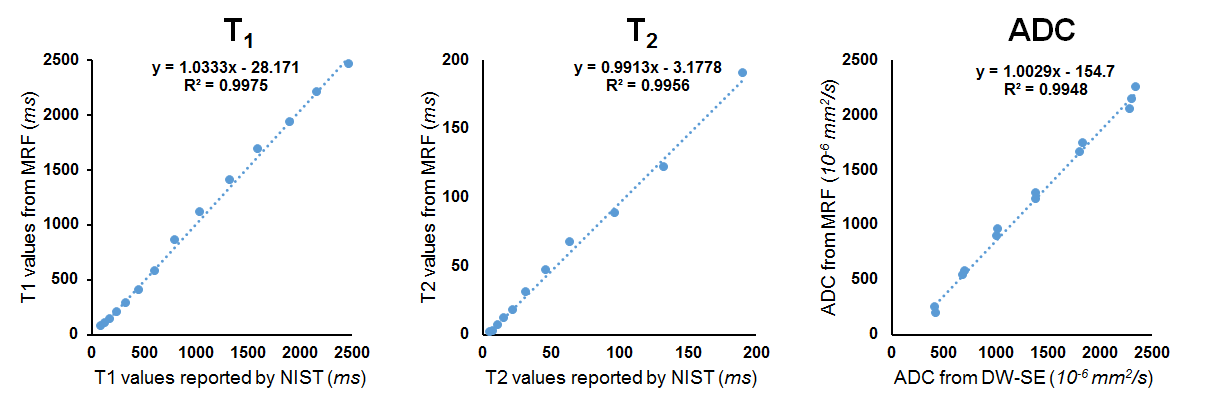
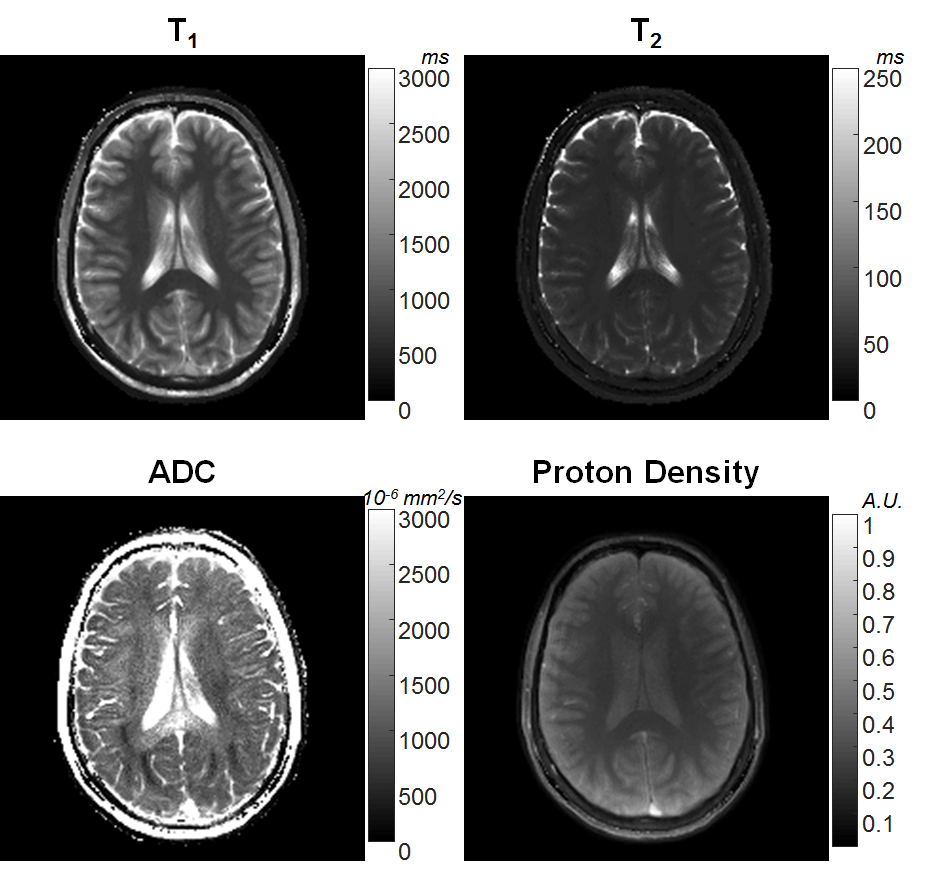
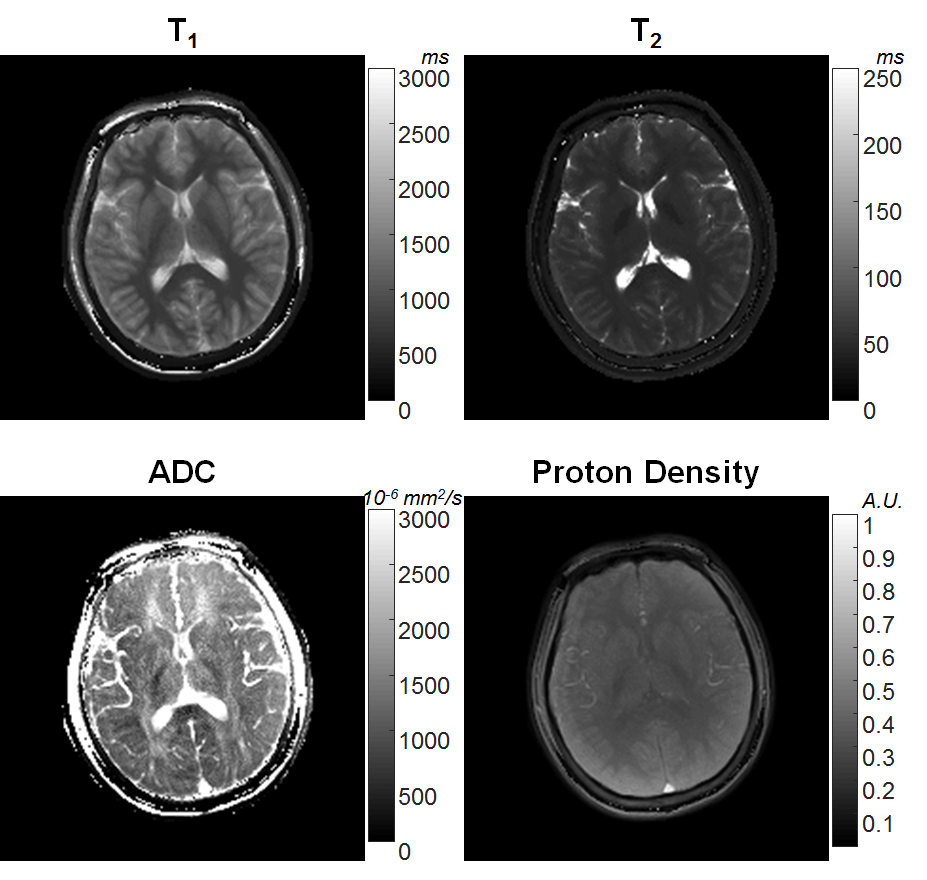
In Figure 2, T1, T2 and ADC values from the proposed method are plotted against T1, T2 values reported by NIST, and ADC values from DW-SE, respectively. The linear trend shows three parameters from MRF are in good agreement with their gold standards. Figures 3 and 4 show T1, T2, ADC and proton density maps from two volunteers. The ADC maps in Figures 3 and 4 demonstrate the diffusion anisotropy due to left-right and anterior-posterior diffusion encoding, respectively.Discussion
Here, a simultaneous quantification of T1, T2 and ADC using MRF framework is demonstrated. High quality T1, T2 and ADC maps can be generated without the traditional geometric EPI distortion in diffusion images. Using the magnetization preparation modules shortens the preparation time required to achieve variable image contrast, and provides the possibility to use physiological gating to mitigate the motion. Compared to previous studies using diffusion preparation to quantify ADC9, MRF also simultaneously measures T1 and T2, which may lead to a more accurate diffusion estimation.Conclusion
A novel MRF sequence is presented for generating high quality T1, T2 and ADC maps under 60 seconds per slice.Acknowledgements
Authors thank Kathryn E. Keenan for her helps on phantoms from NIST. This work was supported by Siemens Healthcare and NIH grants 1R01EB016728-01A1 and 5R01EB017219-02.References
1.Ma D, Gulani V, Seiberlich N, et al. Magnetic resonance fingerprinting. Nature. 2013;495(7440):187-192. doi:10.1038/nature11971.
2. Hürlimann M., Venkataramanan L. Quantitative Measurement of Two-Dimensional Distribution Functions of Diffusion and Relaxation in Grossly Inhomogeneous Fields. J Magn Reson. 2002;157(1):31-42. doi:10.1006/jmre.2002.2567.
3. Hamilton JI, Jiang Y, Chen Y, et al. MR fingerprinting for rapid quantification of myocardial T1, T2, and proton spin density. Magnetic Resonance in Medicine. 2016.
4. Brittain JH, Hu BS, Wright GA, Meyer CH, Macovski A, Nishimura DG. Coronary Angiography with Magnetization-Prepared T2 Contrast. Magn Reson Med. 1995;33(5):689-696. doi:10.1002/mrm.1910330515.
5. Thomas DL, Pell GS, Lythgoe MF, Gadian DG, Ordidge RJ. A quantitative method for fast diffusion imaging using magnetization-prepared TurboFLASH. Magn Reson Med. 1998;39(6):950-960. doi:DOI 10.1002/mrm.1910390613.
6. Jiang Y, Ma D, Seiberlich N, Gulani V, Griswold MA. MR fingerprinting using fast imaging with steady state precession (FISP) with spiral readout. Magn Reson Med. 2015;74(6):1621-1631. doi:10.1002/mrm.25559.
7. Keenan K, Stupic K, Boss M, et al. Multi-Site, Multi-Vendor Comparison of T1 Measurement Using ISMRM/NIST System Phantom. Proceeding 24th Annu Meet ISMRM, Singapore. 2016:3290.
8. Pierre EY, Ma D, Chen Y, Badve C, Griswold MA. Multiscale reconstruction for MR fingerprinting. Magn Reson Med. 2016;75(6):2481-2492. doi:10.1002/mrm.25776.
9. Nguyen C, Fan Z, Sharif B, et al. In vivo three-dimensional high resolution cardiac diffusion-weighted MRI: A motion compensated diffusion-prepared balanced steady-state free precession approach. Magn Reson Med. 2014;72(5):1257-1267. doi:10.1002/mrm.25038.
Figures