1170
In-vivo and ex-vivo R2* and Quantitative Susceptibility Mapping in Alzheimer’s Disease at Ultra-High Magnetic Field compared to Histology1High Field Magnetic Resonance, Max Planck Institute for Biological Cybernetics, Tuebingen, Germany, 2High-field Magnetic Resonance, Max Planck Institute for Biological Cybernetics, Tuebingen, Germany, 3Physiology of Cognitive Processes, Max Planck Institute for Biological Cybernetics, Tuebingen, Germany, 4Division of Neuropathology, University Hospital Tuebingen, Tuebingen, Germany, 5Section for Dementia Research, DE,Hertie-Institute for Clinical Brain Research, Tuebingen, Germany, 6High Field Magnetic Resonance, Max Planck Institute for Biological Cybernetics, Tuebingen
Synopsis
Amyloid-β plaques are classical hallmarks of the post-mortem Alzheimer’s Disease (AD) brain. Ultra-High-Field (UHF) MRI provides a compelling means to investigate pathological processes at an unprecedented level of detail. ß-amyloid plaques can be detected in T2* weighted images at UHF, ex-vivo, due to the local iron content and to the plaque geometry per sè. With this study we aim to explore the source of the observed MR signal changes in AD at UHF using quantitative MRI methods in-vivo and ex-vivo.
PURPOSE
Alzheimer’s Disease (AD) is the most common cause of dementia worldwide therefore is a major public health problem in the world. So far AD diagnosis is only unequivocally defined by postmortem histology. β-amyloid deposits are known to be hallmarks of AD and can be detected in T2* weighted images at Ultra High Magnetic Field Strength (UFH) ex-vivo1. Cortical phase changes in T2* weighted MRI are characteristic for Alzheimer’s disease2. β-amyloid deposits likely contribute significantly to the observed phase effect3. This study aims to explore the source of the observed MR signal changes in AD at UHF using quantitative MRI analysis.
METHODS
In vivo: two patients with autosomal dominant AD (female 51y, male 35y) and two age and sex-matched healthy controls (HC) were scanned at 9.4T using a multi-echo (N=5) 3D GRE sequence (0.375x0.375x0.8mm3 voxel size, TR=35ms; TE=6 to 30ms in steps of 6ms, acquisition time = 9min (FOV=192x174x70.4mm3, matrix size=512x464x88) and a high resolution 3DGRE weighted sequence (AWI) (0.130x0.130x0.6mm3 voxel size, TR=25ms, TE=16.5ms, TA=14min). Ex-vivo: the same frontal cortex area of two post mortem samples from AD and HC respectively was measured at 14.1T using a multi echo (N=3) GRE sequence (100μm isotropic voxels, matrix=500x300x256, FOV=50x30x25.6mm3, TR=27ms, TE=4.5, 11, 17.5ms, TA=2.3h) and a 3D GRE sequence (TR=42.65 ms, TE=16.8 ms, matrix size=1340x749x512, FOV=50x27.45x19.99mm3, FA=12°, spatial res=37x37x37 μm3, N averages=12, total scan time=54h and 24min). Phase signal changes were explored by R2* maps using of NumART2* algorithm (G. Hagbert et. Al., 2002) and Quantitative Susceptibility Mapping (QSM) in-vivo and ex-vivo. QSM was performed using the iLSQR-method (STI suite toolbox (http://people.duke.edu/~cl160/)). The RESHARP algorithm was used for the background removal. The samples are also compared histology.RESULTS
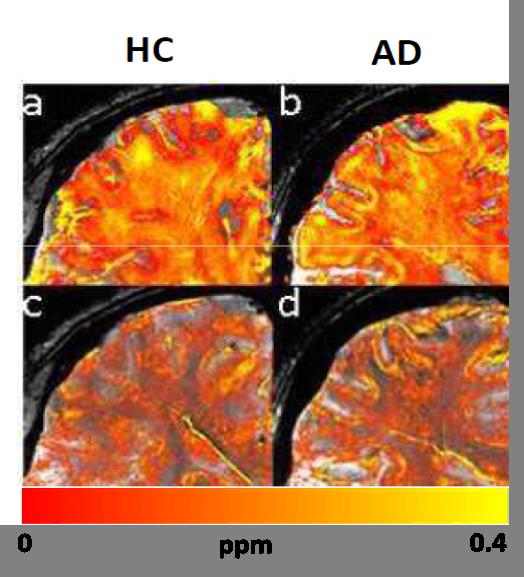
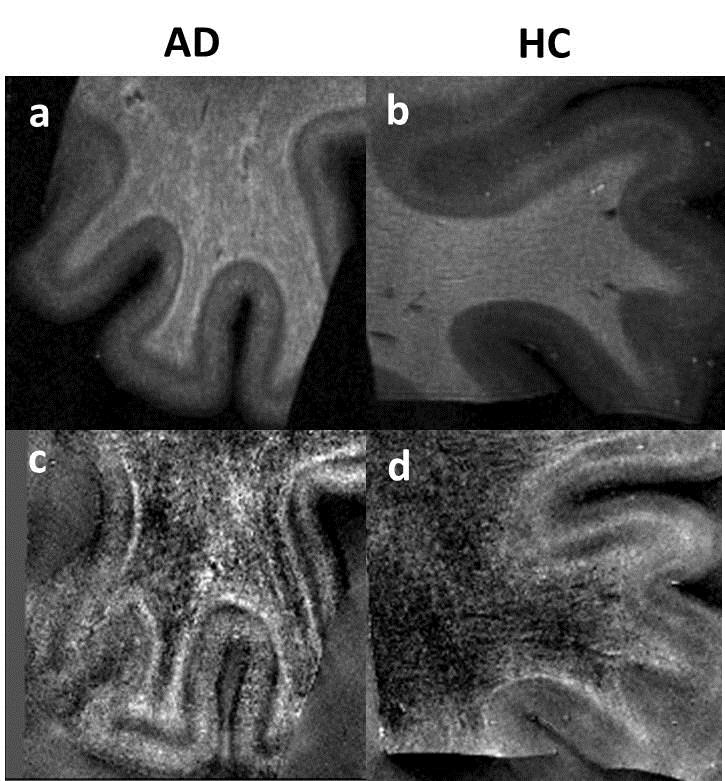
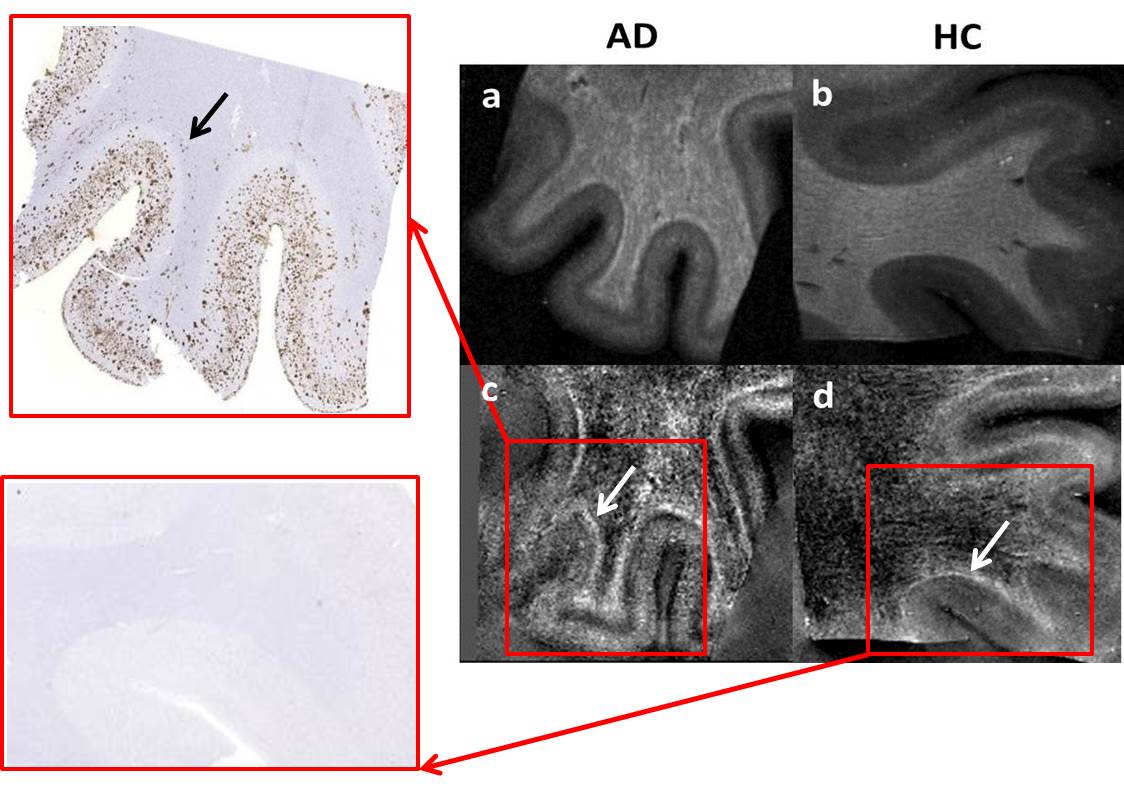
Both in-vivo and ex-vivo R2* and QSM maps showed distinct cortical layering patterns (Fig1, 2). Compared to healthy subjects, we observed an apparent broadening of the central cortical layer with increased R2* and QSM values consistent with paramagnetic effects in AD. These effects are more evident ex-vivo (Fig.2) and correspond to slight amyloid deposition in the white matter of the AD patient in the histological image (Fig.3). Significantly, also the cortex shows paramagnetic effects in AD patient compared to healthy subject ex-vivo. These outcomes are more visible in QSM images and are consistent with β-amyloid plaques observed in histological images (Fig. 3.)DISCUSSION AND CONCLUSION
Clinical valid methods for studying AD using MRI are emerging. Quantitative R2* and QSM methods at ultra-high field hold promise for this endeavor and detect changes that involve the layering pattern of the cortical rim. Characterizing the source of the observed signal at UHF and exploring it through the field strength can provide a potential mean to diagnose AD in-vivo.Acknowledgements
No acknowledgement found.References
1. Nabuurs RJ, Natté R, de Ronde FM, Hegeman-Kleinn I, Dijkstra J, van Duinen SG,Webb AG, Rozemuller AJ, van Buchem MA, van der Weerd L. MR microscopy of human amyloid-β deposits: characterization of arenchymal amyloid, diffuse plaques, and vascular amyloid. J Alzheimers Dis. 2013;34(4):1037-49. (2) van Rooden S. et al., 2014
2. Meadowcroft MD, Peters DG, Dewal RP, Connor JR, Yang QX. The effect of iron in MRI and transverse relaxation of amyloid-beta plaques in Alzheimer's disease. NMR Biomed. 2015;28(3):297-305;
3. Van Rooden S, Versluis MJ, Liem MK, Milles J, Maier AB, Oleksik AM, Webb AG, van Buchem MA, van der Grond J. Cortical phase changes in lzheimer's disease at 7T MRI: a novel imaging marker. Alzheimers Dement. 2014 ;10(1):e19-26;
Figures