1169
Changes in Hippocampal Subfield Volumes, Diffusivity and Brain Metabolism after Electroconvulsive Therapy: a Pilot PET/MR Study1Psychiatry, Stony Brook Medicine, Stony Brook, NY, United States, 2Radiology, Stony Brook Medicine, Stony Brook, NY, United States, 3Biomedical Engineering, Stony Brook University, Stony Brook, NY, United States
Synopsis
Major depression disorder is a highly prevalent illness with low treatment response rates. Fortunately, electroconvulsive therapy (ECT) is an effective treatment for patients with pharmacotherapy resistant depression, although its mechanism of action remains unclear. There is disagreement regarding the predictive value of amygdala and hippocampal volumes and whether ECT causes neuroplastic effects on these regions in patients with MDD. In this study, we used simultaneous PET/MR to look at structural, diffusion and metabolism changes in brain before and after ECT.
Purpose
Major depression disorder (MDD) is a highly prevalent illness with low treatment response rates1. Fortunately, electroconvulsive therapy (ECT) is an effective treatment for patients with pharmacotherapy resistant depression, although its mechanism of action remains unclear. There is disagreement regarding the predictive value of amygdala and hippocampal volumes and whether ECT causes neuroplastic effects on these regions in patients with MDD. In this study, we used simultaneous PET/MR to look at structural, diffusion and metabolism changes in brain before and after ECT.Methods
Six medicated, depressed participants (mean age=52 yr, range 32-70) were scanned on a 3T PET/MR scanner (Biograph mMR, Siemens Healthcare) before and after their clinically indicated bilateral ECT treatment. Depression severity was measured using the Hamilton Depression Rating Scale (HDRS). PET listmode data were acquired for 60 minutes after the injection of [18F]FDG. MR data include MPRAGE (resolution 1x1x1 mm3, TE/TR/TI = 2.98, 2300, 900 ms, FA=9°), 64 direction DTI (resolution 2.5x2.5x3 mm3, b=1000, TE/TR = 95, 9600). The PET data were binned into 26 dynamic frames, motion-corrected, and coregistered to the MPRAGE. Region-wise dynamic data were supplied to the Patlak model2 for estimation of the metabolic rate of glucose (MRGlu) along with arterial input function generated using simultaneous estimation3,4. MPRAGE was parcellated using Freesurfer 5.3. Mean diffusivity (MD) was calculated using the DTI data. Average MD of regions were then calculated based on Freesurfer parcellation.Results
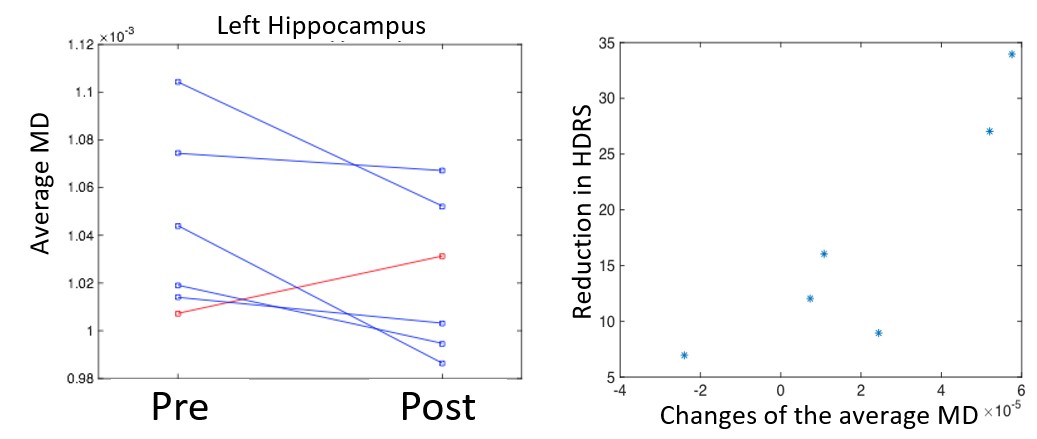
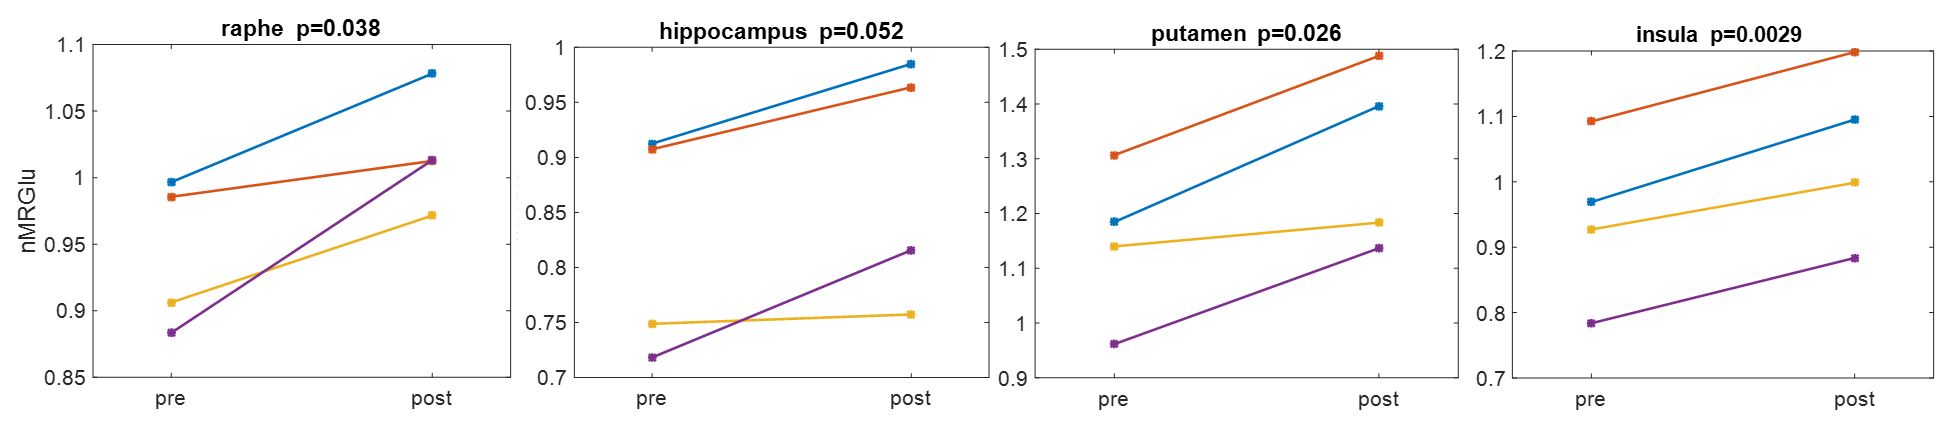
Five patients remitted with ECT (mean HDRS reduction=24, range 9-34). The volume of region IV of the hippocampus proper and dentate gyrus (CA4+DG) increased after ECT (p=0.054, all 6 subjects), but not the volume of the entire hippocampi. As shown in Figure 1, only the 5 remitters developed a decreased MD in the left hippocampus (p=0.04 when the nonresponder is excluded, otherwise p=0.15). Interestingly, changes in MD of the left hippocampus were linearly correlated with reduction in HDRS (Pearson r=0.88 and p=0.02).FDG-PET data for both pre- and post-treatment were only available from 4 of the remitters. Among the 79 regions included in our brain atlas consisting of cortical, subcortical and brain stem regions, MRGlu normalized by cerebellum (nMRGlu) generally increased after treatment. Figure 2 shows the nMRGlu increases after ECT in the raphe, hippocampus, putamen and insula. P-values were calculated using paired student t-test. As shown, small p values were achieved even with only 4 subjects. One limitation of this study is that FDG-PET included pre-treatment nutritional deficits which were corrected in depressed subjects. Another limitation is that the number of subjects in this pilot is small, in part due to the logistical difficulty of this study since the PETMR scans needs to be perform right before and after the clinically indicated treatment.Conclusion
In this pilot study, CA4+DG hippocampal volume increases were observed, which can be an indication of hippocampal neurogenesis and the antidepressant response5,6. Mean MD reduction, another indication of neurogenesis, of the left hippocampus was also found to be correlated with HDRS reduction. Glucose metabolism, normalized by the cerebellum, was also found to increase in many regions of the brain which are known to play a central role in emotion. Further investigation using FDG-PET/MR involving a larger cohort is warranted.Acknowledgements
This work is partially supported by the Dana Foundation and the Brain and Behavior Research Foundation.References
1. Rush AJ, Trivedi MH, Wisniewski SR, et al. Acute and longer-term outcomes in depressed outpatients requiring one or several treatment steps: a STAR* D report. American Journal of Psychiatry. 2006;163(11):1905-1917.
2. Patlak CS, Blasberg RG. Graphical evaluation of blood-to-brain transfer constants from multiple-time uptake data. Generalizations. Journal of Cerebral Blood Flow & Metabolism. 1985;5(4):584-590.
3. Mikhno A, Zanderigo F, Ogden R, et al. Toward Non-invasive Quantification of Brain Radioligand Binding by Combining Electronic Health Records and Dynamic PET Imaging Data. IEEE J Biomed Health Inform. 2015.
4. Zanderigo F, Ogden RT, Parsey RV. Noninvasive blood-free full quantification of positron emission tomography radioligand binding. Journal of cerebral blood flow and metabolism : official journal of the International Society of Cerebral Blood Flow and Metabolism. 2015;35(1):148-156.
5. Manganas LN, Zhang X, Li Y, et al. Magnetic resonance spectroscopy identifies neural progenitor cells in the live human brain. Science. 2007;318(5852):980-985.
6. Samuels
BA, Anacker C, Hu A, et al. 5-HT1A receptors on mature dentate gyrus granule
cells are critical for the antidepressant response. Nat Neurosci. 2015;18(11):1606-1616.
Figures