1168
Ultra-high resolution in vivo multi-parameter mapping of the human brain1Department of Neurophysics, Max Planck Institute for Human Cognitive and Brain Sciences, Leipzig, Germany, 2Wellcome Trust Centre for Neuroimaging, UCL Institute of Neurology, London, United Kingdom
Synopsis
We present the first multi-parameter maps of R1, R2* and effective proton-density (PD*) acquired at 400 µm isotropic resolution at 7T. Prospective motion correction (PMC) by external optical tracking was used to reduce motion artifacts, as well as to avoid a co-registration step during calculation of the maps. The maps allow for characterizing of subtle subcortical and cortical features such as the line of Gennari in the visual cortex.
Introduction
Recent years have seen revived interest in quantitative MRI (qMRI) of the human brain, e.g. using the multi-parameter mapping (MPM) protocol [1]. This is driven largely by the link between key MR parameters and the absolute concentrations of myelin and iron in neural tissue [2] and the insight that such qMRI measures can enable. As a result, there is a demand for methods which map several parameters not only accurately and robustly, but also at sufficiently high spatial resolution (e.g. dimensions smaller than 400 µm) to characterize intracortical structures such as columns and laminae. Imaging at such high resolution mandates the use of ultra-high field strength to have sufficient signal-to-noise ratio (SNR), as well as effective motion correction since the amplitude of physiologically-driven motion is of the same order as the voxel size. In this work we acquired 400 µm isotropic 3D images using prospective motion correction (PMC) [3,4] with external optical tracking at 7T, from which maps of R1, R2* and effective PD (PD*) could be constructed with unprecedented isotropic spatial resolution.Methods
A healthy volunteer was scanned over three sessions on a 7T MR system (Magnetom 7T, Siemens Healthineers, Erlangen, Germany) using a gradient and radio-frequency (RF) spoiled multi-echo 3D gradient echo sequence at 400 µm isotropic resolution (TR 31.8 ms, 8 echoes equally spaced between 3.4 and 21.6 ms) and with matrix size 560/640/416 (phase/read/slice). In each session, both PD-weighted (flip angle α=5°) and T1-weighted (α=28°) volumes were acquired in addition to calibration data to correct for RF transmit field non-uniformity. With partially parallel imaging (factor 2) applied in both phase-encoding directions (ky and kz), the acquisition of each volume lasted 32 minutes. In two of the three sessions, the PMC system (Kineticor, HI) was enabled. Using the system’s ability to lock a reference position and maintain the positioning between scans, both intra- and inter-scan motion was corrected prospectively. Due to the size of the acquired datasets, raw data were streamed offline and images subsequently reconstructed externally using a SENSE-based algorithm. Sensitivity maps were estimated from integrated k-space reference lines (Nky=84, Nkz=88).
Maps were created from the weighted datasets using custom MATLAB tools (MathWorks, MA) written within SPM12 (http://www.fil.ion.ucl.ac.uk/spm/) as previously described [4]. Since all motion-corrected data were anchored to the initial head position, co-registration between the weighted volumes within a session was not required, thus the acquired resolution was preserved during calculation of the maps. For higher SNR, individual maps from the two sessions with PMC activated were co-registered and averaged using the CBS Tools in MIPAV (http://www.nitrc.org/projects/cbs-tools/).
Results and discussion
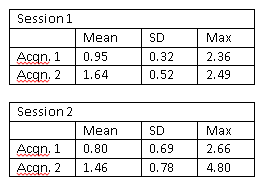
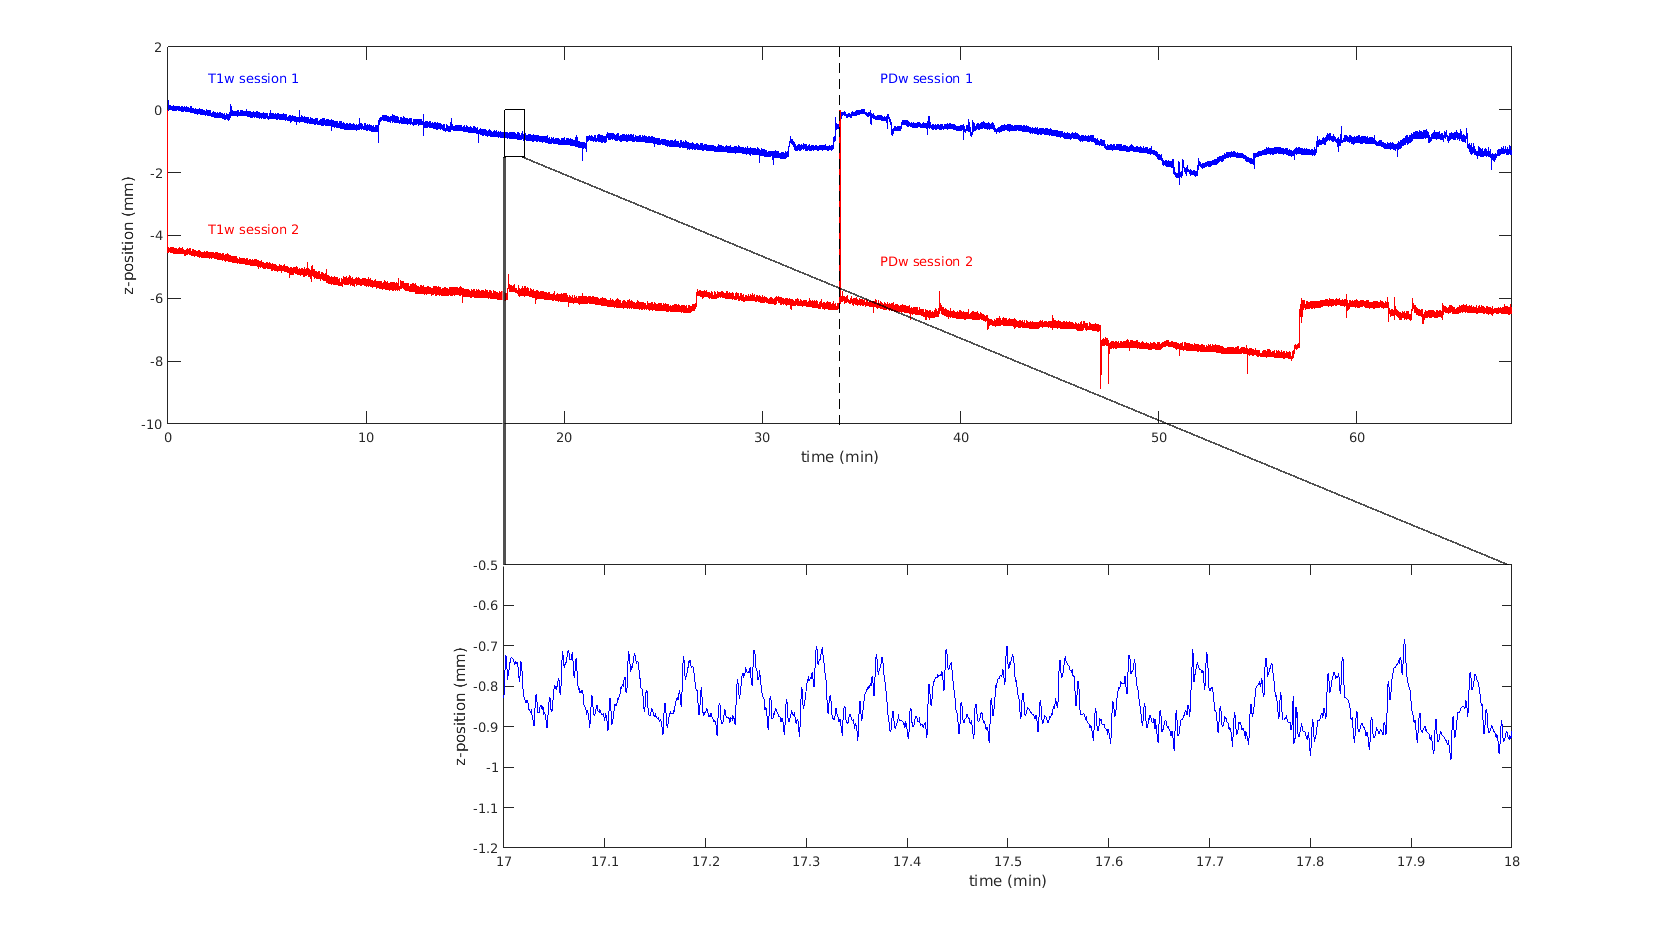
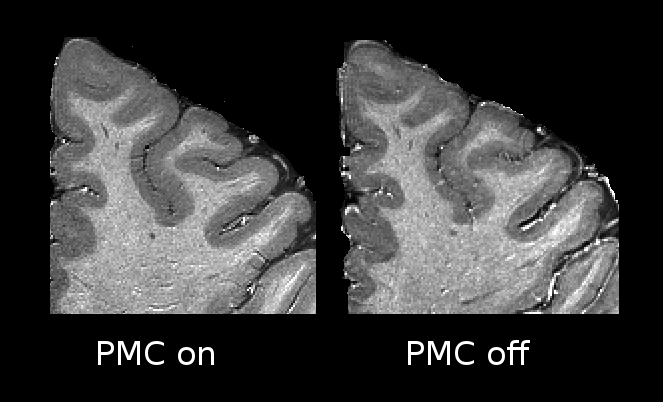
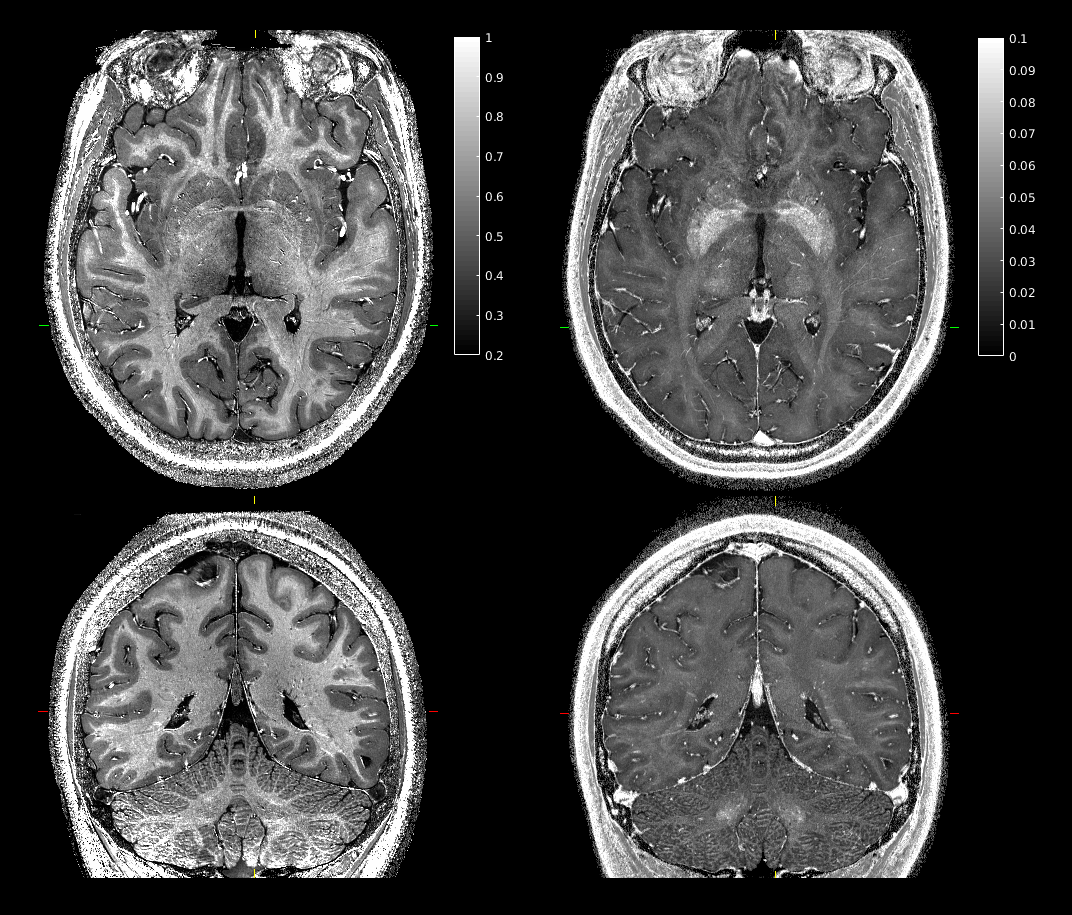
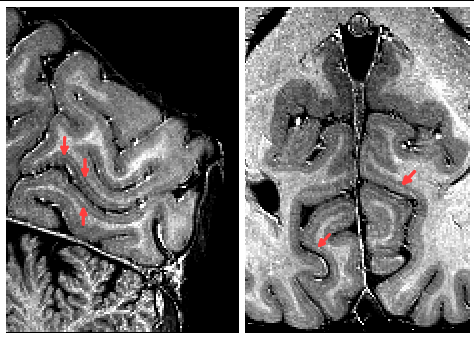
Motion summary statistics, along with a subset of the motion traces from the tracking system, are shown in Figs. 1-2. These show for all PMC-enabled scans a similar, low level of motion. Even the small unavoidable physiological motion reduced the image quality and effective resolution but was well corrected by PMC (Fig. 3). The 400 µm resolution MPM reliably delineated cortical and subcortical anatomical structures with a high contrast-to-noise ratio (CNR) across the whole brain (Fig. 4). In some comparably small regions, particularly in the inferior temporal lobe, inhomogeneity in the transmit RF field affected the R1 map (Fig. 4). The high resolution and CNR allowed for delineation even of subtle intracortical features such as the line of Gennari in the primary visual cortex (Fig. 5).Conclusion
Ultra-high resolution mapping of multiple physical parameters (PD*, R1, R2*) offers unique insights into the cortical microstructure, particularly with regard to myelination and iron concentration. We present MPMs at unprecedented resolution, which show subtle myeloarchitectonic features, such as the line of Gennari in the primary visual cortex (arrows Fig. 5). Such high quality of the maps can only be achieved by scanning at 7T with fast optical PMC.
The quantification of multiple parameters allows for a more precise investigation of the underlying microstructure and MR contrast mechanisms than conventional contrast weighted imaging [5] or T1 mapping [6], which are often used for estimating myelin content. Such very high-resolution parameter maps are likely to find many applications e.g. in subject-specific cortical parcellation and in laminar mapping of myelination and iron concentration.
Acknowledgements
The research leading to these results has received funding from the European Research Council under the European Union's Seventh Framework Programme (FP7/2007-2013) / ERC grant agreement n° 616905. The Wellcome Trust Centre for Neuroimaging is supported by core funding from the Wellcome Trust 0915/Z/10/Z.References
1. Weiskopf, N., Suckling, J., Williams, G., Correia, M.M., Inkster, B., Tait, R., Ooi, C., Bullmore, E.T. & Lutti, A. (2013). Quantitative multi-parameter mapping of R1, PD*, MT, and R2* at 3T: a multi-center validation. Front Neurosci, 7, 95.
2. Stüber, C., Morawski, M., Schäfer, A. & Turner, R. (2014). Myelin and iron concentration in the human brain: A quantitative study of MRI contrast. Neuroimage, 93, 1, 95-106.
3. Maclaren, J., Herbst, M., Speck, O. & Zaitsev, M. (2013). Prospective motion correction in brain imaging: A review. Magn Reson Med, 69, 621–636.
4. Callaghan, M. F., Josephs, O., Herbst, M., Zaitsev, M., Todd, N., & Weiskopf, N. (2015). An evaluation of prospective motion correction (PMC) for high resolution quantitative MRI. Front Neurosci, 9, 97.
5. Glasser M.F. & Van Essen D.C. (2011). Mapping human cortical areas in vivo based on myelin content as revealed by T1- and T2-weighted MRI. J Neurosci. 31, 32, 11597–616.
6. Lutti A., Dick F., Sereno M.I. & Weiskopf N. (2014). Using high-resolution quantitative mapping of R1 as an index of cortical myelination. Neuroimage, 93, 2, 176–88.
Figures