1166
The MRI signature of glial activation: a PET-MRI study using PBR28 radioligand and MR relaxometryGuillaume Bonnier1, Tom Hilbert2,3,4, Daniel Albrecht1, Marco L. Loggia1, and Cristina Granziera1,5
1MGH/MIT/HMS Athinoula A. Martinos Center for Biomedical Imaging, Massachusetts General Hospital, Harvard Medical School, Charlestown, MA, United States, 2Siemens Healthcare AG, Advanced Clinical Imaging Technology, Lausanne, Switzerland, 3Department of Radiology, University Hospital (CHUV), Lausanne, Switzerland, 4LTS5, École Polytechnique Fédérale de Lausanne, Lausanne, Switzerland, 5Neuroimmunology Unit, Neurology, Department of Clinical Neurosciences, Centre Hospitalier Universitaire Vaudois (CHUV) and University of Lausanne (UNIL), Lausanne, Switzerland
Synopsis
Radioligands used in PET imaging and binding to the translocator protein (TSPO) have proved to be useful to study inflammatory brain processes. Relatedly, quantitative Magnetic Resonance Imaging provides metrics of tissue-level microstructure, which permit to study the consequences of brain inflammation. In this work, we have investigated the relationship between PBR28 radioligant uptake and T1 and T2 metric of brain tissue microstructure based on analysis of PET images, T1 and T2 relaxometry images of 5 HIV subjects.
Introduction
Positron emission tomography uses radioligands to gather information about molecular and cellular processes in health and disease. Radioligands binding to the translocator protein (TSPO), e.g. PBR28, have proved to be useful to study inflammatory brain processes that are characterized by the upregulation of TSPO in glial cells1. Relatedly, quantitative Magnetic Resonance Imaging (i.e. relaxometry, magnetization transfer) provides metrics of tissue-level microstructure, which permit to study the consequences of brain inflammation such as oedema, demyelination, tissue degeneration and iron accumulation1. In this work, we use the recently-developed technology of integrated PET/MRI to investigate the relationship between PBR28 uptake and T1 and T2 relaxation times with regard to the microstructure of brain tissue.Methods
We enrolled five patients with HIV infection on stable antiretroviral therapy (age 55 ± 4.2, 4 males 1 female), who exhibited variable degrees of glial activation compared to a population of five age, gender and genotype-matched healthy controls. Brain imaging was performed with a Siemens PET/MRI scanner2 consisting of a dedicated brain avalanche photodiode-based PET scanner operating in the bore of a 3T TRIO magnetic resonance scanner-equipped with an 8-channel head coil. The use of integrated PET/MRI allowed us to collect structural MRI simultaneously with the PET data. Patients were scanned with in-house produced [11C]PBR283 produced in-house. At the beginning of the scan, we acquired (i) a multi-echo MPRAGE, (ii) a whole-brain Magnetization Prepared 2 Rapid Acquisition Gradient Echoes MP2RAGE4 for T1 relaxometry and a T2 relaxometry sequence covering the whole brain till the level of the occipital lobe, which uses a new nonlinear inverse reconstruction algorithm that estimates a T2 map5 (Table 1). For the purpose of this study, we considered brain areas with significantly higher uptake of PBR28 in patients compared to controls i.e. the thalamus and the frontal cortex. Standardized uptake value maps (SUV i.e. mean radioactivity/injected dose/weight) were computed using in-house software and used as a measure of TSPO expression6-8. SUV, T1 and T2 maps were normalized to MNI space using nonlinear registration (FNIRT, www.fmrib.ox.ac.uk/fsl/)11. In addition, SUV maps only were also spatially smoothed (8 mm) to improve signal-to-noise ratio, and intensity-normalized to a mean of 1 (SUVRs) in order to account for global signal differences in PET signal across subjects (Figure 1), as previously reported9,10 (Figure 1). The frontal cortical brain regions and thalamus were segmented using SPM and FreeSurfer on all T1 maps11. Spearman correlations were performed between T1/T2 relaxation times and SUVRs for all voxels in the thalamus of the 5 patients and all voxels of frontal lobe area that showed increased uptake. In order to minimize the effect of tissue type in the correlation measurement, we removed the WM from the frontal-lobe region-of-interest.Results
We found a significant negative correlation between T2 relaxation times and PBR28 uptake in the thalamus (Spearman Rho=-0.26, p-value<1e-10), but no correlation between T1 and PBR28 uptake (Spearman Rho =-0.01, p-value=0.26). The analysis of the frontal lobe showed that PBR28 uptake negatively correlated with T2 relaxation times (Spearman Rho =-0.14, p-value<1e-10), and positively with T1 relaxation times (Spearman Rho =0.16, p-value<1e-10) Figure 2.Discussion and Conclusion
Our data indicate that increased [11C]PBR28 SUVR corresponds to a decrease in T2 relaxation times in both the thalamus and the cortex, possibly due to an accumulation of paramagnetic ions (i.e. iron) occurring in activated glial cells13,14. The lack of a correlation between PBR28 SUVR and T1 relaxation time in the thalamus as well as the presence of a positive correlation reported in the cortex of the frontal lobe is possibly due to the additional sensitivity of T1 relaxometry to myelin, which is an important determinant of the T1 contrasts in the frontal lobe cortex and less in the thalamus5. An increase of PBR28 SUVR correlates with an increase of T1 relaxation times in the cortex (compatible with decrease in myelin content), most probably due to cortical myelin damage provoked by activated glial cells15,16. In summary, our preliminary data suggest an association between uptake of the glial marker [11C]PBR28 and changes of the T1 and T2 metrics of brain tissue microstructure. These observations support the utility of quantitative T1/T2 relaxometry as a complementary tool to PET in investigations of neuroinflammation.Acknowledgements
No acknowledgement found.References
1. Albrecht et al. In vivo imaging of human neuroinflammation. ACS Chem Neurosci 2016 Apr 20; 7(4):470-83.; 2. Catana, C et al. "Simultaneous In Vivo Positron Emission Tomography and Magnetic Resonance Imaging." Proceedings of the National Academy of Sciences, March 11, 2008, Vol. 105 (10), pp. 3705-3710; 3. Imaizumi et al., Brain and whole-body imaging in nonhuman primates of [11C]PBR28, a promising PET radioligand for peripheral benzodiazepine receptors. NeuroImage 2008; 4. Marques et al., MP2RAGE, a self bias-field corrected sequence for improved segmentation and T1-mapping at high field. NeuroImage 2010; 5. Sumpf et al., Fast T2 Mapping with Improved Accuracy Using Undersampled Spin-echo MRI and Model-based Reconstructions with a Generating Function. Trans. Med. Imaging 2014; 6. Hirvonen et al., Increased in vivo expression of an inflammatory marker in temporal lobe epilepsy. J Nucl. Med. 2012; 7. Fujita et al., PET reveals inflammation around calcified Taenia solium granulomas with perilesional edema. PlosOne 2013; 8. Shao et al., Imaging of carrageenan-induced local inflammation and adjuvant-induced systemic arthritis with [(11)C]PBR28 PET. Nucl. Med. Biol. 2013; 9. Loggia M. et al., Evidence for brain glial activation in chronic pain patients. Brain 2015; 10. Zuercher N. et al., Increased in vivo glial activation in patients with amyotrophic lateral sclerosis: assessed with [(11)C]-PBR28. NeuroImage Clin.2015; 11. Fischl et al., Automatically Parcellating the Human Cerebral Cortex. Cerebral Cortex 2004. ; 11. Smith et al., 2004;12. Fischl et al., Automatically Parcellating the Human Cerebral Cortex. Cerebral Cortex 2004.; 13. Pellizzoni I et al., Biochimica et Biophysica Acta (BBA) - Molecular Basis of Disease 2013; 14. Lane DJ, Biochemistry 2010; 15. Helena S. Domingues, Front Cell Dev Biol. 2016; 16. Lucchinetti CF, NEJM 2011.Figures
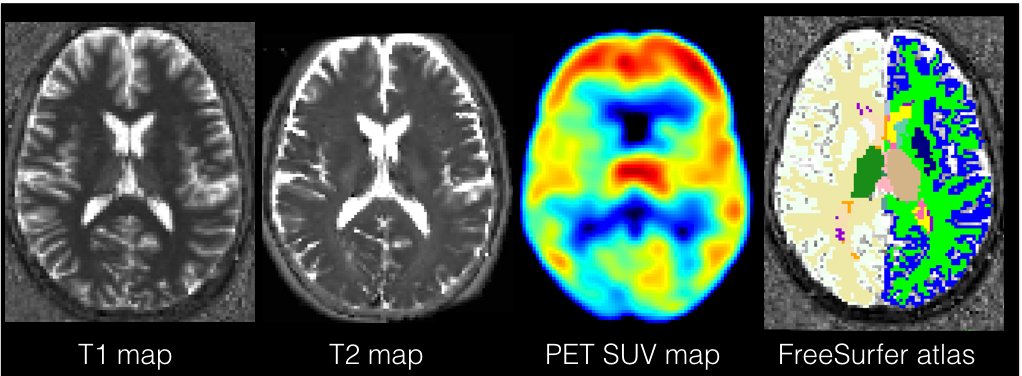
Example of T1, T2, PET SUVs maps and segmentation image from Freesurfer to extract thalamus.
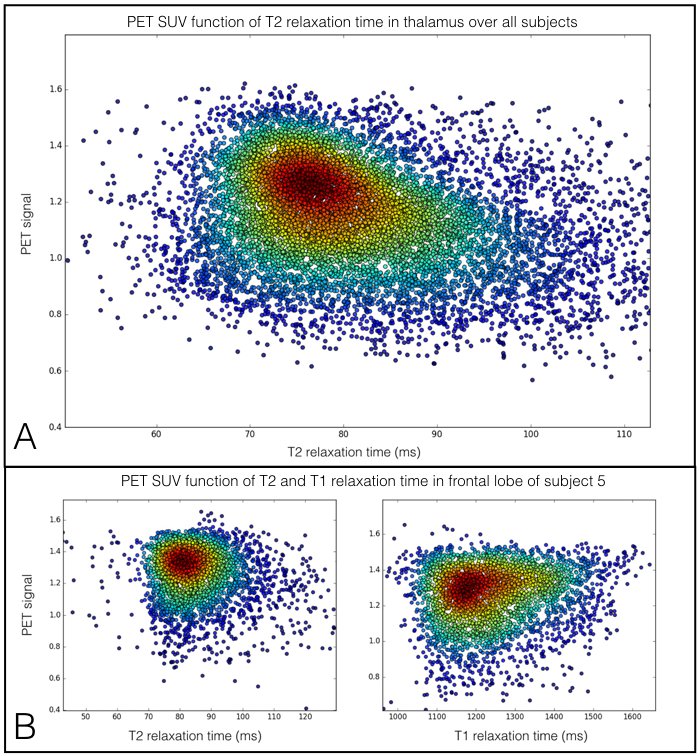
(A) PET signal function of T2 relaxation time in thalamus over the 5 subjects. The color map represents the density of points. We observe a negative correlation between PET signal and T2 rt. (B) PET signal function of T2 and T1 relaxation time in GM of frontal lobe of subject 5. We observe a negative correlation between PET signal and T2 rt, and a positive correlation between PET and T1 rt.
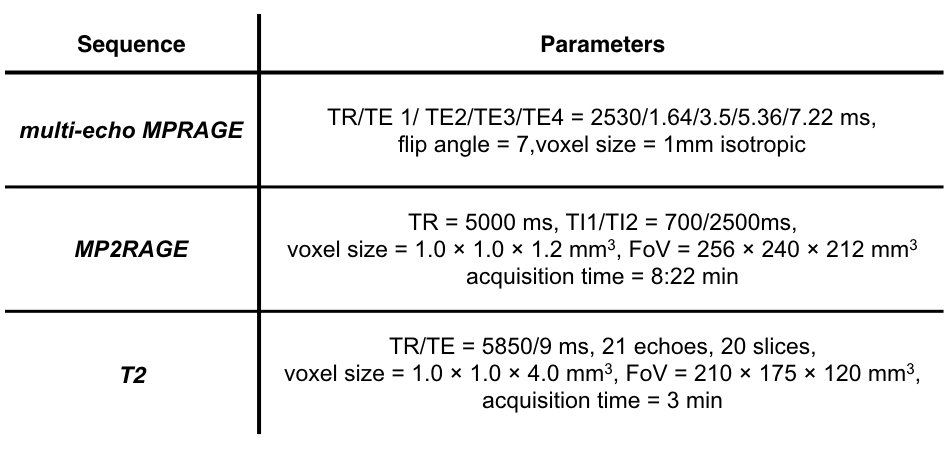
MRI Protocol and parameters of MPRAGE, MP2RAGE and T2 relaxometry sequences.