1165
Using simultaneous PET-MRI to investigate the mechanisms of neurodegeneration in frontotemporal dementia1Clinical Neurological Sciences, University of Western Ontario, London, ON, Canada, 2Lawson Health Research Institute, London, ON, Canada, 3Medical Biophysics, University of Western Ontario, London, ON, Canada
Synopsis
Frontotemporal dementia (FTD) is a neurodegenerative disease characterized by progressive degeneration of brain function and structure. We present a proof-of-principle study in which simultaneous PET-MRI is used to inform on the pathophysiology of progressive neurodegeneration. By correlating glucose metabolism (PET) with functional connectivity (MRI), we found altered neuronal signaling in brain regions known to be critical in progression of FTD.
Purpose
Frontotemporal dementia (FTD) is a neurodegenerative disease characterized by progressive degeneration of brain function and structure. The latter is illustrated by atrophy of the frontal and temporal lobes, while the former has been demonstrated in resting state functional magnetic resonance imaging (rs-fMRI), predominantly by reduced connectivity in the salience network (including frontal, limbic, and insular cortices).1–3 In addition, 18F-fluorodeoxyglucose positron emission tomography (FDG-PET) has demonstrated that regional glucose metabolism (rGlu) decreases predominantly in the prefrontal cortex.4,5
The mechanisms underlying reductions in cerebral function in FTD are still poorly understood, in part because each separate imaging modality does not give a full representation of neural activity. However, recently it has been shown that by combining FDG-PET and rs-fMRI it is possible to assess the energetic demand of neural activity6,7, as well as gain insight into the directionality of signaling pathways.8
Herein, we build upon recent studies that have illustrated the correlation of rGlu and rs-fMRI in healthy participants and explore the possibility of using simultaneous PET-MRI to inform on the pathophysiology involved in the progressive degeneration of cerebral function in FTD.
Methods
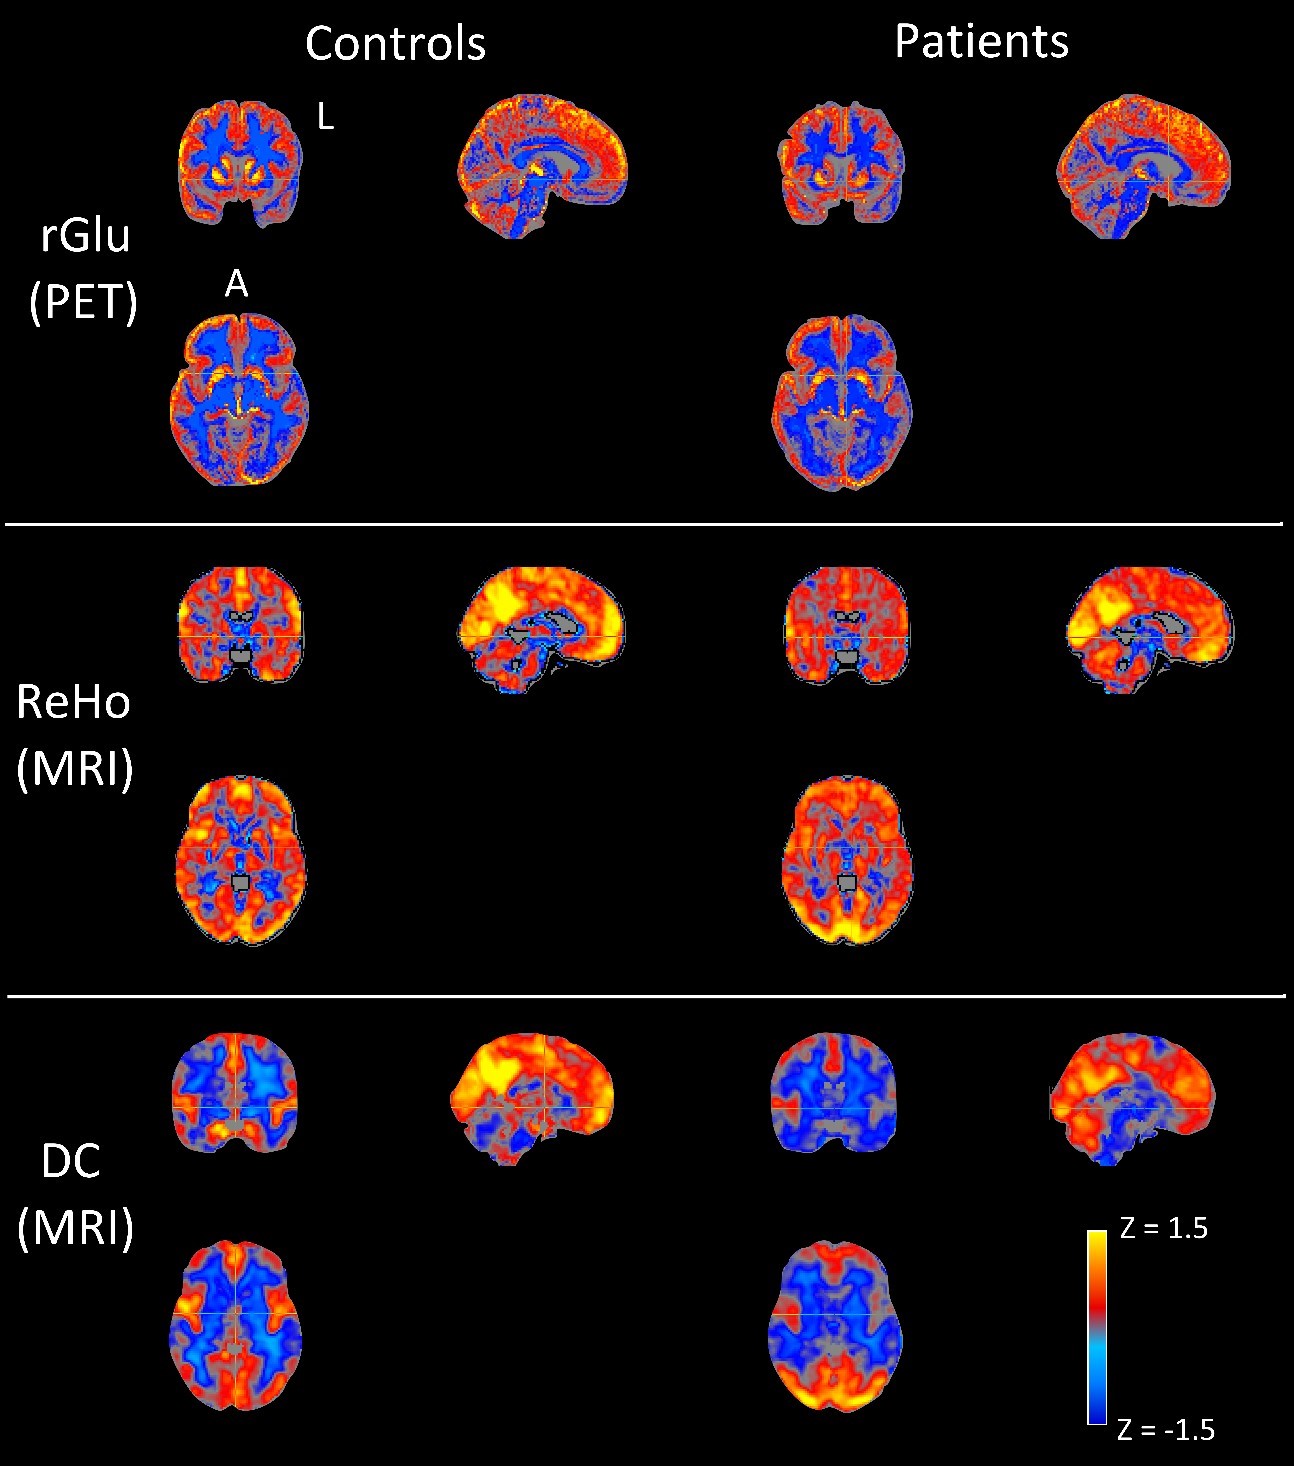
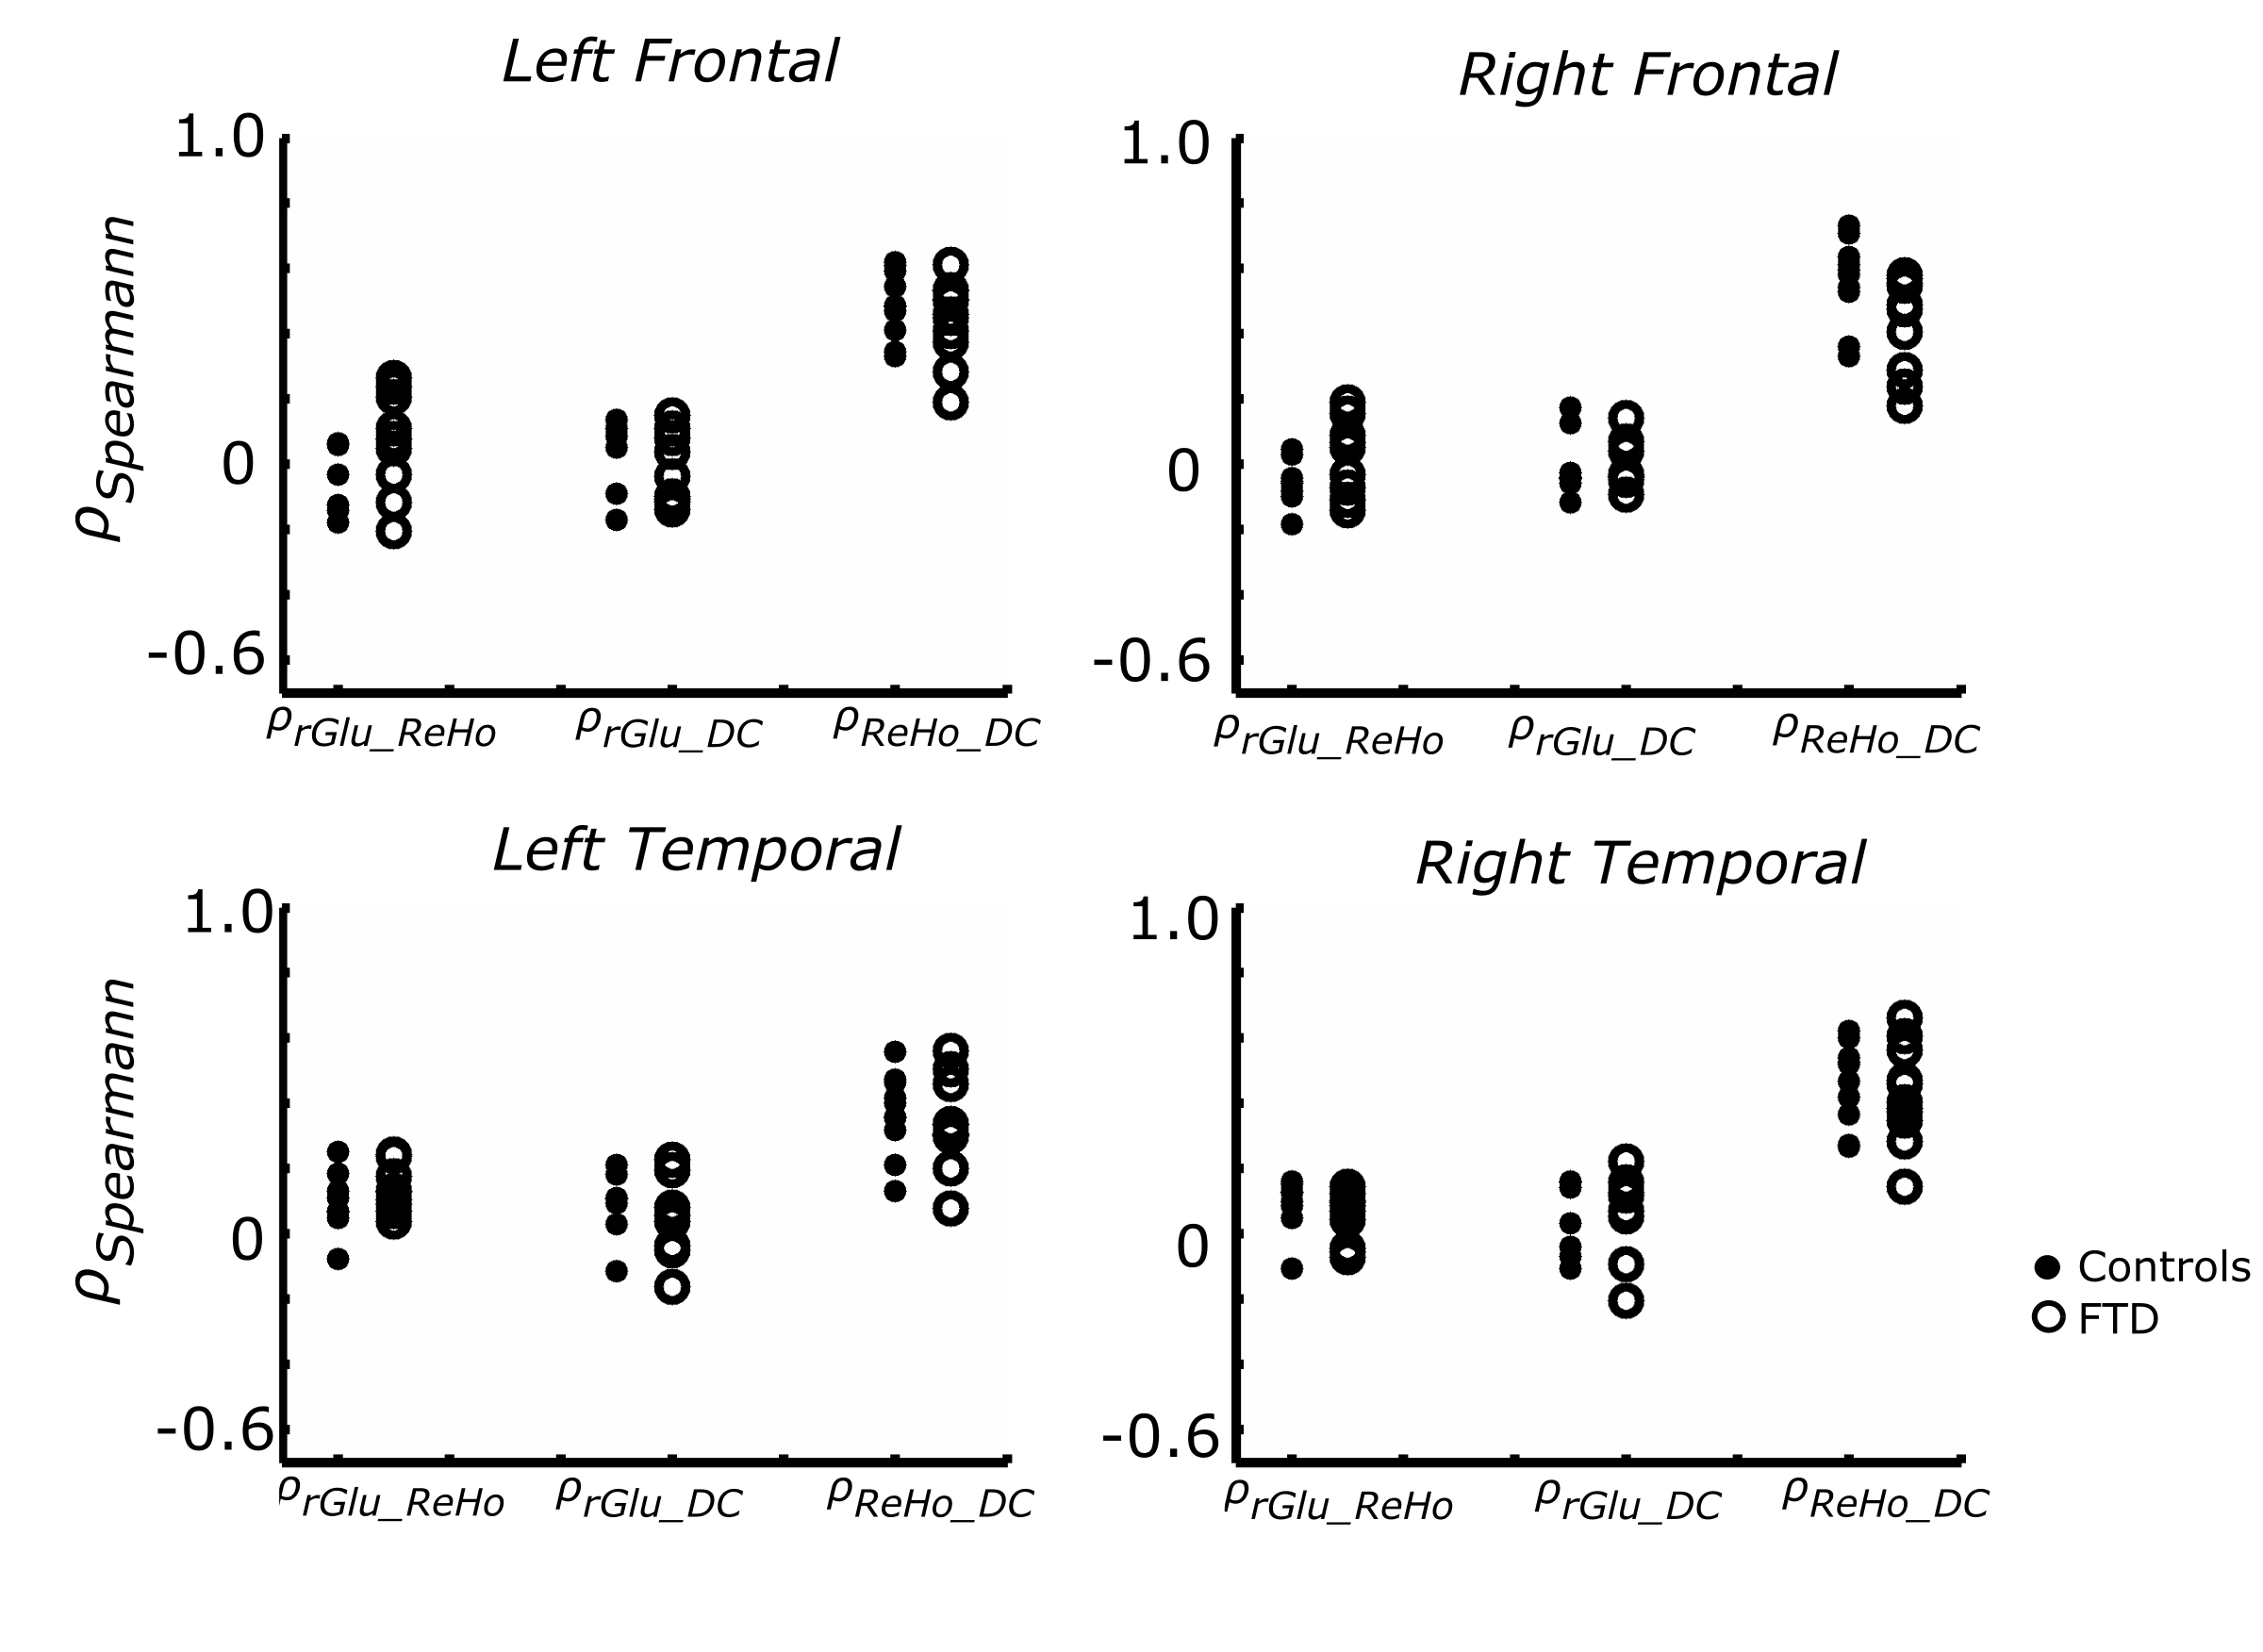
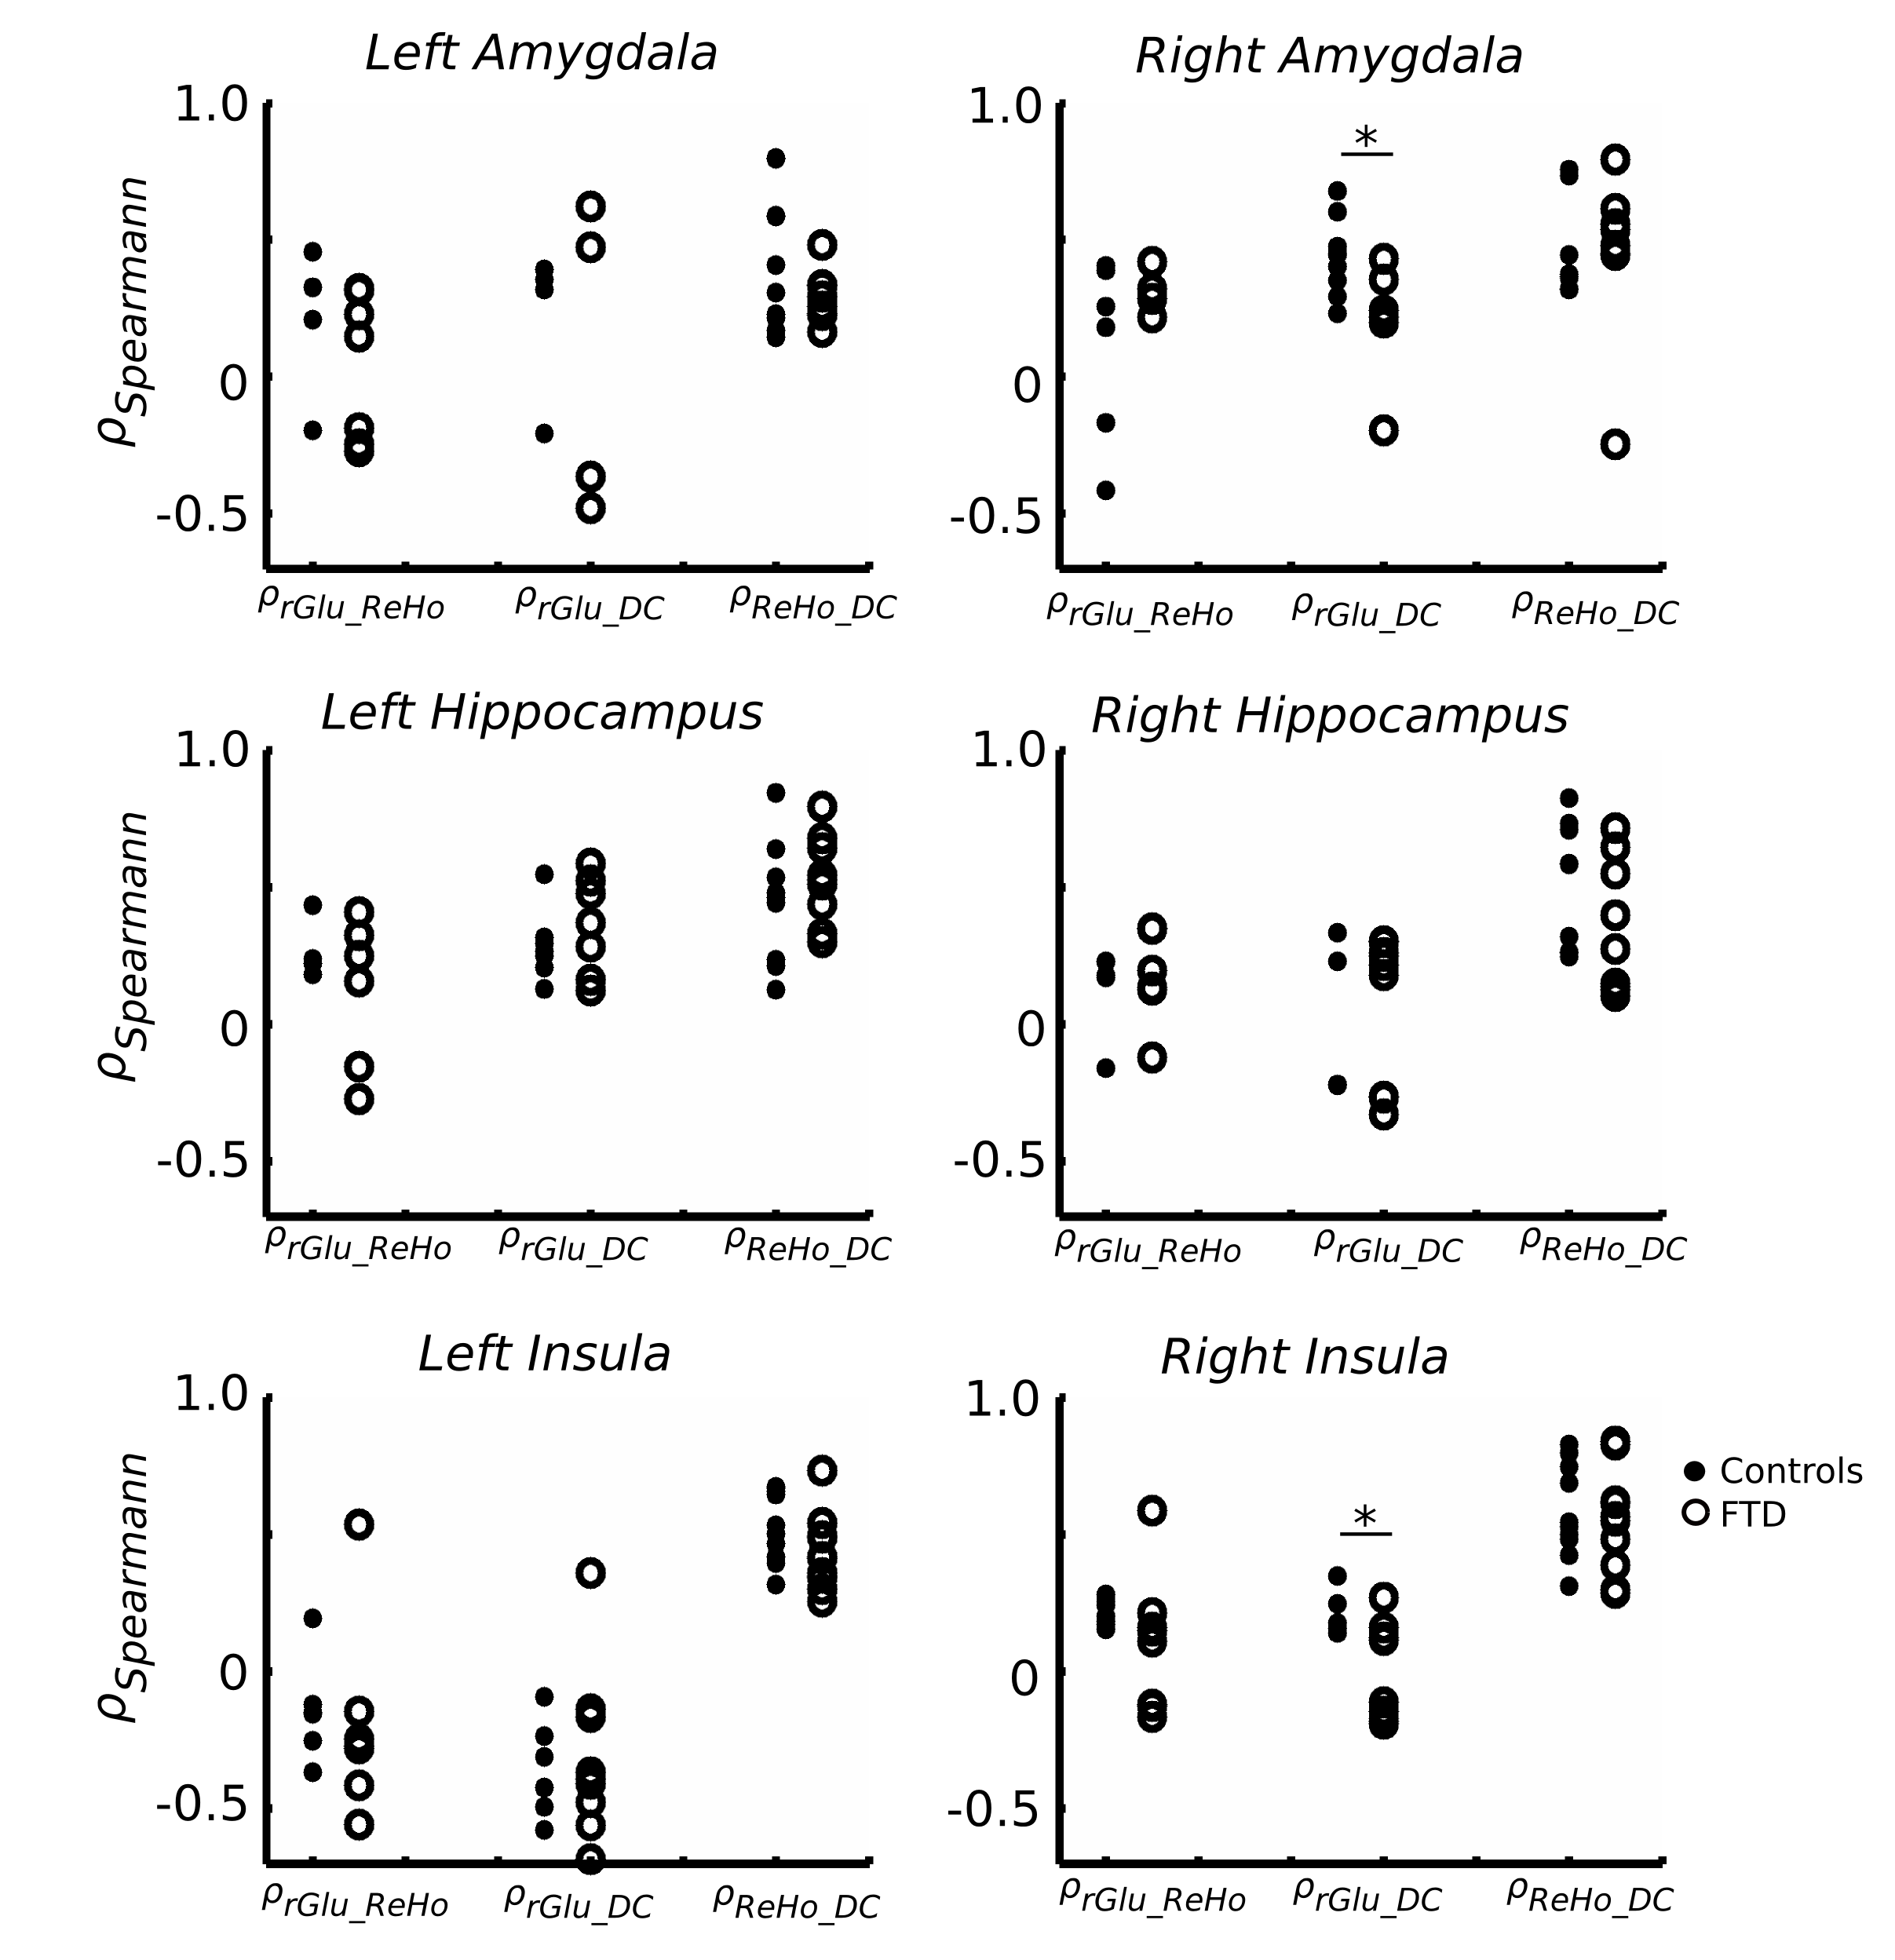
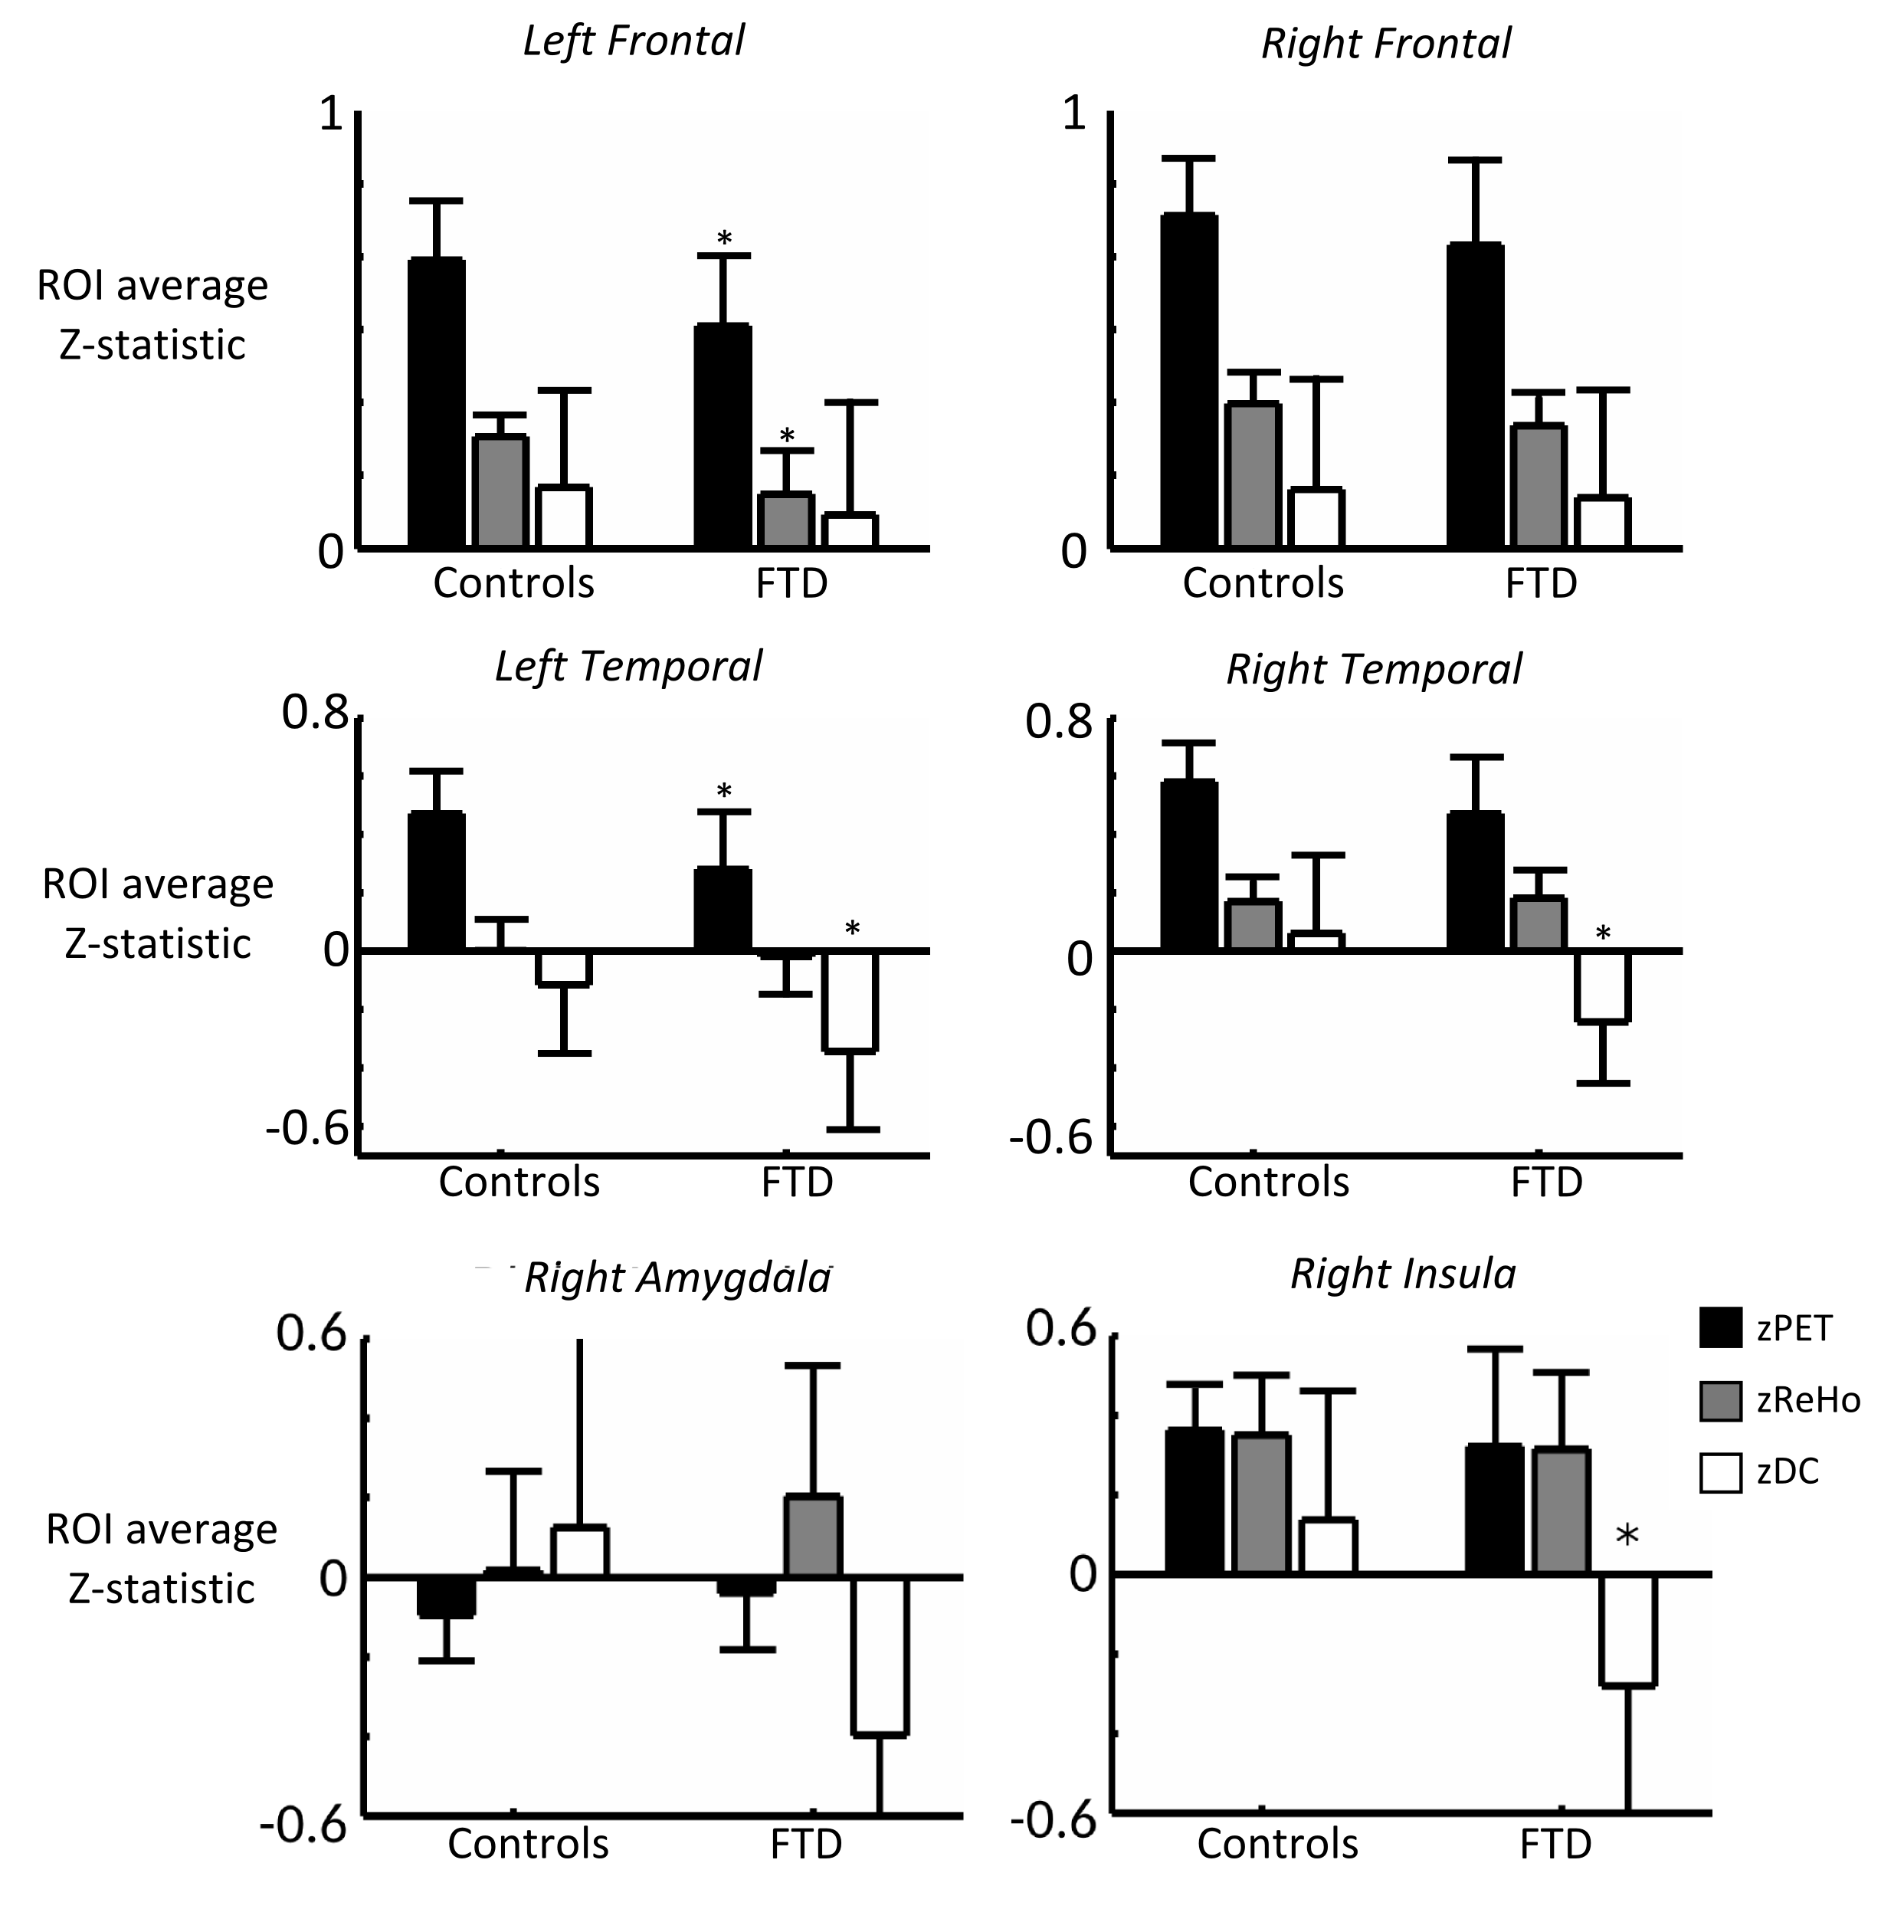
Informed consent was obtained for 11 FTD patients (65.8 ± 8.1 years, 6 males, behavioral variant) and 10 age-matched controls (67.6 ± 6.6 years, 4 males) to undergo simultaneous 18F-FDG-PET and MRI imaging (Siemens Biograph mMR system, 3T MRI subsystem). FDG-PET activity images were reconstructed from listmode data acquired between 45-60 minutes after injection and corrected for partial volume effects.9,10 rs-fMRI images were acquired with a two-dimensional EPI sequence (TR/TE = 3/0.030s, 164 volumes, voxel size 3x3x3 mm3) and motion corrected (32 nuisance regressors11). All functional images were linearly registered to the individual's high resolution structural scan (MPRAGE) and to the MNI152 template (non-linear registration). Regional homogeneity (ReHo) and weighted degree of centrality (DC), local and global voxelwise measures of rs-fMRI connectivity, were calculated according to previously described methods.7,12 Z-statistic maps of ReHo, DC, and rGlu were calculated by subtracting the whole brain average and dividing by the whole brain standard deviation (group average Z-maps in Fig 1). Spatial correlation was calculated with Spearman’s correlation coefficient (ρ) between ZrGlu & ZReHo (ρrGlu_ReHo), ZrGlu & ZDC (ρrGlu_DC), and ZReHo & ZDC (ρReHo_DC) for voxels with a grey matter fraction (fGM) > 0.6, and fGM was included as covariant. Regional average multi-modal correlations were calculated for the frontal and temporal lobes, insular cortex and selected regions in the limbic system (amygdala and hippocampus), which were masked from the MNI standard and Harvard-Oxford atlases.Results
No significant difference in correlations of glucose metabolism and local and global functional connectivity was found between controls and FTD patients in the frontal or temporal lobes (Fig 2), which is likely due to concomitant changes (or lack thereof) in rGlu, ReHo and DC (Fig 4). However, FTD patients had significantly lower correlations between rGlu and global connectivity in the right amygdala and right insular cortex (p < 0.05, Fig 3), which are likely due to stronger decreases in DC than for rGlu (Fig 4).Discussion
The correlation between glucose metabolism and functional connectivity may hold true in FTD patients, as it does for healthy age-matched controls, in frontal and temporal lobes. However, our results suggest that not only is global connectivity from the right amygdala and insula reduced during rs-fMRI in FTD patients, but specifically it is the signaling from, rather than to, these regions that was reduced. This can be inferred based on the hypothesis that directionality of signaling can be determined because the majority of glucose metabolism occurs post-synaptically8. Regional glucose metabolism, particular in the right insula, remained unaltered while global connectivity (ZDC), and hereby ρrGlu_DC, was reduced. This result reaffirms the right insula as a key region in the pathophysiology of FTD1 and, together with the concomitant decreases in metabolism and functional connectivity in the frontal and temporal lobes, gives in vivo insight into the hypothesis that progressive neurodegeneration occurs via functional and anatomical networks (Network Degeneration Hypothesis).13Conclusion
Simultaneous PET-MRI can be used to further investigate the pathophysiology of progressive neurodegeneration in FTD. Future work includes expanding the small cohorts used here, as well as specifically probing signaling pathways with insular cortex involvement, e.g. with task-based fMRI.Acknowledgements
This work was funded by a Research Initiative Grant from the Schulich School of Medicine and Dentistry, Western University.References
1. Seeley WW. Anterior insula degeneration in frontotemporal dementia. Brain Structure and Function. 2010;1–11.
2. Farb NAS, Grady CL, Strother S, Tang-Wai DF, Masellis M, Black S, et al. Abnormal network connectivity in frontotemporal dementia: Evidence for prefrontal isolation. Cortex. 2013;49(7):1856–73.
3. Premi E, Cauda F, Gasparotti R, Diano M, Archetti S, Padovani A, et al. Multimodal fMRI resting-state functional connectivity in Granulin mutations: The case of fronto-parietal dementia. PLoS One. 2014;9(9).
4. Verfaillie SJ, Adriaanse S, Binnewijzend MA, Benedictus M, Ossenkoppele R, Wattjes M, et al. Cerebral perfusion and glucose metabolism in Alzheimer’s disease and frontotemporal dementia: two sides of the same coin? Eur Radiol. 2015;1–10.
5. Ishii K. PET Approaches for Diagnosis of Dementia. AJNR Am J Neuroradiol. 2013;
6. Tomasi D, Wang GJ, Volkow ND. Energetic cost of brain functional connectivity. Proc Natl Acad Sci U S A. 2013;110(33):13642–7.
7. Aiello M, Salvatore E, Cachia A, Pappatà S, Cavaliere C, Prinster A, et al. Relationship between simultaneously acquired resting-state regional cerebral glucose metabolism and functional MRI: A PET/MR hybrid scanner study. Neuroimage. 2015;113:111–21.
8. Riedl V, Utz L, Castrillón G, Grimmer T, Rauschecker JP, Ploner M, et al. Metabolic connectivity mapping reveals effective connectivity in the resting human brain. Proc Natl Acad Sci. 2015;201513752.
9. Quarantelli M, Berkouk K, Prinster A, Landeau B, Svarer C, Balkay L, et al. Integrated software for the analysis of brain PET/SPECT studies with partial-volume-effect correction. J Nucl Med. 2004;45(2):192–201.
10. Rousset O, Rahmim A, Alavi A, Zaidi H. Partial Volume Correction Strategies in PET. PET Clinics. 2007. p. 235–49.
11. Power JD, Mitra A, Laumann TO, Snyder AZ, Schlaggar BL, Petersen SE. Methods to detect, characterize, and remove motion artifact in resting state fMRI. Neuroimage. 2014;84:320–41.
12. Zang Y, Jiang T, Lu Y, He Y, Tian L. Regional homogeneity approach to fMRI data analysis. Neuroimage. 2004;22(1):394–400.
13. Tahmasian M, Shao J, Meng C, Grimmer T, Diehl-Schmid J, Yousefi BH, et al. Based on the Network Degeneration Hypothesis: Separating Individual Patients with Different Neurodegenerative Syndromes in a Preliminary Hybrid PET/MR Study. J Nucl Med. United States; 2016;57(3):410–5.
Figures