1162
Multimodal multiparametric 18F-Fluciclovine PET/MRI improves computer-assisted detection of primary prostate cancer1Department of Circulation and Medical Imaging, NTNU, Norwegian University of Science and Technology, Trondheim, Norway, 2St. Olavs Hospital, Trondheim University Hospital, Trondheim, Norway, 3Department of Radiology, University of California San Diego, La Jolla, CA, United States, 4Department of Radiology and Nuclear Medicine, St. Olavs Hospital, Trondheim University Hospital, Trondheim, Norway, 5Department of Pathology, St. Olavs Hospital, Trondheim University Hospital, Trondheim, Norway, 6Department of Laboratory Medicine, Children’s and Women’s Health, NTNU, Norwegian University of Science and Technology, Trondheim, Norway, 7Department of Cancer Research and Molecular Medicine, NTNU, Norwegian University of Science and Technology, Trondheim, Norway, 8Department of Urology, St. Olavs Hospital, Trondheim University Hospital, Trondheim, Norway
Synopsis
Computer-assisted algorithms have been proposed to support radiological reading of multiparametric MRI (mpMRI) images for the detection of primary prostate cancer, but have limited sensitivity. In this work, we investigated if standardized uptake values (SUV) from combined 18F-Fluciclovine PET/mpMRI can improve automated tumor detection. We found that, at the same number of false positives, a model based on combined PET/mpMRI correctly detected more tumors than models based on mpMRI only or PET only. These findings suggest that there is a potential role for multimodal multiparametric 18F-Fluciclovine PET/MRI for computer-assisted detection of primary prostate cancer.
Purpose
Multiparametric MRI (mpMRI) including T2-weighted (T2W), diffusion weighted (DW) and dynamic contrast enhanced (DCE) MRI is the current imaging standard for prostate cancer diagnosis.1 Computer-assisted tumor detection algorithms have the potential to support radiological reading, but have limited sensitivity.2 The purpose of this study is to investigate if standardized uptake values (SUV) from combined 18F-Fluciclovine PET/mpMRI can be used to improve computer-aided detection of primary prostate cancer.Methods
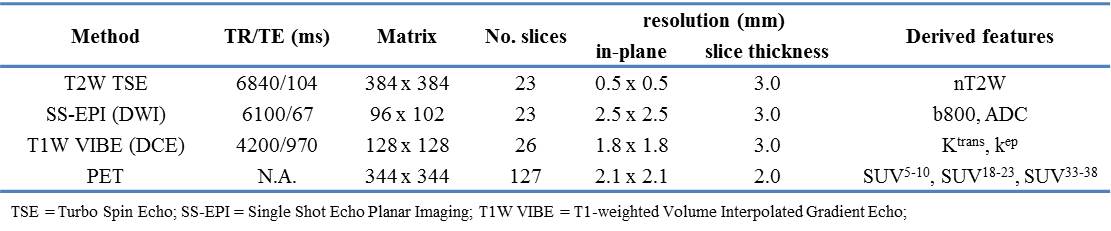
Acquisition: 28 high-risk patients (Gleason score ≥ 8 and/or PSA > 20 and/or clinical stage ≥ cT3) scheduled for prostatectomy with extended lymph node dissection underwent a PET/MRI exam on a 3 T Biograph mMR (Siemens, Erlangen, Germany) prior to surgery (Table 1).
Image processing: T2W images were intensity normalized (nT2W) to the levator ani muscle. DW images were corrected for distortion,3 after which apparent diffusion coefficient (ADC) maps were calculated using a mono-exponential decay model (including b=50/400/800 s/mm2). Images at b=800 s/mm2 (b800) were also used for further analysis. Volume transfer constant (Ktrans) and transfer rate constant (Kep) maps were calculated from motion-corrected DCE images using the extended Toft’s model with a population-based arterial input function.4,5 PET data from 5-10, 18-23, and 33-38 minutes post-injection were reconstructed to SUV maps (SUV5-10, SUV18-23, and SUV33-38, respectively) using a manufacturer-provided algorithm (Siemens HDPET, 3 iterations, 21 subsets, 4 mm FWHM Gaussian filter).6 All images were co-registered and resampled to T2W using elastix.7
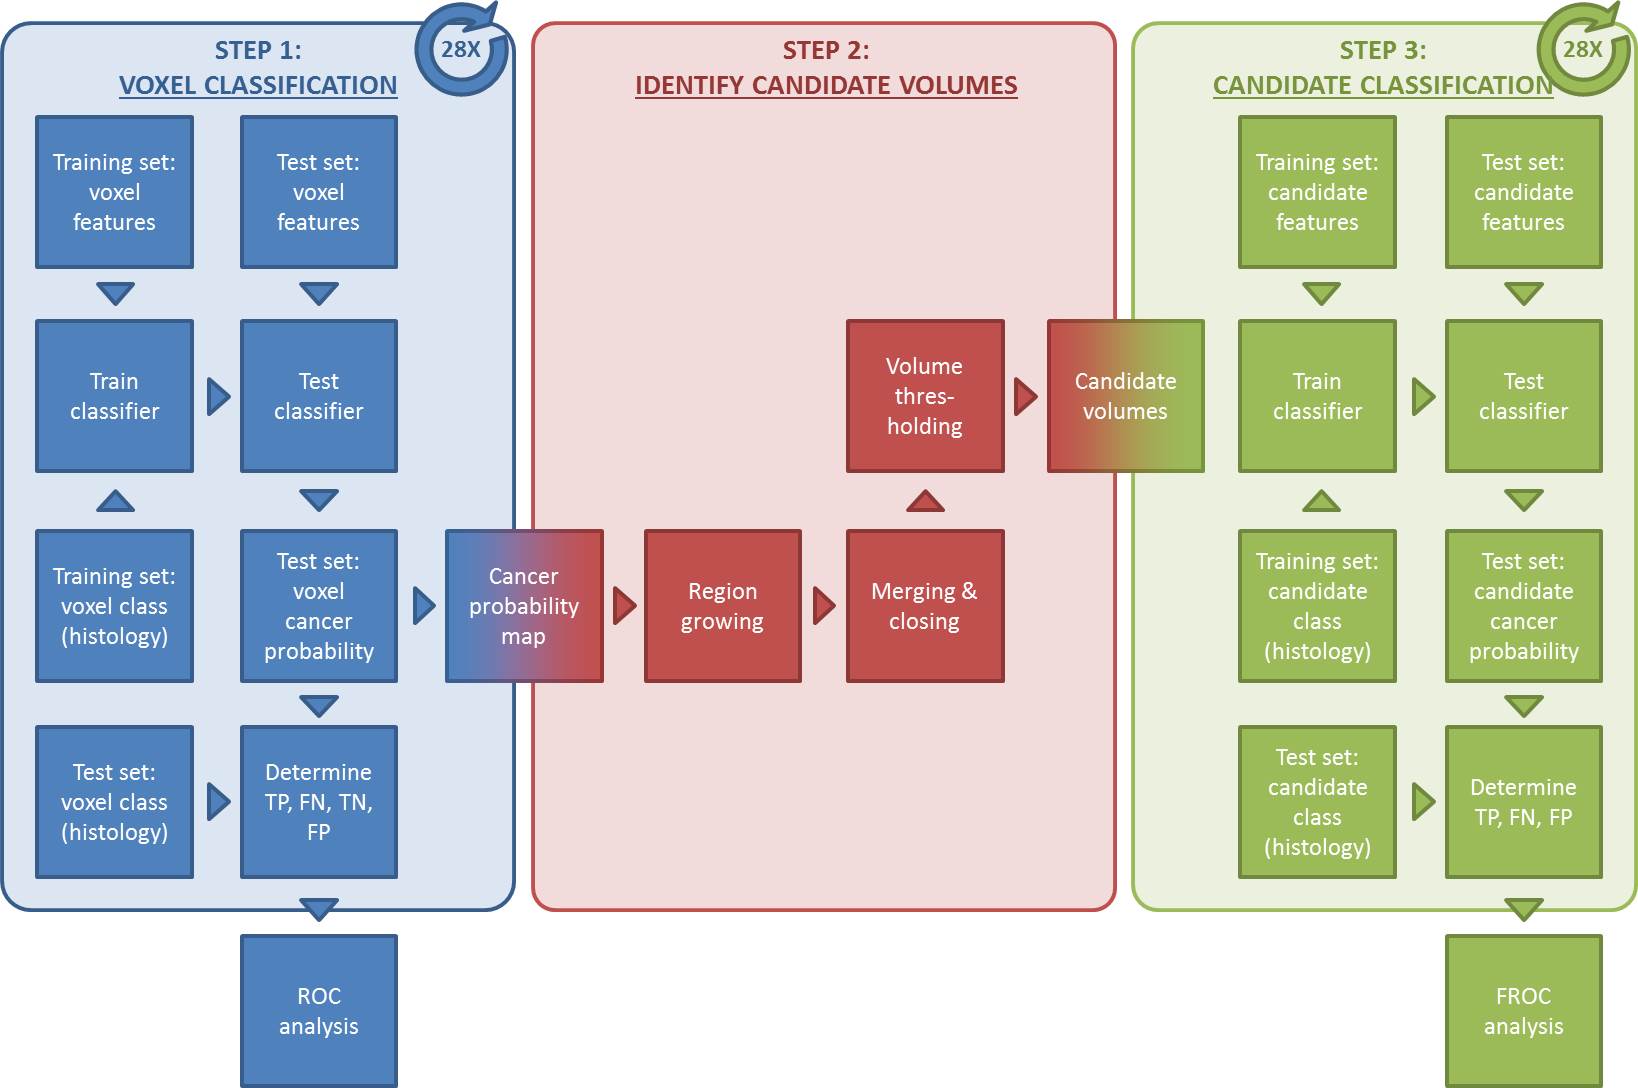
Voxel classification: Volumes-of-interest (VOIs) of tumor, benign prostatic hyperplasia (BPH), and inflammation were delineated on T2W images in OsiriX,8 while using spatially-matched, whole-mount hematoxylin and eosin stained histology slides marked by a pathologist as a reference. Each voxel was labeled as tumor or benign tissue (BPH + inflammation + healthy) and feature vectors of nT2W, ADC, b800, Ktrans, Kep, SUV5-10, SUV18-23, and SUV33-38 values were created. Leave-one-patient-out cross validation was performed to train and test 3 support vector machine (SVM) classifiers based on all MR features, all PET features, and all PET/MRI features together, respectively (Figure 1, step 1).
Candidate classification: Tumor candidate volumes were created by performing a series of morphological operations on the cancer probability maps that were output of the voxel classification step (Figure 1, step 2). Candidate volumes were labeled tumor if their center of gravity was within 10 mm of that of a true tumor (histology),2 and benign tissue otherwise. Candidate features were calculated as the mean, standard deviation, minimum, maximum, and lower and higher 25th percentile of the voxel feature values within the candidate volume. Again, leave-one-patient-out cross validation was performed to train and test 3 SVM classifiers based on all MR features, all PET features, and all PET/MRI features together, respectively (Figure 1, step 3).
Statistical analysis: Receiver operating characteristic (ROC) and free receiver operating characteristic (FROC) analyses were performed to compare the classification performance at the voxel and candidate level, respectively.9 FROC analysis was performed for all tumors (n=40) and for index tumors only (n=28). Bootstrapping (n=1000) was used to calculate confidence intervals and test statistical differences. All calculations were performed in MATLAB (Mathworks, Natick, MA, USA).
Results
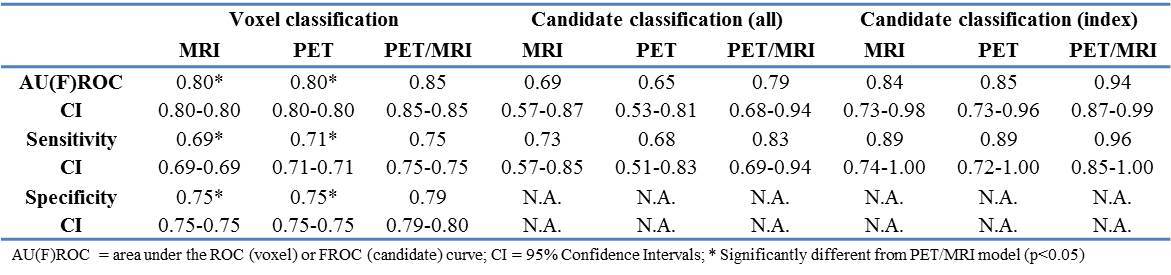
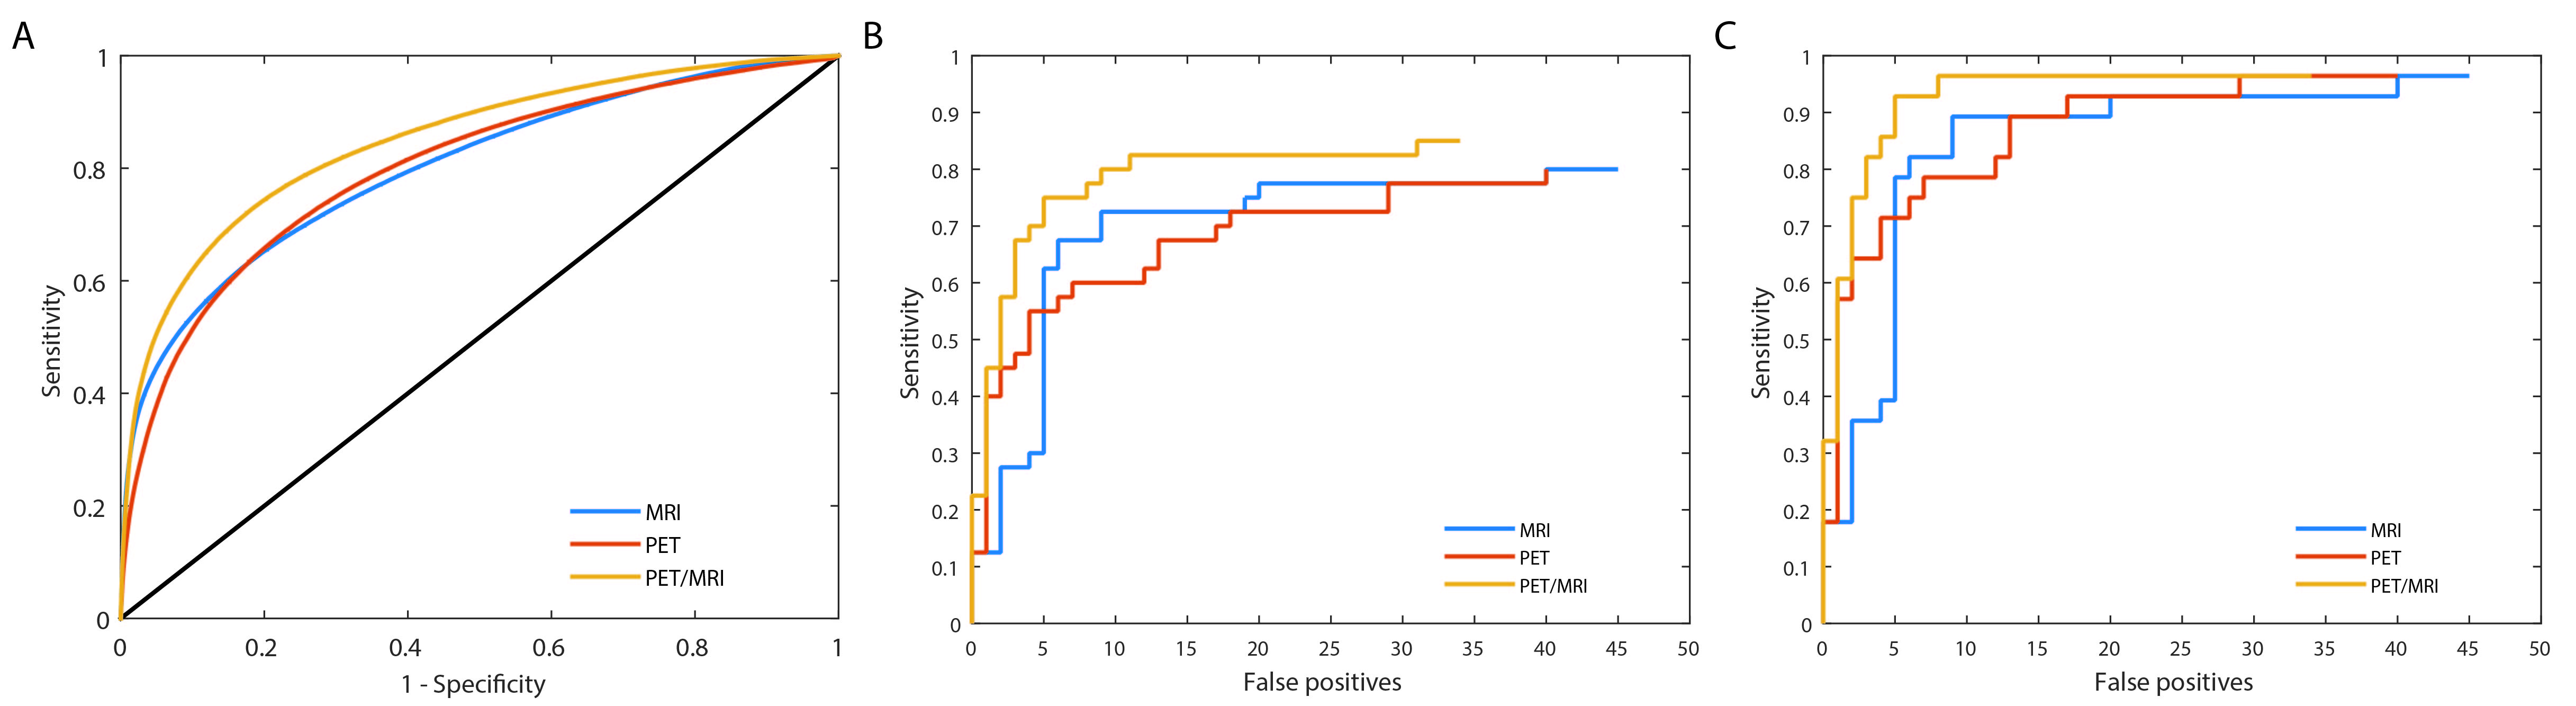
Voxel classification: 1258768 (304690 tumor, 954078 benign tissue) voxels were analyzed. The area under the ROC curve, sensitivity, and specificity were significantly higher for the PET/MRI model than for the PET (p<0.05) and MRI (p<0.05) models (Table 2, Figure 2A).
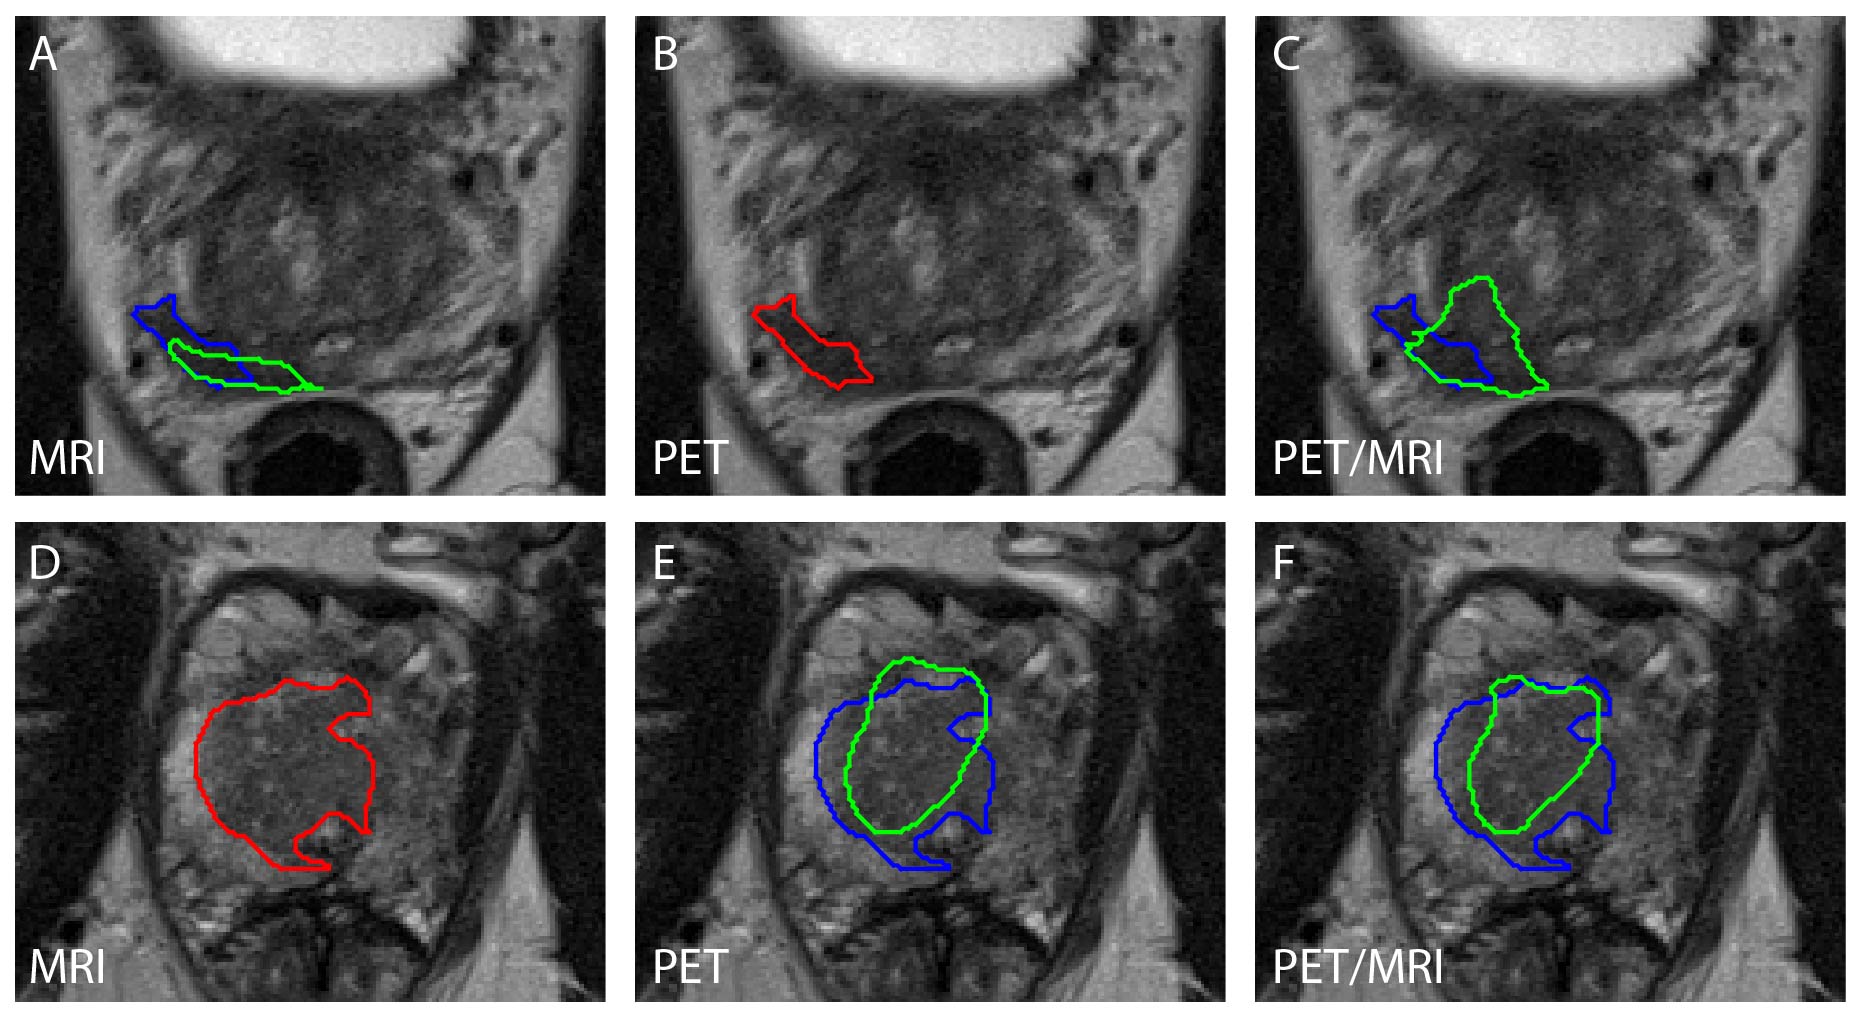
Candidate classification: 77 (32 tumor, 45 benign tissue), 72 (32 tumor, 40 benign tissue), and 68 (34 tumor, 34 benign tissue) candidate volumes were created and analyzed for the MRI, PET, and PET/MRI models, respectively. The area under the FROC curve and sensitivity were higher for the PET/MRI model than for the PET and MRI models, but these differences were not statistically significant. This was true for all tumors (Table 2, Figure 2B) and index tumors only (Table 2, Figure 2C). Examples of the estimated tumor contours are shown in Figure 3.
Discussion
18F-Fluciclovine PET/CT is mostly used for detection of prostate cancer recurrence following definitive therapy,10 but its potential for detection of primary tumors in conjoint use with MRI has also been described.6,11 We found that combining PET and MRI-derived features improved computer-assisted tumor detection in comparison to either modality alone, at least for high-risk patients. In future work we will pursue improving the candidate classification step by including shape and size-based features,2 and validate the methods in a larger and more diverse patient cohort.Conclusion
The results from this PET/MRI study indicate that multimodal multiparametric 18F-Fluciclovine PET/MR imaging improves computer-assisted detection of primary prostate cancer in comparison to PET or MRI alone.Acknowledgements
No acknowledgement found.References
1. Heidenreich A, Bastian PJ, Bellmunt J, et al. EAU guidelines on prostate cancer. part 1: screening, diagnosis, and local treatment with curative intent-update 2013. Eur Urol. 2014;65(1):124-137.
2. Litjens G, Debats O, Barentsz J, et al. Computer-aided detection of prostate cancer in MRI. IEEE Trans Med Imaging. 2014;33(5):1083-92.
3. Holland D, Kuperman JM, Dale AM. Efficient correction of inhomogeneous static magnetic field-induced distortion in Echo Planar Imaging. Neuroimage. 2010;50(1):175-83.
4. Tofts PS, Kermode AG. Measurement of the blood-brain barrier permeability and leakage space using dynamic MR imaging. 1. Fundamental concepts. Magn Reson Med. 1991;17(2):357-67.
5. Parker GJ, Roberts C, Macdonald A, et al. Experimentally-derived functional form for a population-averaged high-temporal-resolution arterial input function for dynamic contrast-enhanced MRI. Magn Reson Med. 2006;56(5):993-1000.
6. Elschot M, Selnæs KM, Sandsmark E, et al. A PET/MRI study towards finding the optimal [18F]Fluciclovine PET protocol for detection and characterisation of primary prostate cancer. Eur J Nucl Med Mol Imaging. 2016;[Epub ahead of print]
7. Klein S, Staring M, Murphy K, et al. elastix: a toolbox for intensity-based medical image registration. IEEE Trans Med Imaging. 2010;29(1):196-205.
8. Rosset A, Spadola L, Ratib O, et al. OsiriX: An Open-Source Software for Navigating in Multidimensional DICOM Images. J Digit Imaging. 2004;17:205-16.
9. Bunch PC, Hamilton JF, Sanderson KG, et al. A free-response approach to the measurement and characterization of radiographic-observer performance. J App Photographic Eng. 1978;4(4):165–71
10. Schuster DM, Nieh PT, Jani AB, et al. Anti-3-[(18)F]FACBC positron emission tomography-computerized tomography and (111)In-capromab pendetide single photon emission computerized tomography-computerized tomography for recurrent prostate carcinoma: results of a prospective clinical trial. J Urol. 2014;191(5):1446-53.
11. Turkbey B, Mena E, Shih J, et al. Localized prostate cancer detection with 18F FACBC PET/CT: comparison with MR imaging and histopathologic analysis. Radiology. 2014;270(3):849-56.
Figures