1161
Assessing the repeatability of absolute CMRO2 measurements from calibrated fMRI1CUBRIC, Cardiff University, Cardiff, United Kingdom
Synopsis
O2 metabolism is a crucial biomarker of brain physiology. We aim at measuring the repeatability of estimates of O2 metabolism obtained with a dual calibrated fMRI experiment and a newly proposed parameter estimation approach based on a forward model. The analysis is carried out on two datasets from volunteers scanned at rest. The performances are shown to depend on the physiological parameter considered, resolution (bulk or voxel-wise level) and decreasing from within- to between-sessions repeatability. Overall the repeatability is demonstrated to be comparable with PET and a previous calibrated fMRI method, but supplying a more complete mapping of brain O2 metabolism.
Introduction
As energy release in the brain is largely oxidative, the measurement of the cerebral metabolic rate of oxygen consumption (CMRO2) is a highly desirable biomarker for quantifying brain activity and tissue viability1. Among the promising new techniques for mapping CMRO2 are dual calibrated fMRI (dcFMRI) methods, which exploit simultaneous measurements of BOLD and ASL signals during a hypercapnic-hyperoxic experiment that modulates brain blood flow and oxygenation2,3,4. In conjunction with this experimental method we have recently suggested a parameter estimation approach based on a forward model, allowing us to simultaneously map oxygen extraction fraction (OEF) and cerebral blood flow (CBF), and therefore CMRO2, as well as cerebrovascular reactivity (CVR) and cerebral blood volume (CBV)5. Here we assess the repeatability of this technique of non-invasive CMRO2 mapping.Aim
To characterise the repeatability of the estimates obtained with our newly proposed dcFMRI with forward modelling approach.Methods
Datasets from two studies involving the same dcFMRI protocol were considered, so that both within- and between- session repeatability could be characterised. The first dataset (within session dataset) includes ten healthy volunteers (4 females, 27.4±10 y), who underwent the dcFMRI experiment at rest twice in a single session (Figure 1). The second dataset (between session dataset) is from a previously presented study on the effects of caffeine6 with sixteen healthy participants (8 females, 24.7±5.1 y). In this second case each participant was scanned at rest on two different days (30.1±18.8 days apart), each day including a first scan followed by another one 45 minutes later. Only the sessions in which caffeine was not administered were considered for the repeatability study (Figure 1). During each 18 min dcFMRI acquisition a respiratory task was performed, including three periods of hypercapnia (5% CO2) interleaved with two periods of hyperoxia (50% O2). For both datasets the dcFMRI acquisition consisted of a dual-gradient echo (TE1 = 2.7 ms, TE2 = 29 ms, 64x64, 3x3x7mm3, gap = 1 mm, 12 slices) with spiral k-space acquisition was used along with a PICORE tagging scheme and the QUIPSS II technique (TI1 = 700 ms, TI2 = 1500 ms). These data were analysed using our forward model5, leading to maps of OEF, CBF, CVR, CBV and CMRO2. For both within- and between- sessions repeatability indices of correlation, coefficient of variation (CV) and intraclass correlation coefficient (ICC7) where calculated for bulk grey matter and at voxel-wise resolution (all indices summarised in Figure 1, bottom).Results
The correlation analysis for the within-session dataset show high values of R2, especially for OEF, CBF and CBV (Figure 2), while performance is lower for the between-session dataset, in particular as regards CVR and CMRO2 (data not shown). Within- and between- sessions values of intra-subjects coefficient of variation (CVintra) calculated from bulk grey matter estimates for were found to be of 6.7±6.6% (mean±std.) and 10.5±9.7% for OEF, 6.9±6% and 5.5±4.7% for CBF, 12±9.7% and 12.3±10% for CMRO2 (Figure 3). Mean values of ICC indices (both ICCglobal and ICCspatial), typically show values above 0.6 ( “good”8) for all parameters, apart from the between-sessions, different day case (Figure 3). For all dataset and parameters, maps of <CVintra> show median values typically below 30%, with lower values for CBF while higher for CBV (Figure 4, 5). For both datasets, statistics for CVinter report a 2- to 3-fold decrease in performances (Figure 4, 5).Conclusions
Results show an overall consistency of the estimated physiological parameters with literature reports and a satisfactory level of repeatability with performance depending on the specific parameter under analysis, and whether voxel-wise or bulk grey matter estimates are considered. Calculated bulk CVintra values for OEF, CBF and CMRO2 are comparable with those reported in PET literature: 5.7%, 8.4% and 5.3% respectively for 9 and 9.3%, 8.8% and 5.3% respectively for 10. In comparison with other MRI methods, results are more variable than those reported for bulk estimates coupling TRUST measurements and phase contrast imaging for CBF (3.2%, 2.8% and 3.8% respectively 11) but comparable with another fMRI calibrated approach (about 4%, 13.5% and 15% respectively 12). In conclusion we have characterised the variability of the estimates obtained with our approach, showing repeatability comparable with PET and lower than bulk MR methods, but leading to a more complete mapping of brain haemodynamics and metabolism both in terms of amount of estimated physiological parameters and of higher spatial resolution.Acknowledgements
AM acknowledges the generous support of the Cardiff University President's Scholarships. RW and MG acknowledge the support of the UK Engineering and Physical Sciences Research Council (EP/K020404/1) and the Wellcome Trust Institutional Support Fund for this work. KM thanks the Wellcome Trust for its generous support via a Career Development Fellowship (WT090199). RW thanks the Higher Education Funding Council for Wales for support.References
[1] Lin, A.-L., Fox, P.T., Hardies, J., Duong, T.Q., Gao, J.-H., 2010. Nonlinear coupling between cerebral blood flow, oxygen consumption, and ATP production in human visual cortex. Proc. Natl. Acad. Sci. U.S.A. 107, 8446–51.
[2] Bulte, D.P., Kelly, M.E., Germuska, M.A., Xie, J., Chappell, M.A., Okell, T.W., Bright, M.G., Jezzard, P., 2012. Quantitative measurement of cerebral physiology using respiratory-calibrated MRI. Neuroimage 60, 582–91.
[3] Gauthier, C.J., Hoge, R.D., 2012. A generalized procedure for calibrated MRI incorporating hyperoxia and hypercapnia. Hum. Brain Mapp. 34, 1053–69.
[4] Wise, R.G., Harris, A.D., Stone, A.J., Murphy, K., 2013. Measurement of OEF and absolute CMRO2: MRI-based methods using interleaved and combined hypercapnia and hyperoxia. Neuroimage 83, 135–147.
[5] Germuska, M. a, Merola, A., Murphy, K., Babic, A., Richmond, L., 2016. A forward modelling approach for the estimation of oxygen extraction fraction by calibrated fMRI. Neuroimage 139, 313–323.
[6] Merola, A., Germuska, M.A., Warnert, E.A., Richmond, L., Helme, D., Khot, S., Murphy, K., Wise, R.G., 2016. The acute effects of caffeine on brain oxygen metabolism: a dual calibrated FMRI study. Proc. Intl. Soc. Mag. Reson. Med. 24 (2016).
[7] Shrout, P.E., Fleiss, J.L., 1979. Intraclass correlations: Uses in assessing rater reliability. Psychol. Bull. 86, 420-428.
[8] Cicchetti, D. V, 2001. The precision of reliability and validity estimates re-visited: distinguishing between clinical and statistical significance of sample size requirements. J. Clin. Exp. Neuropsychol. 23, 695–700.
[9] Coles, J.P., Fryer, T.D., Bradley, P.G., Nortje, J., Smielewski, P., Rice, K., Clark, J.C., Pickard, J.D., Menon, D.K., 2006. Intersubject variability and reproducibility of 15O PET studies. J. Cereb. Blood Flow Metab. 26, 48–57.
[10] Bremmer, J.P., Van Berckel, B.N.M., Persoon, S., Kappelle, L.J., Lammertsma, A. a., Kloet, R., Luurtsema, G., Rijbroek, A., Klijn, C.J.M., Boellaard, R., 2011. Day-to-day test-retest variability of CBF, CMRO2, and OEF measurements using dynamic 15O PET studies. Mol. Imaging Biol. 13, 759–768.
[11] Liu, P., Xu, F., Lu, H., 2013. Test-retest reproducibility of a rapid method to measure brain oxygen metabolism. Magn. Reson. Med. 69, 675–681.
[12] Lajoie, I., Tancredi, F.B., Hoge, R.D., 2016. Regional Reproducibility of BOLD Calibration Parameter M , OEF and Resting-State CMRO2 Measurements with QUO2 MRI. PLoS One 11(9), 1–31.
Figures
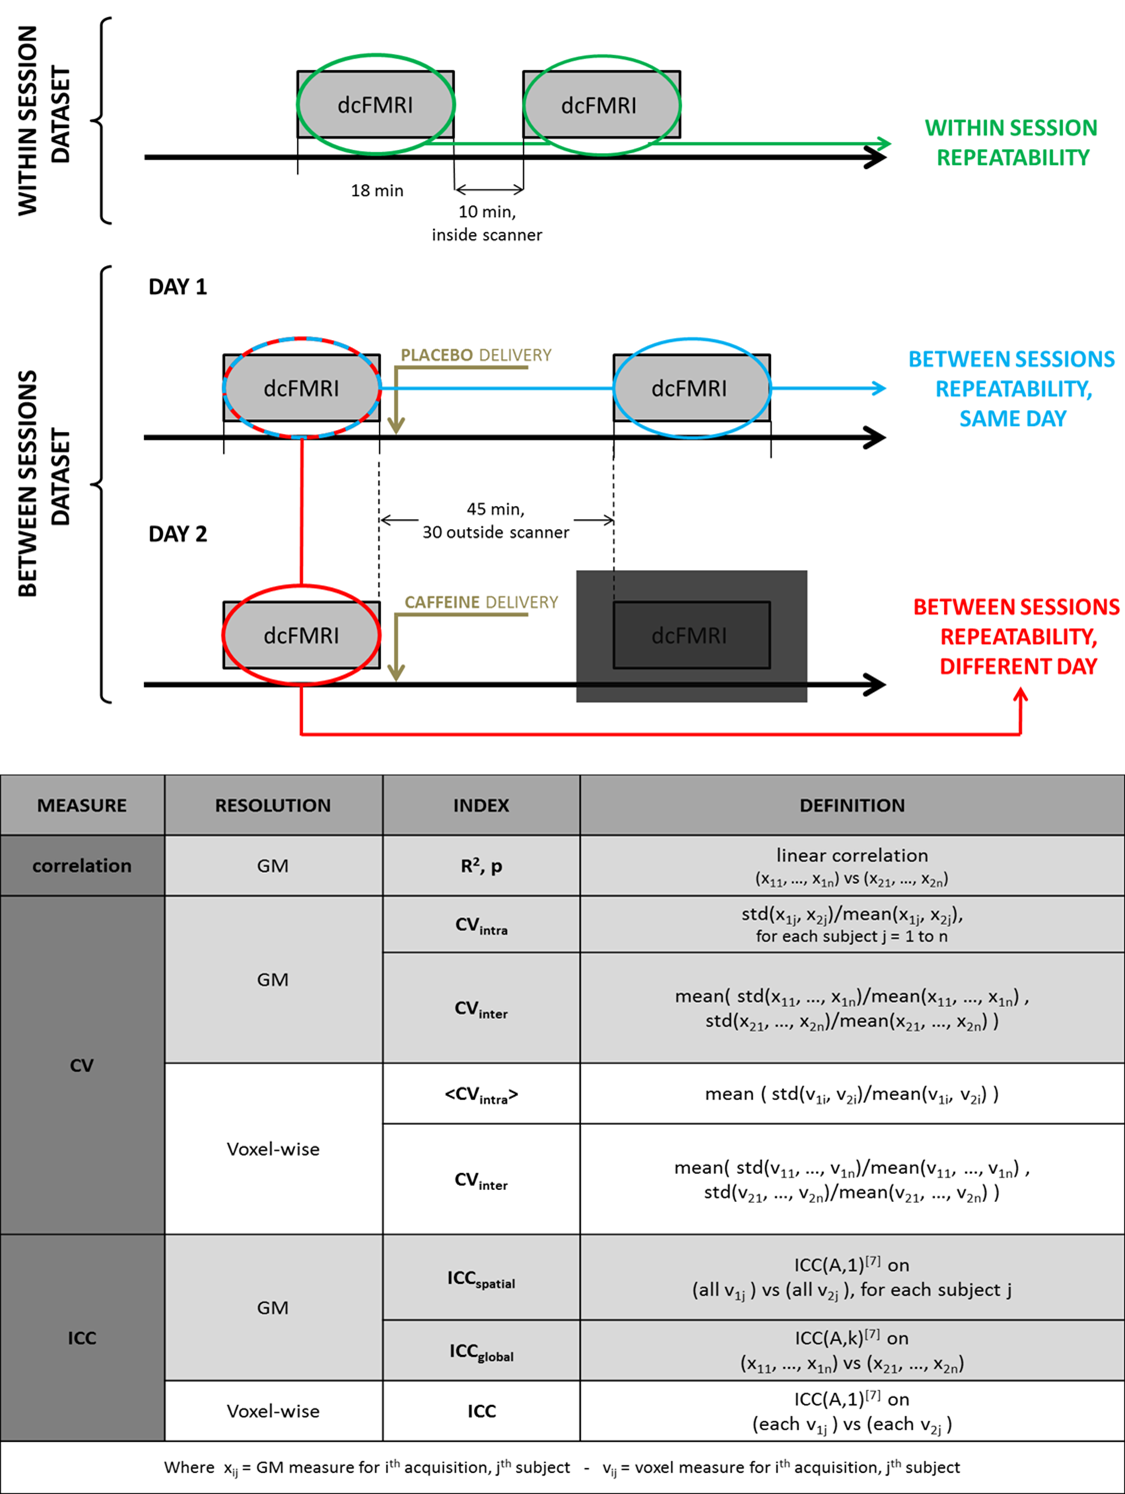
Figure 1: Top: diagram showing the experimental design for the within-session and between- sessions datasets.
Bottom: list of indices calculated for each estimated physiological parameter, both at grey matter (GM) and voxel-wise resolution. All indices were calculated for each repeatability instance considered: within session, between sessions - same day and between sessions - different day.
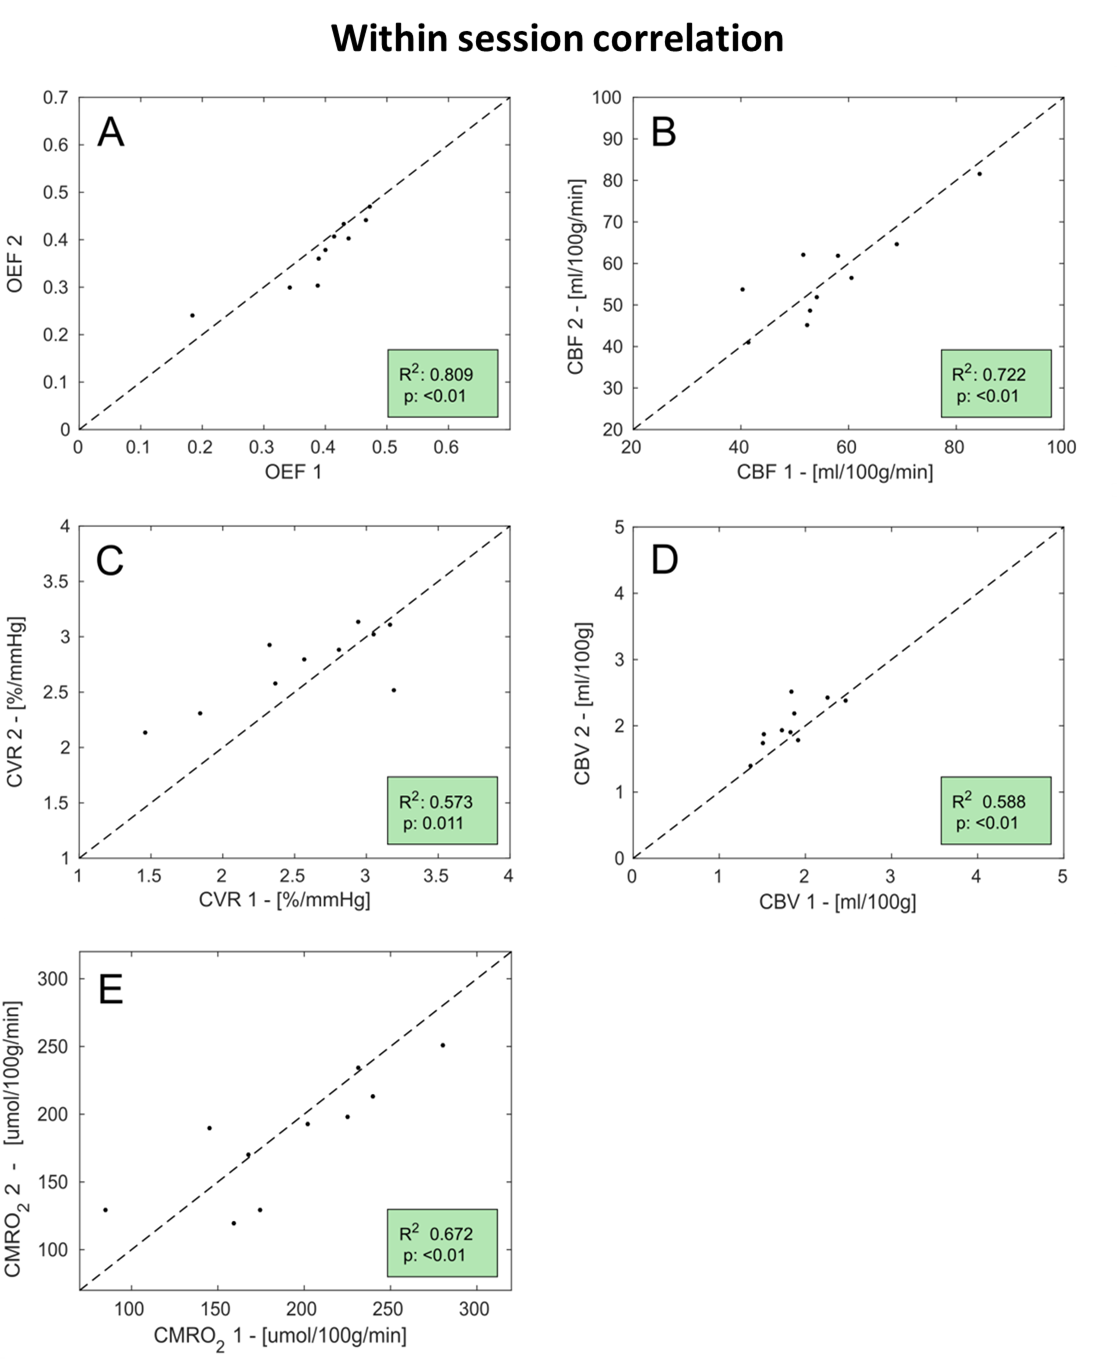

Figure 3: ICC and CV indices calculated at a bulk grey matter level for all estimated parameters. A,B: within session; C,D: between sessions, same day; E,F: between sessions, different day. ICCglobal is the ICC(A,k) calculated between subjects at a GM level and ICCspatial is the ICC(A,1) calculated within subjects across voxels; CVintra is the within-subject CV and CVinter is the between subject CV.
Note that ICCspatial (circles) and CVintra (dots) are calculated for each subject separately, while ICCglobal (stars) and CVinter (crosses) are calculated across subjects (see notation in Figure 1).
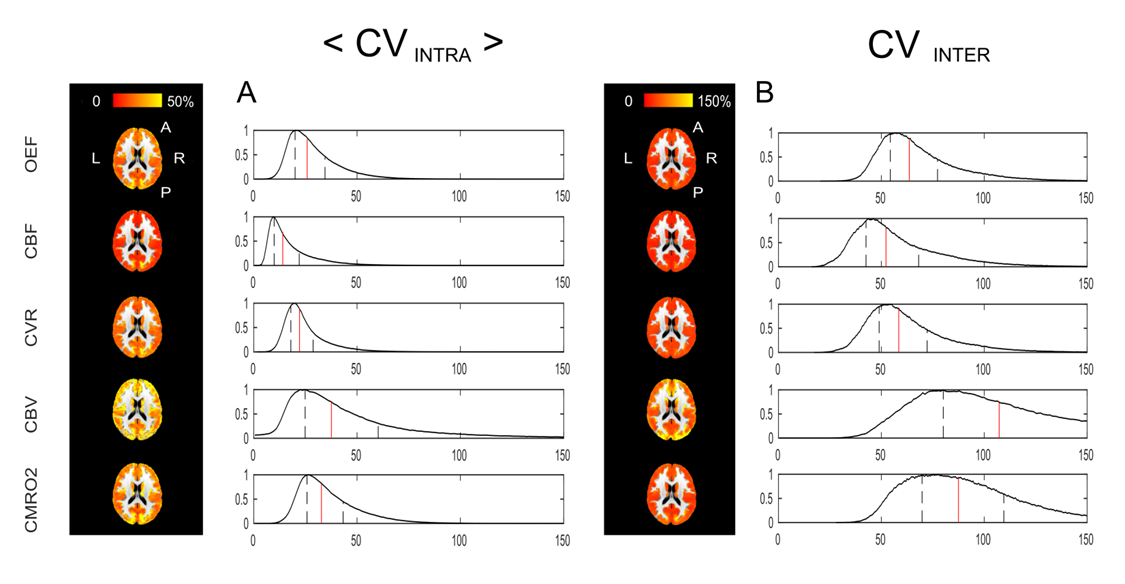
Figure 4: Voxel-wise CV indices calculated from the within-session dataset. Axial view of the calculated maps for each physiological parameter and relative histograms showing the distributions of the calculated values (in red the median and in black the interquartile range limits).
<CVintra> is the mean across subjects of the within-subject CV and CVinter is the between subject CV (see notation in Figure 1).
