1160
Systematically mapping anatomical connectivity in the macaque using combined electrical microstimulation and fMRI1McGovern Institute for Brain Research, Massachusetts Institute of Technology, Cambridge, MA, United States
Synopsis
Connectivity of prefrontal cortex was studied with electrical microstimulation and fMRI in the macaque.
Introduction
The connections of lateral prefrontal cortex (LPFC) can provide invaluable constraints for delineating its functional architecture. Although tracer studies have looked at connections of LPFC, it is difficult to achieve a clear and fine parcellation of this region due to the sparseness of injection sites and individual differences across animals. Moreover, the tracer results usually lack same-subject comparisons with neurophysiological observations in behaving animals. Here we mapped the connectivity of macaque LPFC in vivo using combined electrical microstimulation and fMRI (EM-fMRI).
Methods
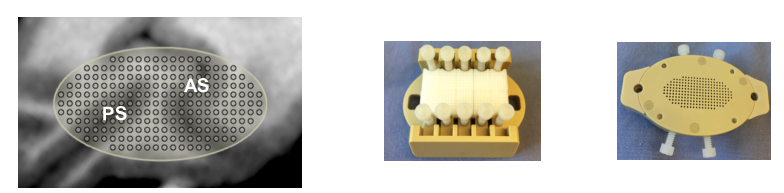
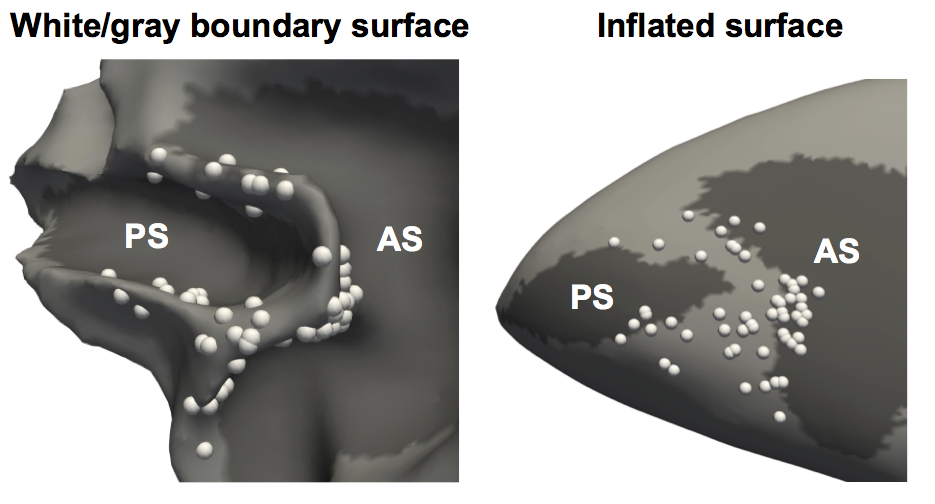
A male macaque monkey (8 kg) was implanted with an oval-shaped C-PEEK chamber (Mulliken et al. 2015) covering areas anterior to the arcuate sulcus (AS) and along the principal sulcus (PS). A custom-made PEEK drive and grid were used to insert electrodes accurately. Cables with inductors located every 10cm were used to attenuate the body coil transmit RF field from entering the electrodes. Stimulator and constant-current isolators were located outside the MRI RF shield. The system was tested to prevent the introduction of imaging artifacts from the stimulation equipment, and the stimulation equipment was tested to ensure it was not affected by the RF and gradient fields, which could potentially induce currents in the cables connected to electrodes. The animal was scanned in a Siemens 3T Tim Trio scanner under propofol anesthesia (0.1-0.4 mg/kg/min) with his eyes covered. Physiological monitoring of the animal was performed throughout the experiment. We delivered 500-μA charge-balanced biphasic pulses (200/100/200 μs, cathodal/off/anodal) for 210 ms every second in 30-second blocks interleaved with 30-second rest blocks. A MION contrast agent was injected ~60 minutes prior to data collection and the fMRI scans were performed using an EPI sequence (2 mm isotropic, TR/TE=2000ms/23ms). Under these parameters, two to four 8.5-min runs per electrode were usually sufficient to generate reliable fMRI activations. T1- and T2-weighted anatomical images were collected in every session and used in locating tips of electrodes. High order shimming was employed before data acquisition and fieldmap-based distortion correction was used in the functional data processing.
Results and Discussion
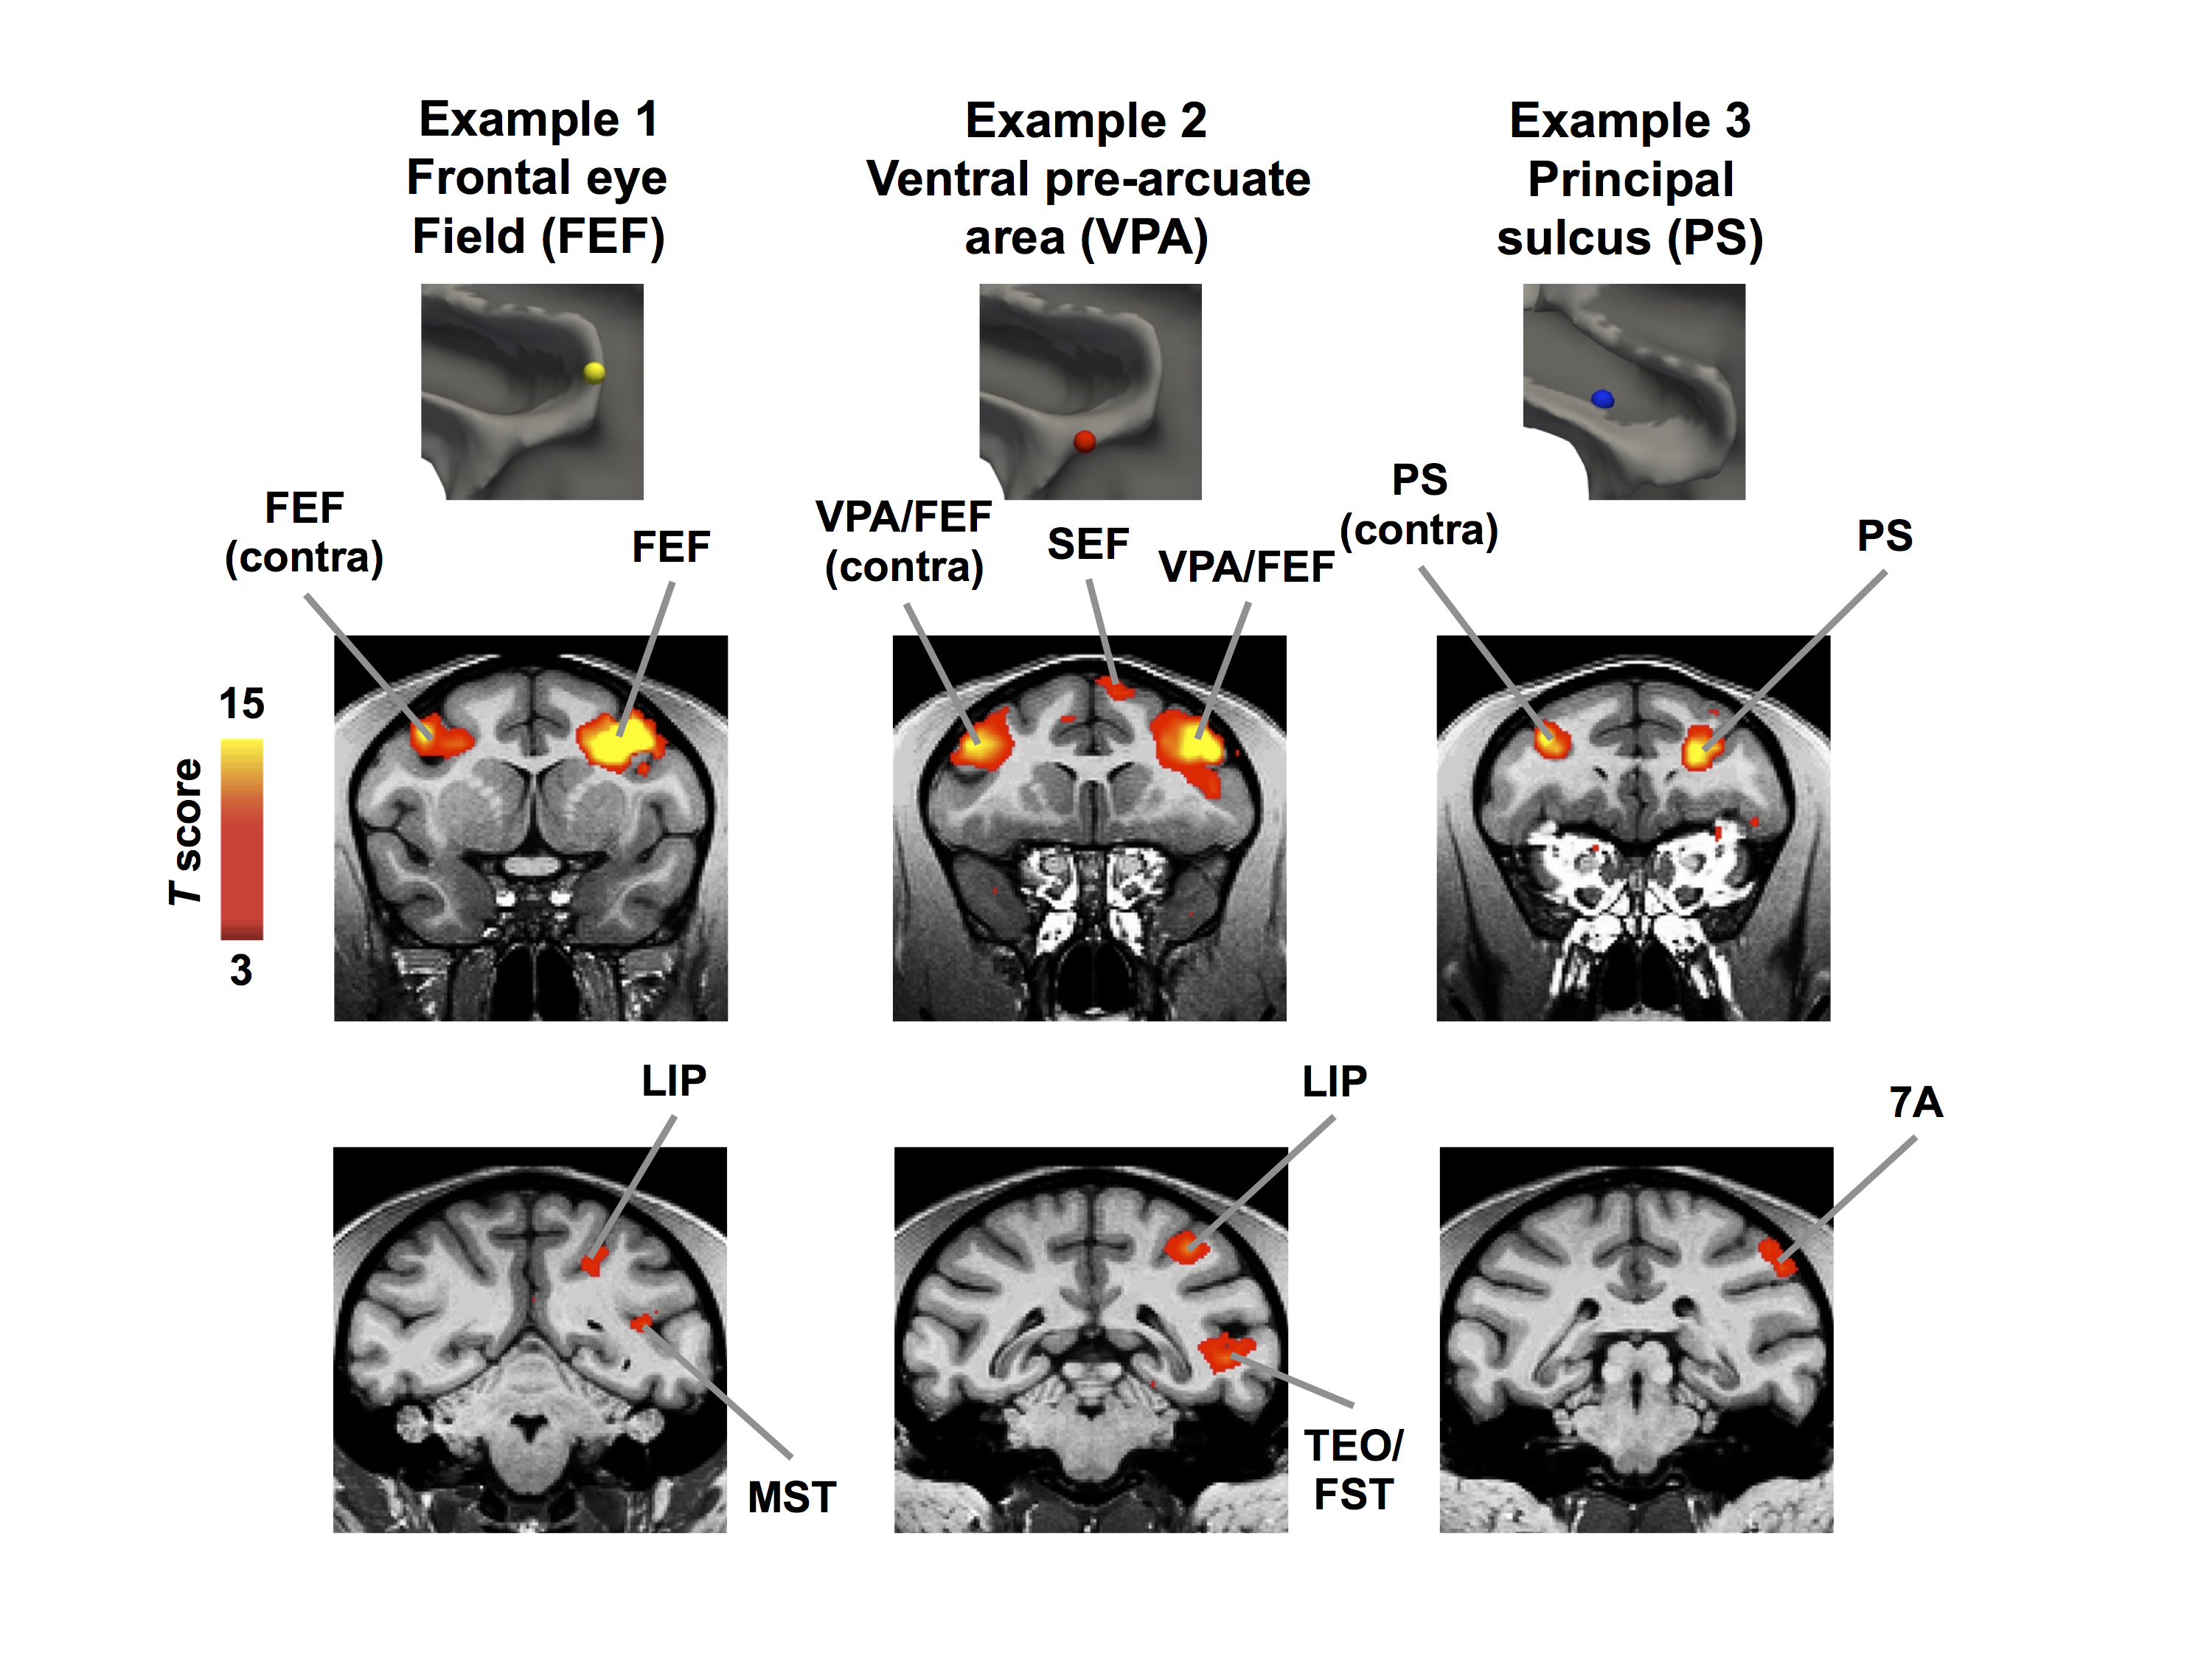
Fig. 3. shows typical patterns of activations from three example sites. The three columns represent stimulation of three electrodes (connected to separate ground electrodes) in the noted location (first row). The second row shows the MION activation (sign inverted) was consistently found in the areas adjacent to the stimulation site and also in their contralateral counterparts. There were no electrodes in the contralateral side, and thus the observed activations were results of inter-hemispherical connectivity. The bottom row of Fig. 3 shows the activations in ipsilateral areas outside LPFC, many centimeters away from the stimulation site. Note the electrodes placed only millimeters away from each other generated qualitatively different patterns of activations. There were rarely contralateral activations outside LFPC, which is consistent with previous studies showing that microstimulation tends to elicit activations mainly in areas monosynaptically connected to the stimulation site.Conclusion
There are many ways to study anatomical connectivity in the brain, including tracer methods, diffusion weighted imaging, etc. However, electrical microstimulation can generate robust fMRI activations in 20-30 minutes per electrode, which enables the ability to systematically map the connections in vivo for a large number of sites in the same animal within an experimentally reasonable time.Acknowledgements
We would like to acknowledge the invaluable assistance of Monica Siddalls, Steven P Shannon and Michael L Williams with the experimental work. Funding for the research was provided by a grant from the NIH.References
1. G. H. Mulliken, N. P. Bichot, A. Ghadooshahy, J. Sharma, S. Kornblith, M. Philcock, R. Desimone, Custom-fit radiolucent cranial implants for neurophysiological recording and stimulation. J. Neurosci. Methods. 241, 146–154 (2015).
2. N. P. Bichot, M. T. Heard, E. M. DeGennaro, R. Desimone, A Source for Feature-Based Attention in the Prefrontal Cortex. Neuron. 88, 832–844 (2015).
Figures