1158
Decipher the hippocampal neurovascular coupling with simultaneous fMRI and GCaMP-mediated calcium recording1High-Field Magnetic Resonance, Max Planck Institute for Bioilogical Cybernetics, Tuebingen, Germany, 2Neurology, Renmin Hospital of Wuhan University, Wuhan, People's Republic of China
Synopsis
Decipher the hippocampal neurovascular coupling with simultaneous fMRI and GCaMP-mediated calcium recording
Previously, we have developed a single-vessel fMRI method to visualize the hemodynamic signal propagation from individual venules and arterioles in the deep layer cortex and hippocampus. Here, we combined the single-vessel SSFP-fMRI with the GCaMP-mediated calcium recording to decipher the hippocampal neurovascular coupling events. Optogenetic stimulation led to epileptic activity, which could be detected as the bursting calcium spikes coupled to elongated fMRI signal from individual hippocampal arterioles and venules up to 20-30s following the epileptic events. This work establishes a multi-modal fMRI platform to characterize the hippocampal vascular dynamics of both normal and optogenetically driven seizure-like states.Purpose:
We have previously detected the BOLD fMRI signal from individual vessels penetrating the deep cortical layers in the anesthetized rats1. This single-vessel fMRI method can also be used to map the hemodynamic signal from individual hippocampal vessels2. The unbalanced neuronal network activity in the hippocampus has been reported to induce epileptic seizure 3. However, there are few studies to map the hippocampal neurovascular coupling in the epileptic state4, 5. The simultaneous single-vessel fMRI with GCaMP6-mediated calcium recordings provides a good platform to decipher the neuronal and vascular interaction in both normal and seizure-like state in the hippocampus. Here, we use the optogenetics technique to perturb the normal hippocampal network so as to induce the epileptic events as previously reported in the anesthetized rats4,5.The optogeneticallyevoked calcium and single-vessel fMRI signal was acquired to specify the hippocampal vascular hemodynamics at both normal and the seizure-like states.Methods:
fMRI were performed in alpha-chloralose anesthetized rats. The detailed surgical procedures were described previously9. Briefly, all images were acquired with a 14.1T/26cm horizontal bore magnet (Magnex), interfaced to an AVANCE III console (Bruker) and equipped with a 12 cm gradient set, capable of providing 100 G/cm with a rise time of 150 us (Resonance Research). A transreceiver surface coil with 7.5 mm diameter was used to acquire fMRI images. For fMRI, a 3D EPI sequence with a 64x64x16 matrix was run with the following parameters: TE 14ms; TR 1.5s; FOV 1.92x1.92x0.8cm3; spatial resolution 300x300x500μm3. To detect the individual arterioles and venules, a 2D-MGE sequence was used with the following parameters: TR 100ms; TE 2.5, 5.5, 11.5, 14.5, 17.5, 17.5, 20.5, 23.5ms; flip angle 58°; matrix 256x192; in-plane 67x67μm; 500 um thickness images. The steady state free precession (SSFP) imaging method was applied to map the fMRI signal with the following parameters: TE 5.85ms (BOLD), TR 11.7ms, matrix: 128x128 (BOLD), flip angle 22°; TE 5.2ms (CBV), TR 10.4ms, matrix 96x96(CBV), flip angle 17°, slice thickness 500μm. CBV-weighted signals were obtained after intravenous administration of 15 mg Fe/kg dextran coated iron oxide (Biopal, MA). The ChR2 and Gcamp6f were expressed by AAV5 viral vectors into the hippocampal CA1 region with CaMKII and Syn promoters. Fiber optic (200μm) was inserted into the hippocampus for optical stimulation, the light pulse was delivered through the 473nm laser (10ms, 10Hz, 8s, 5.3 mW). AFNI software was used for image analysis.Results:
Fig. 1A shows the individual penetrating vessels in the hippocampus from the arteriole-venule (A-V) map. The fiber optic was inserted into the hippocampus, where the ChR2 was expressed to trigger the single-vessel hemodynamic signal from the hippocampus, showing by the BOLD fMRI signal located primarily at the penetrating venules with on/off block design paradigm (Fig. 1A). To confirm the optogenetically-driven neural activity in hippocampus, the evoked local field potential was recorded with in vivo electrophysiology (Fig. 1B). GCaMP6f was co-expressed with ChR2 in the hippocampus (Fig. 1C). Two fiber optics were inserted to target hippocampus for both optical stimulation and calcium recording. In the calcium recording channel, the optical stimulation light pulse was detected as sharp spikes during pulse delivery period in both rats with or without GCaMP6 expression. In contrast, the delayed calcium signal peaked at 50-70ms following the light pulse was only detected in rats with GCaMP6 expressed in the hippocampus (Fig. 1C). Fig. 2 shows the averaged time course of BOLD signal from individual venlues and the averaged calcium signal driven by 10ms light pulse at different durations (Fig. 2A) and different frequencies of optical stimulation (Fig. 2B). The optical stimulation (10ms, 10Hz, 8s, 5.3mW ) led to spontaneous bursting spikes between the stimulation interval, which were similar to previously reported epileptic events5. Besides the venule-dominated BOLD signal and arteriole-dominated CBV signal during the normal condition, the epileptic events occurred at the interval of the first and second epochs led to temporally spread fMRI signal from both arterioles and venules up to 20-30 seconds.Conclusion:
We have established the multi-modal fMRI platform to simultaneously record optogenetically driven single-vessel fMRI and calcium signal in hippocampus. This platform allowed us to investigate the signaling events through the hippocampal neurovascular network to better understand vascular dynamic basis of hippocampal function at both normal and the seizure-like states.Acknowledgements
This research was supported by the internal funding from Max Planck Society and the Chinese Scholarship Council.References
1. Yu X, et al. Sensory and optogenetically driven single-vessel fMRI. Nature methods 13, 337-340 (2016).
2. Xuming Chen, et al. ISMRM (2016).
3. Sloviter RS. The neurobiology of temporal lobe epilepsy: too much information, not enough knowledge.C R Biol. 328,143-53 (2005).
4. Weitz AJ, et al. Optogenetic fMRI reveals distinct, frequency-dependent networks recruited by dorsal and intermediate hippocampus stimulations. NeuroImage 107, 229-241 (2015).
5. Osawa S,et al.Optogenetically induced seizure and the longitudinal hippocampal network dynamics. PLoS One 8:e60928 (2013).
Figures
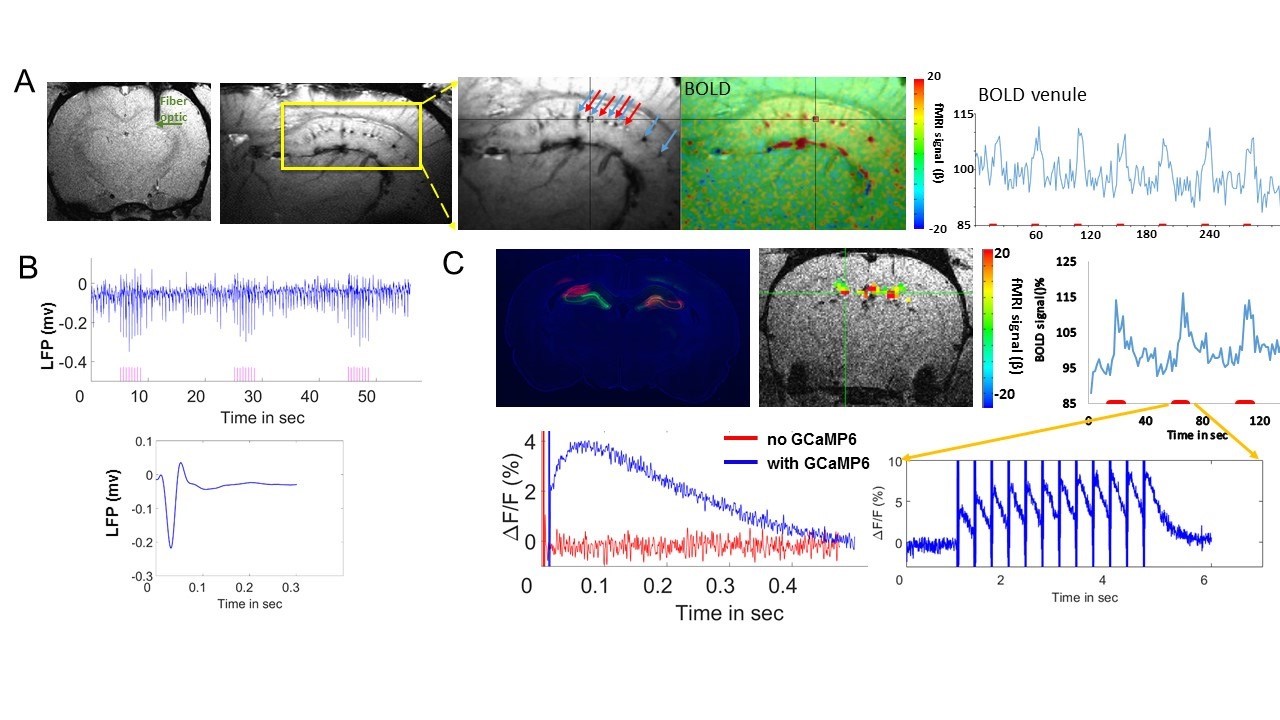
Fig 1. Optogenetically driven, simultaneous fMRI with GCaMP-mediated Calciumrecording in the hippocampus.
A. The anatomical MR image showed the fiber optic inser tion to target the hippocampus.The Arteriole-venule (A-V) map showed the arteriole (bright dots, red arrows) and venule(dark dots, blue arrows) voxels. The optogenetically driven fMRI colored functional map(SSFP-fMRI) showed the peak BOLD signal overlaying on the penetrating venules inthe hippocampus with the on/off block design time courses.B. The optogenetically driven LFP in the hippocampus. The lower panel is the average LFP.C. The co-expression of ChR2-mCherry(red) with GCaMP6f (green) in the hippocampus.The optogenetically driven fMRI signal in the hippocampus by EPI-fMRI with on/off blockdesign time course. The evoked calcium signal was shown during the optical stimulationon period (3Hz, 10ms, 4s). The lower panel is the averaged calcium signal trace with(Blue) or without (red) GCaMP6f expression.
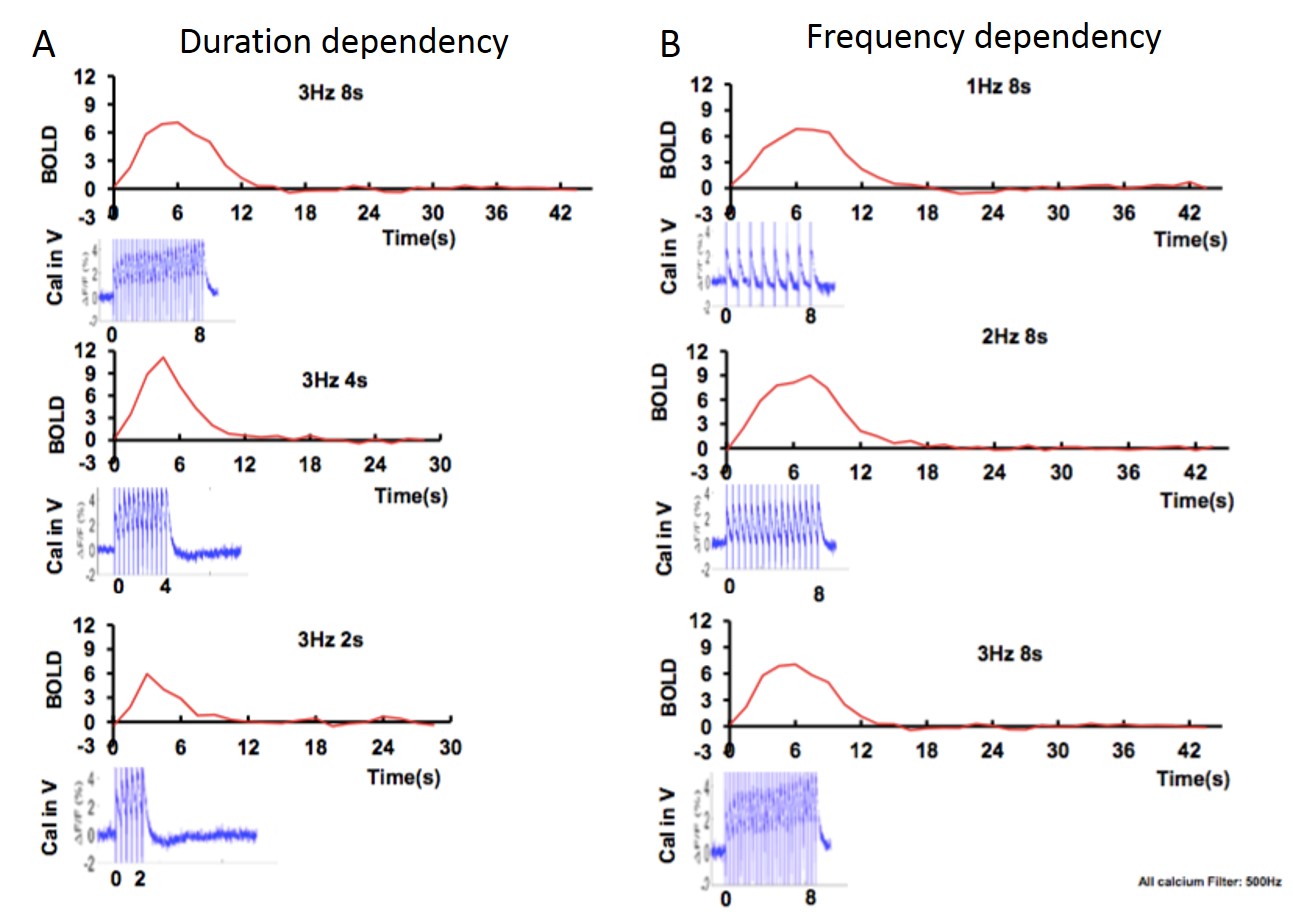
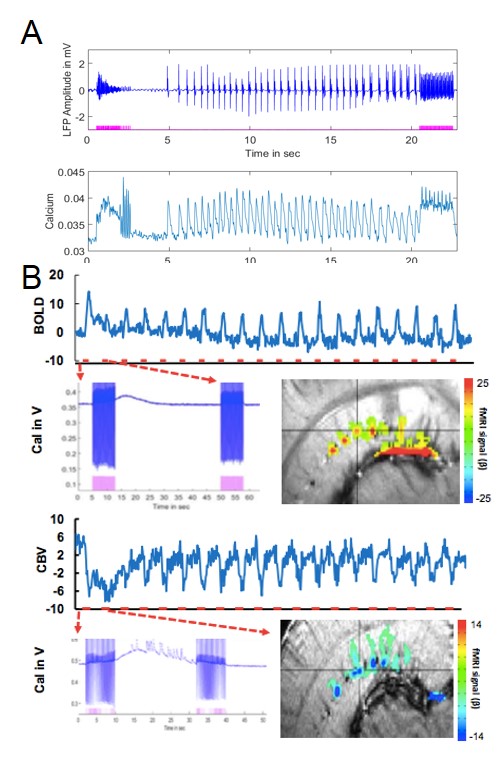
Fig 3. Optogenetically driven, simultaneous fMRI with GCaMP-mediated Calcium recording in the hippocampus at the optogenetically induced Seizure-like state.
A.The light-driven LFP and Calcium recording by the optogenetics (1 ms, 10Hz, 5.3 mW)
B.The optogenetically driven fMRI colored
functional map(SSFP-fMRI) showed the peak BOLD/CBV signal overlaying on the
penetrating venules/arterioles in the hippocampus with the on/off block design time
courses. The lower pannel show the corresponding evoked calcium signal from the first epoch.