1154
GABA promotes beta-Amyloid related changes in dynamic network expression of elderly subjects at risk for Alzheimer's disease1Institute of Regenerative Medicine, University of Zurich, Zurich, Switzerland, 2Institute for Regenerative Medicine, University of Zurich, Switzerland, 3Hospital for Psychogeriatric Medicine, University of Zurich, Switzerland, 4Institute of Bioengineering, École polytechnique fédérale de Lausanne, Switzerland, 5Institute for Biomedical Engineering, ETH Zurich, Switzerland, 6Division of Nuclear Medicine, University of Zurich, Switzerland, 7Max Planck Institute for Biological Cybernetics, Tubingen, Germany, 8Hospital for Psychogeriatric Medicine, University of Zurich, Zurich, Switzerland
Synopsis
This study observes dynamic functional connectivity changes in an elderly AD-risk population mediated by both regional Aß-deposits and GABA levels, using PiB-PET and MRSI. The sample is grouped into subjects with high regional Aß and high GABA, and changes in dynamic network expression are compared between groups. Our preliminary findings show dynamic network changes specific to high Aß-deposits in the neocortex and the frontal and temporal lobe. This indicates region-specific network changes that may in part explain the weak correlation between global Aß and AD progression.
Introduction
While beta-amyloid (Aß) accumulation is a hallmark of Alzheimer’s disease (AD), Aß-burden only weakly correlates to its duration or severity1,2. It can therefore be assumed that amyloidosis interacts with other neurodegenerative risk factors resulting in AD conversion3.
GABA is the most abundant occurring inhibitory neurotransmitter in the brain and recent evidence has implicated GABA in levels of deactivation of the default mode network (DMN)4, a network that is also affected by AD5.
Therefore this study aims to examine the effects between Aß and GABA on functional connectivity (FC) of resting-state networks taking into account the dynamic nature of FC by using recently developed analysis tools6.
Methods
This study includes 29 subjects (Males=17/Mean age=69.75 (5.57)). Aß-load for each subject was determined using 11C-Pittsburgh Compound B (PiB)-PET. Due to missing data, the final dynamic FC (dFC) analysis was conducted on 22 subjects (see Figure 1).
MR images were acquired using a Philips Achieva 7T scanner. These included a high-resolution T1-weighted 3D-MPRAGE structural image (TE =3.74 ms; TR =8.22ms; resolution=0.8x0.8x0.9mm) and a 3D-FLAIR sequence (TE =310.74ms; TR =8000ms; resolution =0.43x0.43x2mm) for localisation of volumes of interest (VOIs) for magnetic resonance spectroscopy imaging (MRSI).MRSI was obtained with a high-resolution direct free induction decay (FID) sequence (acquisition delay =2.5ms; TR=644ms; in-plane resolution=3.5x3.5mm2; slice thickness=12mm)7. For exact anatomical reference, a T1-weighted structural TSE image (TE=2.9ms; TR=5.7ms; resolution=0.9x0.9x1.5mm) was obtained using the same FOV dimensions as the FID MRSI. MRSI grey matter GABA measures were obtained using the same pipeline as in a previous study8 (See Figure 2). Subjects were grouped according to high/low GABA levels, inferred from MRSI and according to high/low-amyloid, indicated by PiB-load. PiB-load was assessed regionally by calculating mean load per region, including the neocortex, frontal, parietal, temporal and occipital lobe, and the insula. High-low stratification for the aforementioned factors was done using median split.
Whole brain rsfMRI-data with echo planar imaging (EPI) (TR=2500ms; slice thickness =3mm; voxel size=1.7190) was used to investigate dFC, using a sliding-time window approach (34 time points; 60s) to calculate time-varying correlations between BOLD fluctuations in all pairs of brain regions obtained by parcellation with AAL atlas. The resulting [connectivity x time] matrix was demeaned, normalised and concatenated per subject to create a [connectivity x time/subject] matrix. PCA was applied to extract patterns of coherent fluctuations that span a linear space optimised for explained variance and reveal repetitively occurring networks and their interactions6. These can also be seen as recurring network patterns in the dFC. Time-weighted contributions of these networks were calculated and compared between groups.
Results
Regional PiB-load was determined for the neocortex, frontal, parietal, temporal lobe and the insula. The dFC network expression of subjects with both a high GABA in PCC GM and high amyloid content for each region were compared using Hotelling’s T2 test. A significant difference in network expression was found for those who had high-Aß in the neocortical (F(9,12)=4.70, p<0.009), frontal (F(9,12)=3.56, p<0.024) and temporal (F(9,12)=3.72, p<0.021) regions paired with high-GABA.
Factor loadings pinpoint to an increased expression in a fronto-temporal, parieto-occipital, and temporal network for high GABA and neocortical Aß-load. Those with high frontal-Aß and GABA had decreased expression of the parieto-occipital, but an increased expression of a fronto-parietal-cortical network. Increased temporal-Aß and GABA displayed decreased expression in the parieto-occipital and temporal network and higher expression of the fronto-parietal-cortical network (See Figure 3&4).
Discussion
Our preliminary findings show an interactive effect of GABA and Aß-load, specific to the neocortex, frontal and temporal regions. Increased amyloid in these areas combined with high GABA show changes in network expression with an increase of the parieto-occipital and temporal network with high neocortical-Aß whereas increased Aß in the frontal and temporal areas show decreased expression in the same temporal network but higher expression of the fronto-parietal-cortical network. Additionally those with high temporal Aß display a decrease in the same parieto-occipital network that is increased in the high neocortical-Aß group.
These findings are particularly interesting as the specific mechanism of Aß in the process of progressive neuronal dysfunction in AD is unclear – with some individuals showing no cognitive deficits despite high cortical-Aß, whereas some with less Aß showing strong cognitive deficits suggesting AD-associated changes. Our data thus suggest that AD-related changes in FC may be advanced by regional pathology, reflected by Aß-load and GABA.
Acknowledgements
No acknowledgement found.References
(1) Serrano-Pozo, Alberto, et al. "Neuropathological alterations in Alzheimer disease." Cold Spring Harbor perspectives in medicine 1.1 (2011): a006189.
(2) Villemagne, Victor L., et al. "Longitudinal assessment of Aβ and cognition in aging and Alzheimer disease." Annals of neurology 69.1 (2011): 181-192.
(3) Mormino, Elizabeth C., et al. "Synergistic effect of β-amyloid and neurodegeneration on cognitive decline in clinically normal individuals." JAMA neurology 71.11 (2014): 1379-1385.
(4) Hu, Yuzheng, et al. "Resting-state glutamate and GABA concentrations predict task-induced deactivation in the default mode network." The Journal of Neuroscience 33.47 (2013): 18566-18573.
(5) Greicius, Michael D., et al. "Default-mode network activity distinguishes Alzheimer's disease from healthy aging: evidence from functional MRI." Proceedings of the National Academy of Sciences of the United States of America 101.13 (2004): 4637-4642.
(6) Leonardi, Nora, et al. "Principal components of functional connectivity: a new approach to study dynamic brain connectivity during rest." NeuroImage 83 (2013): 937-950.
(7) Henning, Anke, et al. "Slice-selective FID acquisition, localized by outer volume suppression (FIDLOVS) for 1H-MRSI of the human brain at 7 T with minimal signal loss." NMR in Biomedicine 22.7 (2009): 683-696.
(8) Schreiner, Simon J., et al. "Low episodic memory performance in cognitively normal elderly subjects is associated with increased posterior cingulate gray matter N-acetylaspartate: A 1 H MRSI Study at 7 Tesla." Neurobiology of Aging (2016).
Figures
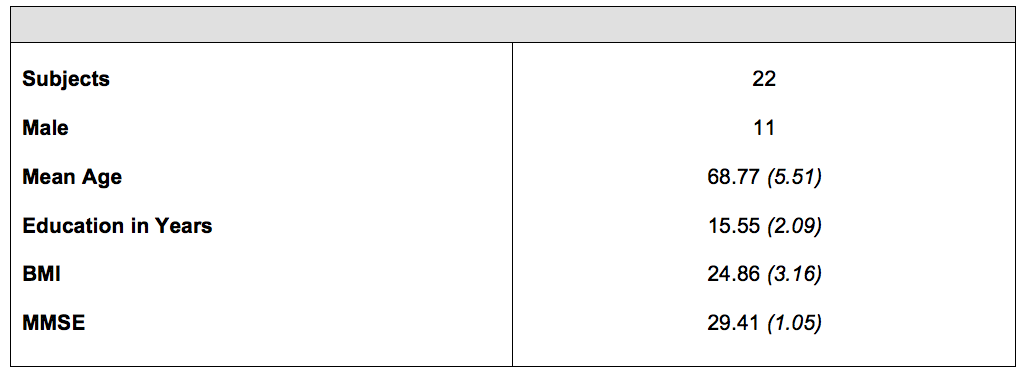
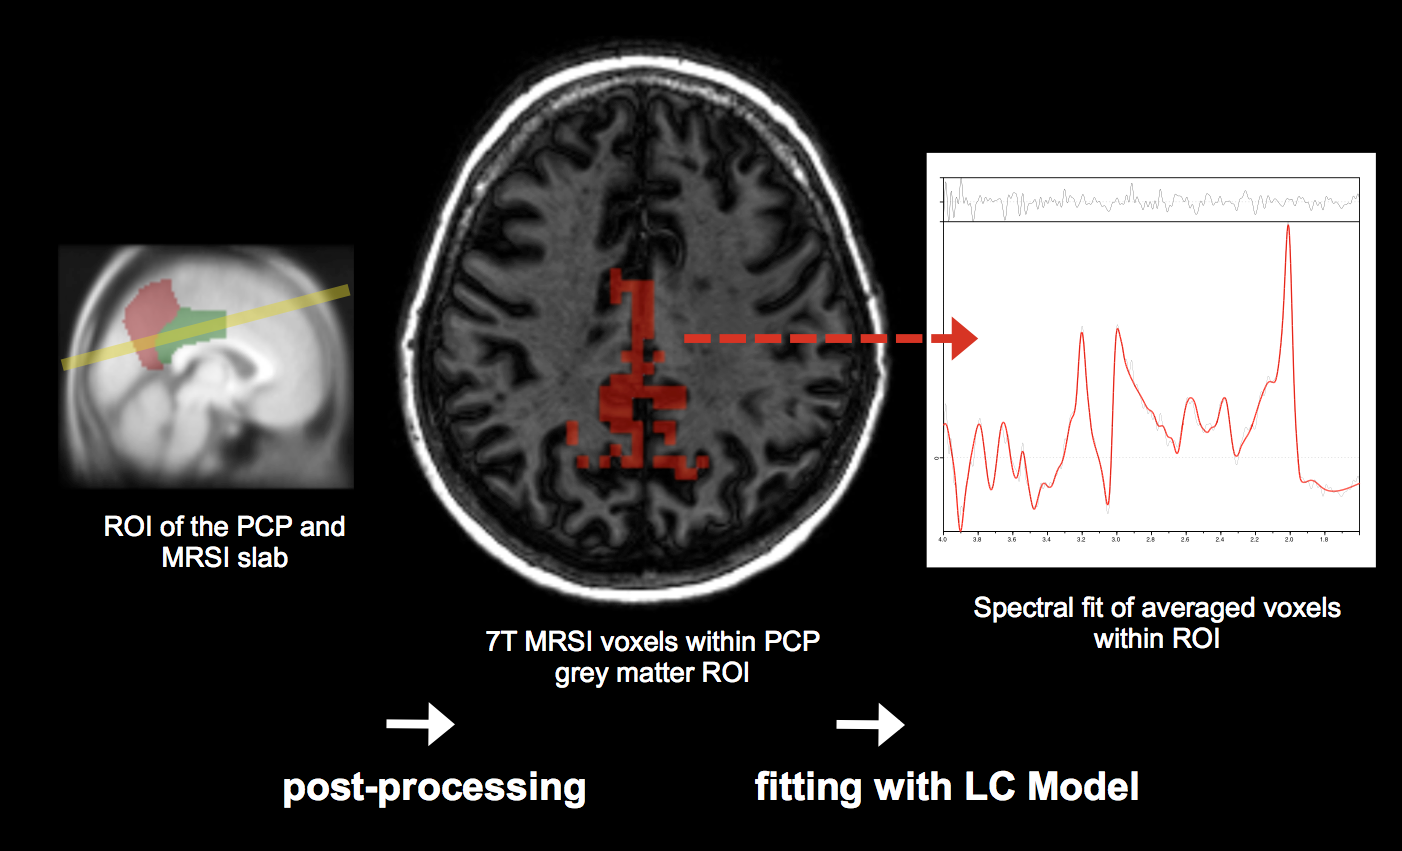
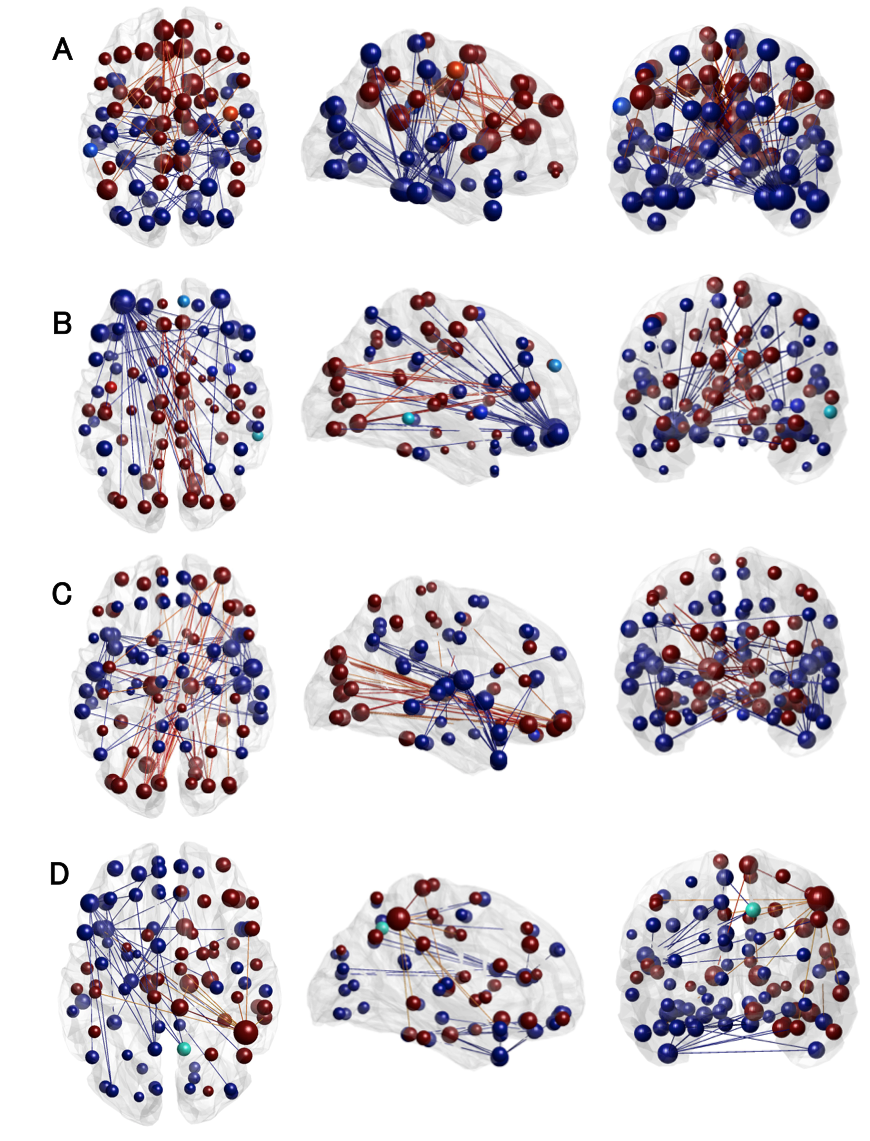
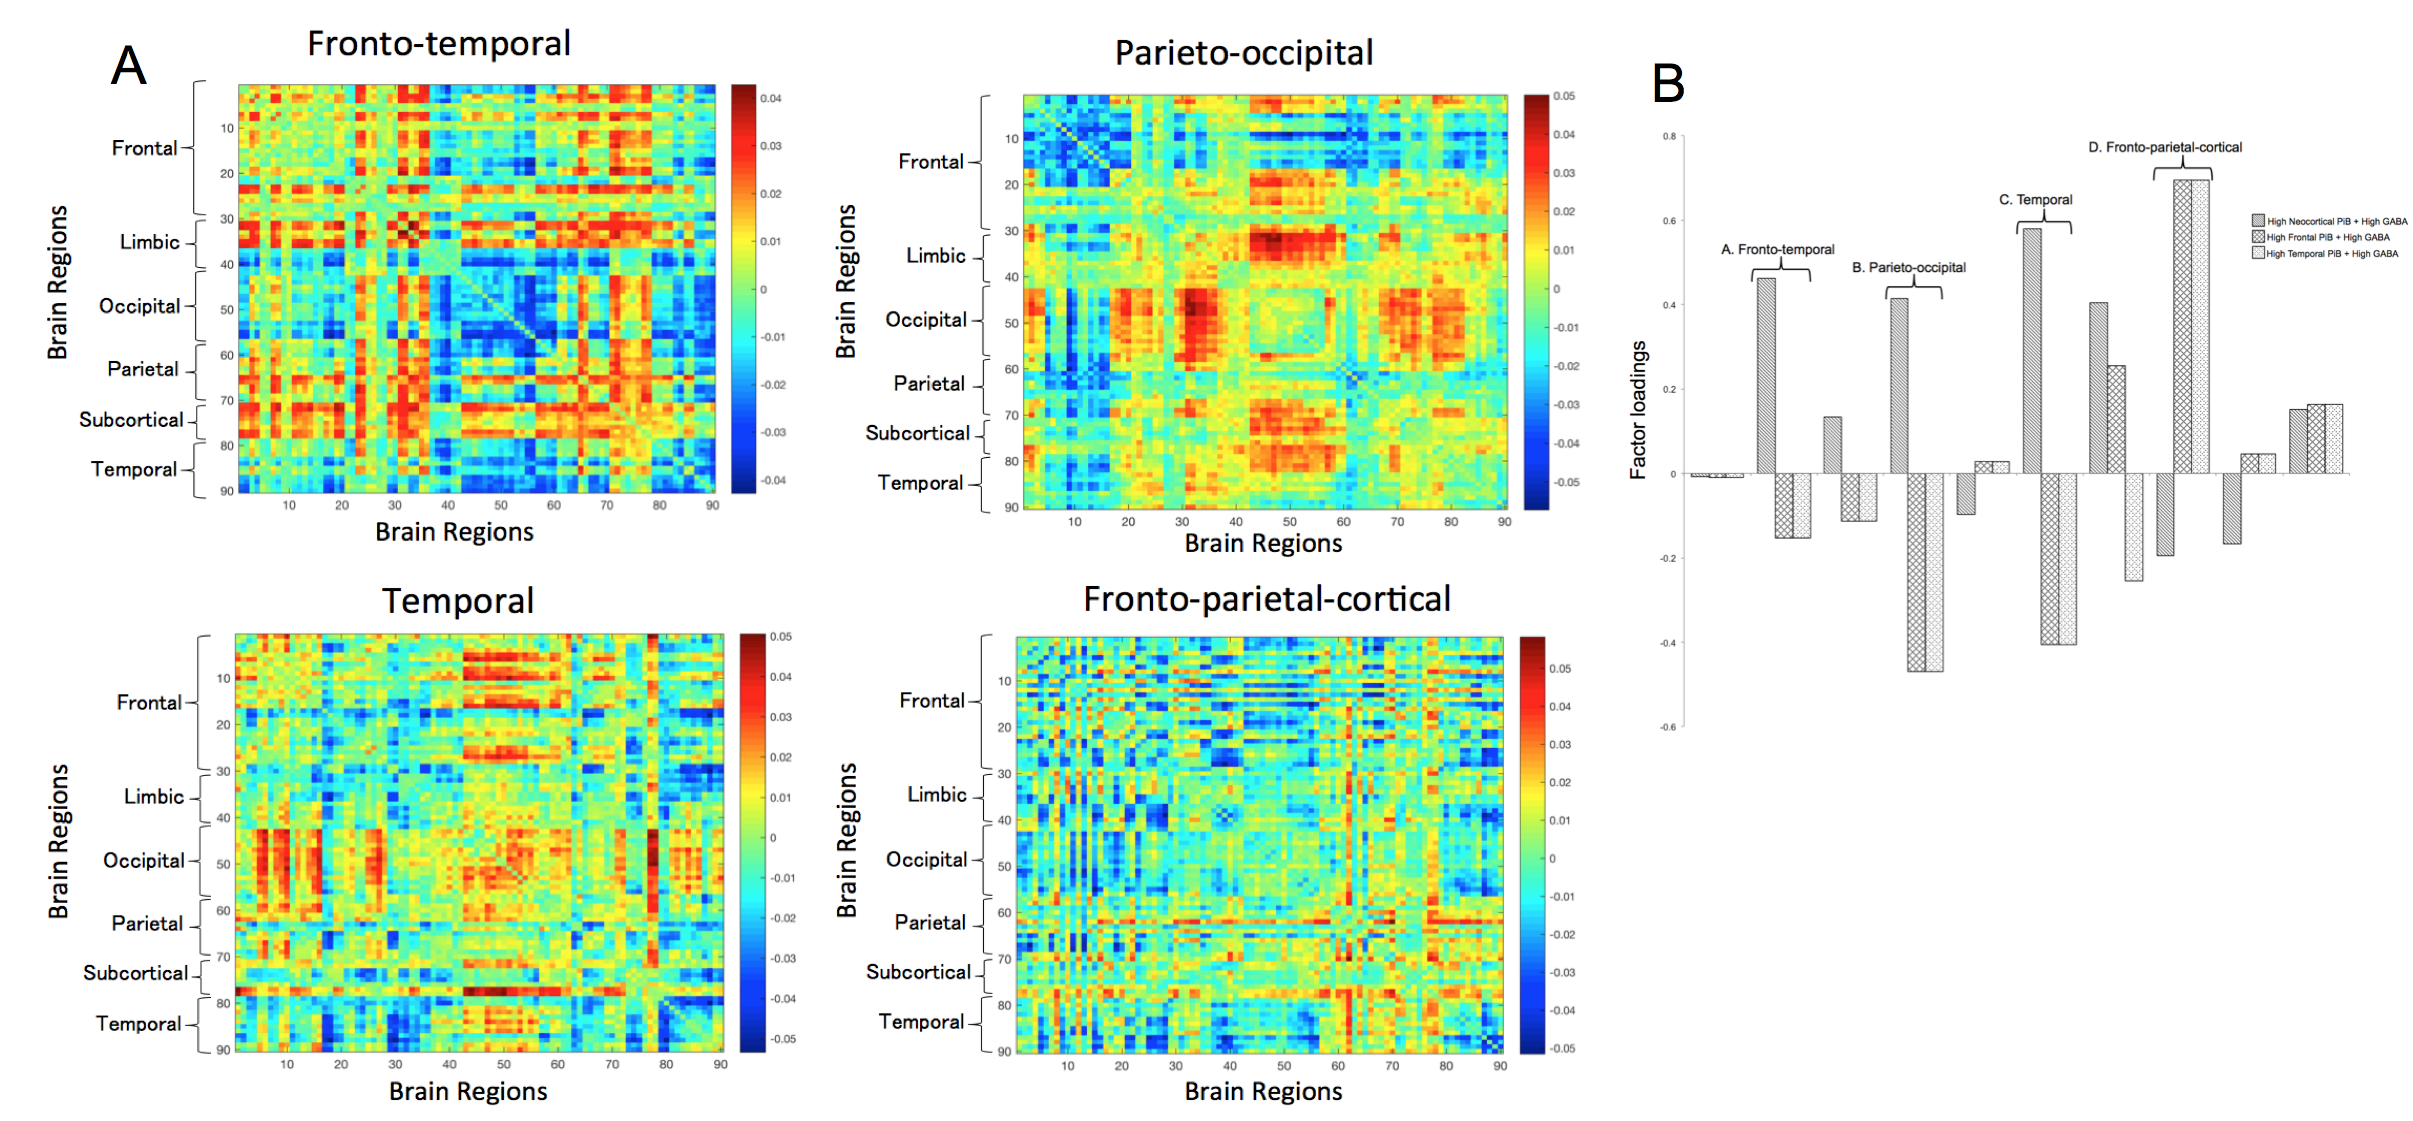
Figure 4A. Eigenconnectivity maps of the networks that show a changed prevalence in the dynamic FC in subjects with high regional amyloid and high levels of GABA. The x and y axes indicate a region on the AAL atlas. The colour scheme represents the algebraic sign of relative connection strength (red for positive, blue for negative).
Figure 4B. Bar plot indicating the differences in network expression for those with high regional PiB (neocortical, frontal and temporal) and high GABA versus the rest of the sample, as indicated by factor loadings.