1153
Combined fMRI-MRS measures simultaneous glutamate and BOLD-fMRI signals in the human brain at 7T1Department of Physiology, Anatomy & Genetics, University of Oxford, Oxford, United Kingdom, 2Oxford Centre for Functional MRI of the Brain (FMRIB), University of Oxford, Oxford, United Kingdom, 3Centre for Clinical Magnetic Resonance Research (OCMR), University of Oxford, Oxford, United Kingdom
Synopsis
We quantified neural activity using a novel method for simultaneous acquisition of blood-oxygenationlevel dependent (BOLD)-fMRI signals and proton magnetic resonance spectroscopy (1H -MRS)-MRI at 7 Tesla. We have demonstrated the correlation of glutamate, the principal excitatory neurotransmitter in the nervous system, with BOLD-fMRI responses during brief (64 s) periods of visual stimulation. These results establish the feasibility of concurrent measurements of BOLD-fMRI and neurochemicals at a temporal resolution compatible with human fMRI studies.
Introduction
The blood-oxygenation level dependent (BOLD)-fMRI response, one of the most widely used measures of functional activity, reflects a spectrum of energy and blood-flow dependent processes [1] that are not completely understood. 1H-MRS is a non-invasive measure of absolute concentrations of neurochemicals that has been exploited to identify biomarkers of normal and neurological conditions [2]. While several recent studies have measured functional 1H-MRS [3-7] during specific tasks, no study to date has quantified simultaneous changes in neurochemicals and brain activity using BOLD-fMRI. Thus, we developed and implemented a novel functional MR-sequence that simultaneously recorded BOLD-fMRI and 1H-MRS (combined fMRI-MRS).Methods
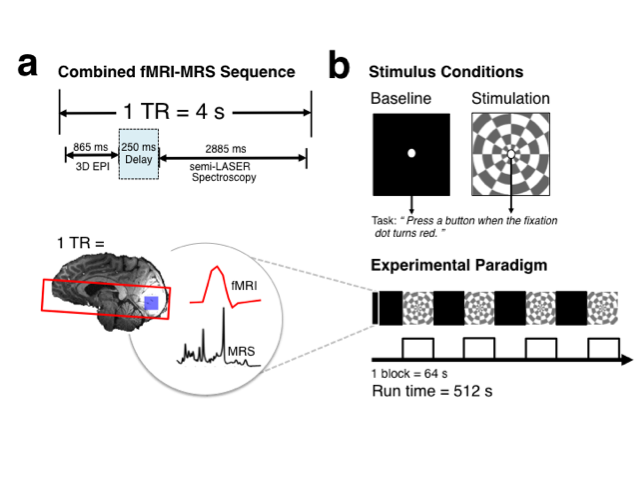
Eighteen volunteers (9 females, mean age 28.71 ± 5.62 years) were scanned under IRB ethical approval at 7T using a whole body MR system (Siemens, Erlangen) with a Nova Medical 32-channel receive array head-coil. Five participants were excluded from analysis due to motion artifacts. A dielectric pad containing a suspension of Barium Titanate (BaTiO3) was placed behind the occiput of each subject to improve the transmit-field efficiency [8]. A 2 x 2 x 2 cm MRS VOI was positioned in the occipital lobe, centered along the midline and the calcarine sulcus. fMRI volumes and MRS spectra were acquired in the same TR of 4s over a 512 s scan (3D EPI, resolution= 4.3 x 4.3 x 4.3 mm; flip angle = 5°, repetition time TRepi= 83 ms, TE= 25 ms, FOV= 240 mm , 32 slices) (Fig. 1a). Functional MRS data were acquired using the semi-LASER pulse sequence (TE = 36 ms, TRmrs = 4 s) [9]. For each participant, a visual stimulation experiment consisting of a baseline-stimulation block design (block length = 64 s, number of cycles = 4 ) (Fig. 1b) and a resting state experiment (‘eyes shut’, no visual stimulation) were collected. Metabolites were quantified using LCModel [10], with concentrations tissue corrected for the proportion of CSF. To correct for BOLD-artifacts, summed unsuppressed water spectra from baseline or stimulation periods were used as condition specific water reference during LCModel metabolite quantification. To correct for BOLD-induced line narrowing in metabolite spectra, line broadening was applied by exponential multiplication of stimulation metabolite spectra.Results
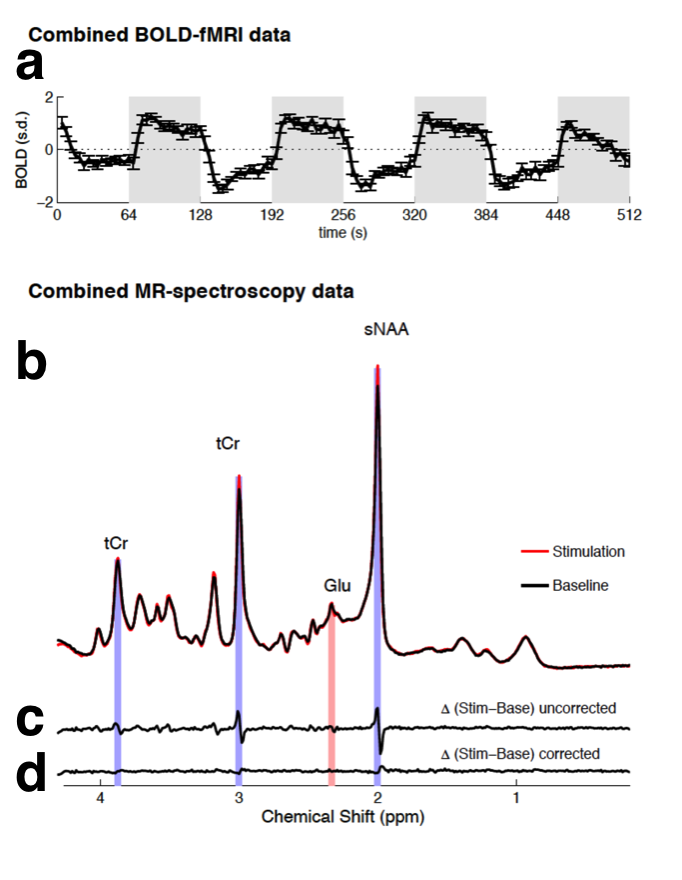
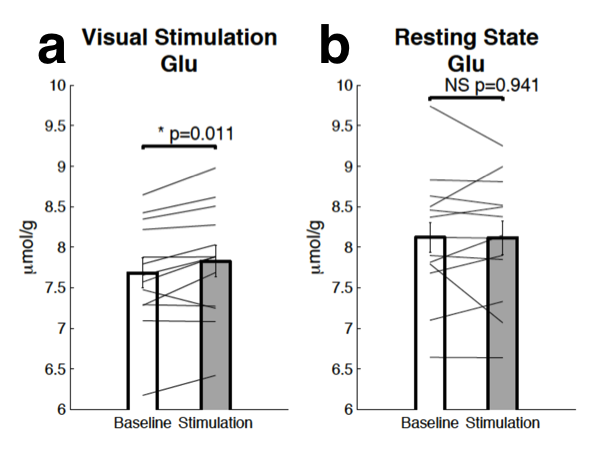
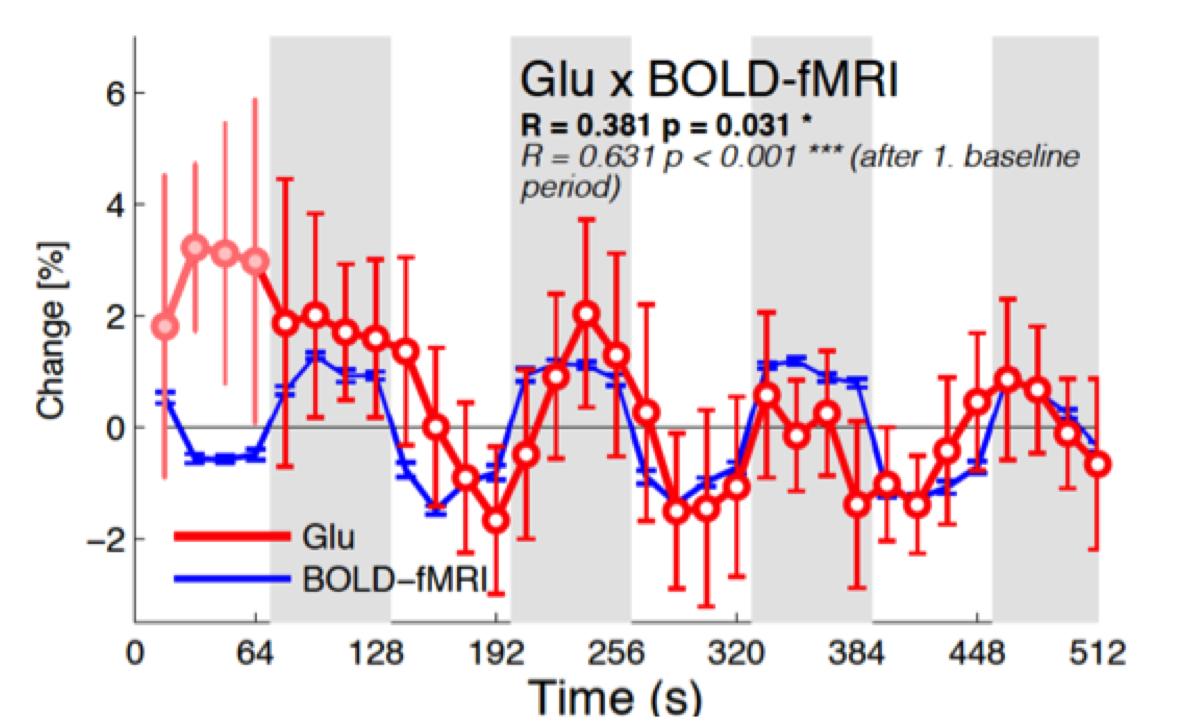
The combined fMRI-MRS sequence acquired robust BOLD-fMRI responses (Fig. 2a) and MRS spectra (Fig. 2b). Stimulation spectra were line-broadened to match the line width of baseline spectra in order to minimize the BOLD-induced line narrowing. The BOLD-induced line-narrowing was most visible at the tCr (3.03 ppm) and sNAA (2.01 ppm) singlet positions (Fig. 2c, ‘uncorrected’). Line broadening visibly flattened these difference peaks (Fig. 2d, ‘corrected’). Glutamate and Glutamate+glutamine were the only the metabolites that showed task-induced changes which were robust to BOLD-correction. The absolute glutamate concentration increased by 0.15 ± 0.05 μmol/g (Fig. 3a, paired t-test: t(12) = -2.98, p = 0.011) during stimulation, equivalent to an increase of 1.92 ± 0.66% from the baseline concentration. No increases in resting state glutamate were observed at this temporal frequency (paired t-test: t(12) = 0.27, p = 0.79, see Fig. 3b). Time series analysis between glutamate and the BOLD-fMRI responses resulted in significant correlation (r(31) = 0.381, p = 0.031, Fig. 4). Glutamate during the first baseline period (Fig. 4, filled circles) may reflect a familiarization period, and correlation increased if this period was excluded (r(27) = 0.631, p < 0.001). We found no correlation in the resting state scan between glutamate and the BOLD-fMRI time course (r(31) = 0.065, p = 0.724; 61 r(27) = 0.11, p = 0.572).Conclusion
In summary, we tested the feasibility of a novel combined fMRI-MRS method by measuring responses to a flashing checkerboard in the human visual cortex and showed reliable changes in glutamate and BOLD-fMRI after only 64s of stimulation. Our combined fMRI-MRS method has the potential to address questions about cortical function in the living human brain that cannot be answered by separate application of either technique alone.Acknowledgements
The authors would like to acknowledge the following: the Welcome Trust.References
1. Logothetis, N.K., et al., Neurophysiological investigation of the basis of the fMRI signal. Nature, 2001. 412(6843): p. 150-7.
2. Oz, G., et al., Clinical proton MR spectroscopy in central nervous system disorders. Radiology, 2014. 270(3): p. 658-79.
3. Zhu, X.H. and W. Chen, Observed BOLD effects on cerebral metabolite resonances in human visual cortex during visual stimulation: a functional (1)H MRS study at 4 T. Magn Reson Med, 2001. 46(5): p. 841-7.
4. Mangia, S., et al., Sensitivity of single-voxel 1H-MRS in investigating the metabolism of the activated human visual cortex at 7 T. Magn Reson Imaging, 2006. 24(4): p. 343-8.
5. Mangia, S., et al., Dynamics of lactate concentration and blood oxygen level-dependent effect in the human visual cortex during repeated identical stimuli. J Neurosci Res, 2007. 85(15): p. 3340-6.
6. Apsvalka, D., et al., Event-related dynamics of glutamate and BOLD effects measured using functional magnetic resonance spectroscopy (fMRS) at 3T in a repetition suppression paradigm. Neuroimage, 2015. 118: p. 292-300.
7. Bednarik, P., et al., Neurochemical and BOLD responses during neuronal activation measured in the human visual cortex at 7 Tesla. J Cereb Blood Flow Metab, 2015. 35(4): p. 601-10.
8. Lemke, C., et al., Two-voxel spectroscopy with dynamic B0 shimming and flip angle adjustment at 7 T in the human motor cortex. NMR Biomed, 2015. 28(7): p. 852-60.
9. van de Bank, B.L., et al., Multi-center reproducibility of neurochemical profiles in the human brain at 7 T. NMR Biomed, 2015. 28(3): p. 306-16.
10. Provencher, S.W., Automatic quantitation of localized in vivo 1H spectra with LCModel. NMR Biomed, 2001. 14(4): p. 260-4.
Figures