1147
Biomechanical properties of bovine knee cartilage under compressive loading: A study at high field MRI (9.4T) using T1, T2 and T1rho relaxometry combined with DENSE-FID.1Biomedical MRI group, KU Leuven, Leuven, Belgium, 2Human Movement Biomechanics Research Group, KU Leuven, Leuven, 3Rensselaer Polytechnic Institute, 4Mechanical Engineering, University of Colorado Boulder, 5Human Movement Biomechanics Research Group, KU Leuven
Synopsis
The aim of this study was to correlate the cartilage displacement pattern during cartilage on cartilage contact through displacement encoding imaging during compressive loading with the T1, T2 and T1rho changes, indices of changes in collagen matrix, water and proteoglycan contents. We demonstrated that local mechanical changes in the cartilage during loading were correlated to global molecular changes assessed through T1, T2 and T1rho. The localized cartilage deformation and strain fields suggest a differential response to loading of the different regions of the cartilage which could help in further optimizing cell based therapy for osteoarthritis.
Purpose
In-vivo assessment of mechanical behavior of articular cartilage under compressive loading could enable insights into tissue mechanics in healthy and diseased conditions. Changes in mechanical environment can affect the cellular response and may result in macro/microscopic matrix damage as seen in osteoarthritis. Therefore non-invasive monitoring of cartilage deformation can potentially serve as a unique biomarker for tissue damage and disease progression. Recently, it has been shown that structure and composition of cartilage matrix (collagen matrix, water content and proteoglycans) could be estimated through quantitative MRI relaxometry1-9. Several studies have documented a decrease of T110, T211-17, and T1rho16-17 relaxation times under applied loading, however none of them have related these changes to the local cartilage deformation. The aim of this study is thus to correlate the cartilage displacement pattern through displacement encoding imaging (DENSE1) during applied loading with the T1, T2 and T1rho changes.Methods
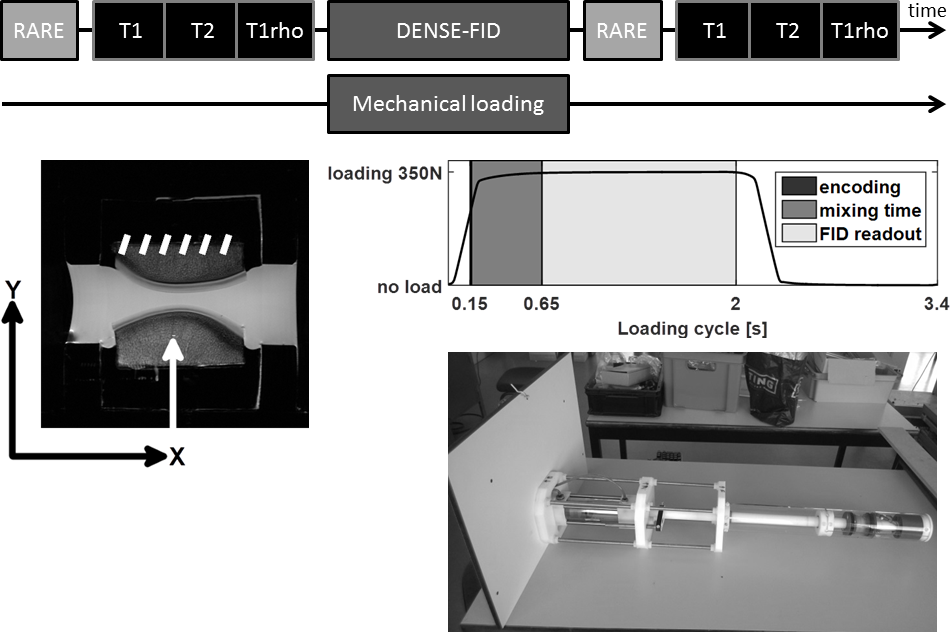
Five fresh knee joints (9 month old bovine) were used. Osteochondral explants with 30mm diameter were harvested from load-bearing area of medial and lateral femoral condyles and mounted on a custom-built MRI compatible loading device. All MRI data were acquired using a 9.4T MRI system (Bruker Biospec 94/20USR) with a quadrature transmit/receive coil (72mm internal diameter). Before each scan session, a 2D T2 weighted RARE reference was acquired (TEeff/TR:16.9/5692 ms, RARE factor:4, 9 contiguous slices of 3 mm thick). Quantitative relaxation time measurements, T1, T2 and T1rho were collected before and after the loading protocol (~1700 loading cycles) in the same imaging slice used for displacement-encoded imaging. T1 mapping was conducted using variable repetition time with RARE readout (RARE-VTR: TEeff:9.26ms, TR:220, 350, 500, 1000, 2000, 4000ms, RARE factor:2). T2 was assessed through multi-echo spin echo sequence (TE:8 echoes equally spaced by 11.5ms, TR:1000ms) and T1rho imaging parameters were: TEeff/TR:50.27/2000 ms, RARE factor:8, spin-lock frequency of 851 Hz, and spin-lock durations (TSL):[10, 20, 40, 60, 80, 100, 120, 140, 160, 180] ms. A 392x392 matrix and 60x60 mm2 FOV, with 3 mm slice thickness for all relaxation measurements was used. Before image acquisition during loading condition, the osteochondral plugs were cyclically loaded for ~500 cycles (350N load with cycle of 2.0 s constant loading and 1.4 s unloading) to reach quasi-steady state load-deformation behavior. To image the displacements under compressive loading, DENSE-SSFP-FID was employed (TE/TR:1.32/2.64ms, flip angle:27 degrees, FOV:60x60 mm, matrix:512x512, 1 slice of 3mm thickness, DENSE encoding with a 150ms delay and a mixing time of 500ms, 40 averages, 4 repetitions). Three consecutives scans were acquired with no displacement encoding in any direction (reference scan), 36 mT/m gradient encoding in X-direction and 48 mT/m in Y (Fig.1). Correlation between displacement and relaxometry changes were assessed through two-tailed Pearson’s linear correlation test (p<0.05).Results
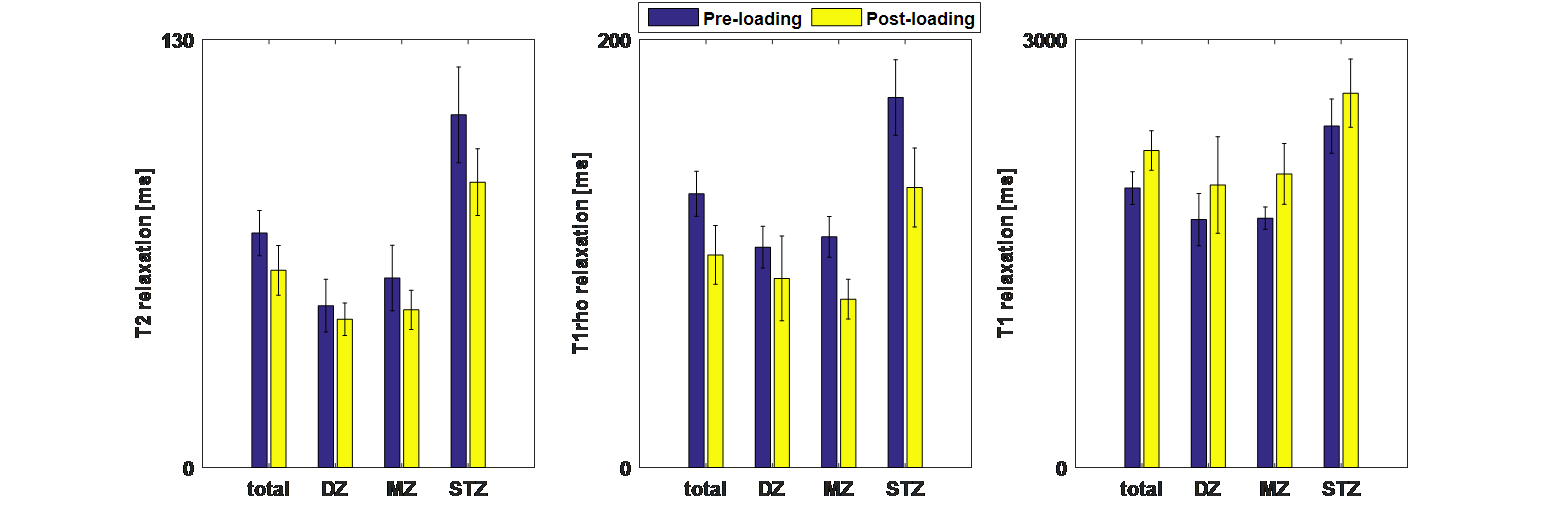
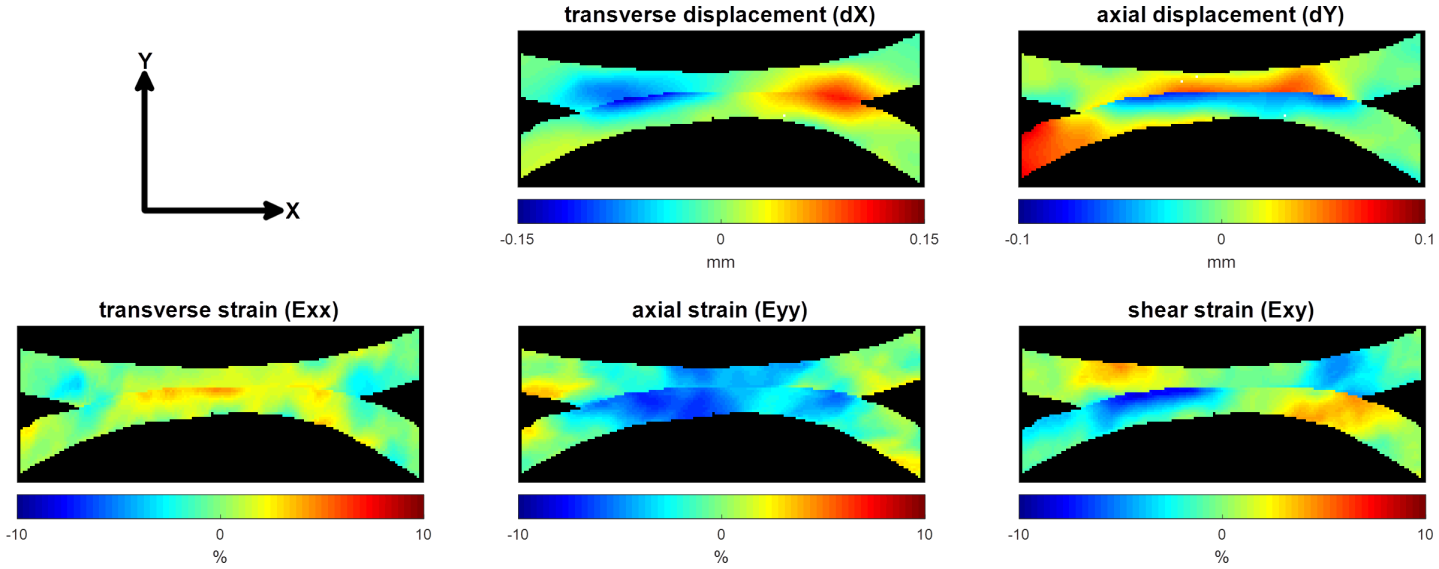
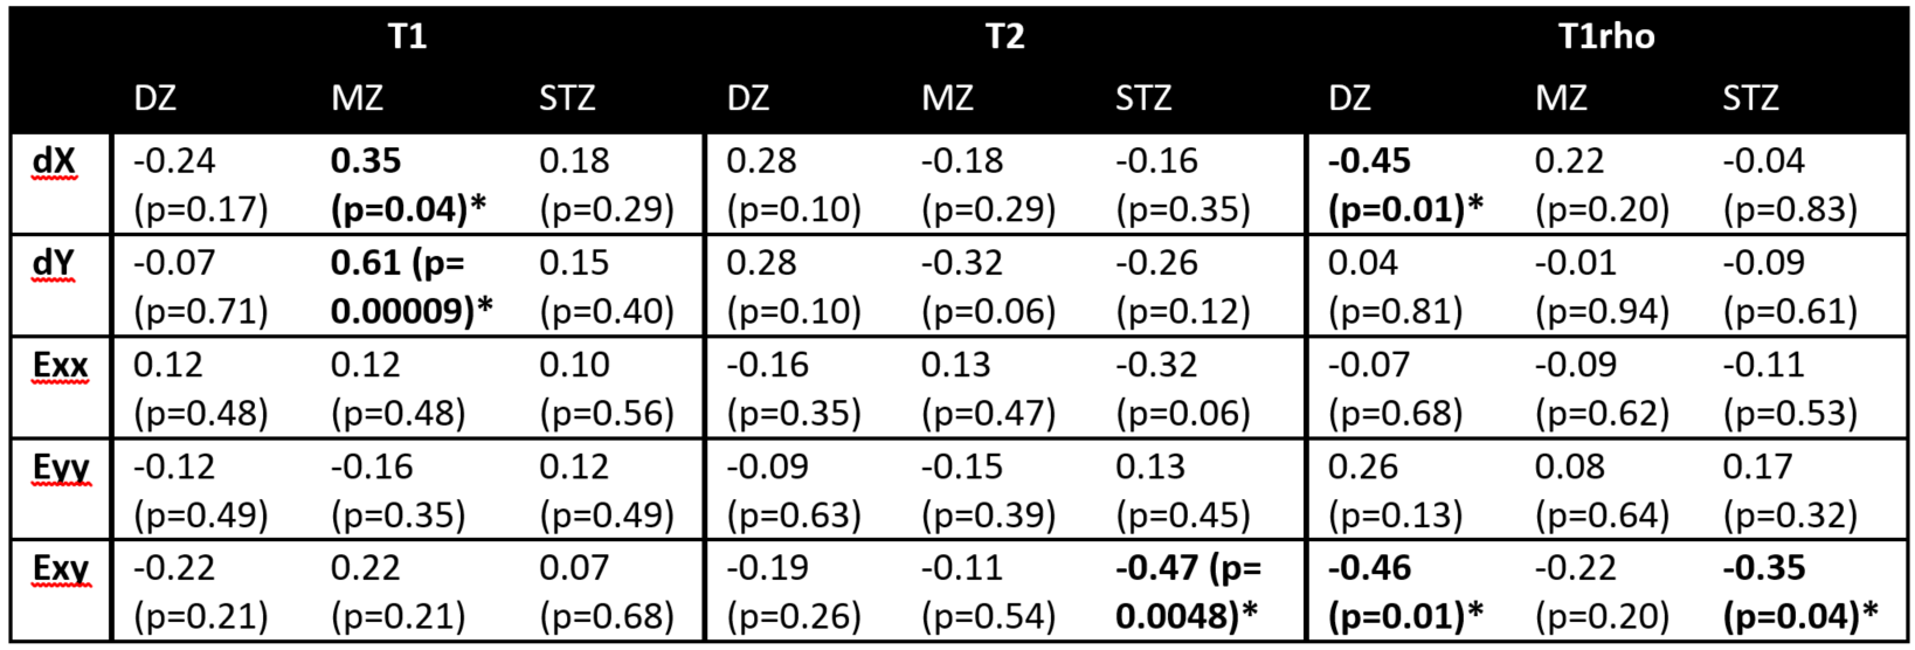
The loading significantly decreased T2 and T1rho of all cartilage regions and thicknesses (T2:71.2±6.9 ms. vs. 59.9±7.5 ms. for pre- and post-loading respectively, p <0.001; T1rho:127.9±10.5 ms. vs. 99.4±13.7 ms, p <0.001.) while T1 was significantly increased (1959.3±114.7 ms. vs. 2223.0±138.6 ms, p <0.001.) (Fig.2). Under compressive loading, both opposing cartilage surfaces deform similarly (Fig.3). Displacement in tangential direction (dX) was maximal (58.84 ± 26.80 μm) at the edge of the contact zone with opposite direction as opposed to compressive deformation (dY) for which the maximal displacement (61.45±17.50 μm) was spread over the entire contact zone and localized at the superficial layer of the cartilage. The computed strain fields (Exx, Eyy and Exy) showed a predominance of compressive strain (Eyy) throughout the entire cartilage thickness while tangential strains (Exx) were more localized at the superficial layer leading to a complex shear strain (Exy) distribution with opposite maxima at the edge of the contact zone and a gradient thoughout the cartilage thickness. The correlation analysis demonstrated that the T1rho changes of the deep zone were negatively correlated with dX (-0.45, p=0.01) and Exy (-0.46, p=0.01) while in the middle zone, the correlation was only found for dX and dY with changes in T1 (0.35, p=0.054 and 0.61, p= 0.0001 respectively). Finally in the superficial zone which is the most affected by the loading conditions, T2 and T1rho changes were correlated with Exy (-0.47, p= 0.005 and -0.35, p=0.04 respectively) (table 1).Discussion and conclusion
We demonstrated for the first time that local mechanical changes occurring in the cartilage during compressive loading of opposing articular surfaces were correlated to global molecular changes assessed through T1, T2 and T1rho. The localized cartilage deformation and field strains suggests a regional differential response to loading which could help in further optimizing cell based therapy for osteoarthritis.Acknowledgements
Research funded by a Ph.D. grant of the Agency for Innovation by Science and Technology (IWT) and a grant of the research council of KU Leuven.References
1. Chan, D.D., Neu, C.P. Probing articular cartilage damage and disease by quantitative magnetic resonance imaging. J. R. Soc. Interface 10, 20120608.
2. Nieminen, M.T., Rieppo, J., Töyräs, J., Hakumäki, et al. T2 relaxation reveals spatial collagen architecture in articular cartilage: A comparative quantitative MRI and polarized light microscopic study. Magn. Reson. Med. 2001 46, 487–493.
3. Xia, Y., Moody, J.B., Burton-Wurster, N., Lust, G. Quantitative in situ correlation between microscopic MRI and polarized light microscopy studies of articular cartilage. Osteoarthr. Cartil. 2001 9, 393–406.
4. Lüsse, S., Claassen, H., Gehrke, T., et al. Evaluation of water content by spatially resolved transverse relaxation times of human articular cartilage. Magn. Reson. Imaging 2000 18, 423–430.
5. Berberat, J.E., Nissi, M.J., Jurvelin, J.S., Nieminen, M.T. Assessment of interstitial water content of articular cartilage with T1 relaxation. Magn. Reson. Imaging 2009 27, 727–732.
6. Duvvuri, U., Reddy, R., Patel, S.D., et al. T1ρ-relaxation in articular cartilage: Effects of enzymatic degradation. Magn. Reson. Med. 1997 38, 863–867.
7. Keenan, K.E., Besier, T.F., Pauly, et al. Prediction of glycosaminoglycan content in human cartilage by age, T1ρ and T2 MRI. Osteoarthr. Cartil. 2011 19, 171–9.
8. Rautiainen, J., Nissi, M.J., Salo, E.-N., et al. Multiparametric MRI assessment of human articular cartilage degeneration: Correlation with quantitative histology and mechanical properties. Magn. Reson. Med. 2015 74:249-259.
9. Wheaton, A.J., Dodge, G.R., Elliott, et al.. Quantification of cartilage biomechanical and biochemical properties via T1rho magnetic resonance imaging. Magn. Reson. Med. 2005 54, 1087–1093.
10. Xia, Y., Wang, N., Lee, J., Badar, F. Strain-dependent T1 relaxation profiles in articular cartilage by MRI at microscopic resolutions. Magn. Reson. Med. 2011 65, 1733–1737.
11. Liess, C., Lusse, S., Karger, et al. Detection of changes in cartilage water content using MRI T2-mapping in vivo. Osteoarthr. Cartil. 2002 10, 907–913.
12. Nag, D., Liney, G.P., Gillespie, P., Sherman, K.P. Quantification of T2 Relaxation Changes in Articular Cartilage with In Situ Mechanical Loading of the Knee. J. Magn. Reson. Imaging 2004 19, 317–322.
13. Nishii, T., Kuroda, K., Matsuoka, Y., et al. Change in knee cartilage T2 in response to mechanical loading. J. Magn. Reson. Imaging 2008 28, 175–180.
14. Rubenstein, J.D., Kim, J.K., Henkelman, R.M.,. Effects of compression and recovery on bovine articular cartilage: appearance on MR images. Radiology 1996 201, 843–850.
15. Schoenbauer, E., Szomolanyi, P., Shiomi, et al. Cartilage evaluation with biochemical MR imaging using in vivo Knee compression at 3T-comparison of patients after cartilage repair with healthy volunteers. J. Biomech. 2015 48, 3349–3355.
16. Souza, R.B., Kumar, D., Calixto, N., et al. Response of knee cartilage T1rho and T2 relaxation times to in vivo mechanical loading in individuals with and without knee osteoarthritis. Osteoarthr. Cartil. 2014 22, 1367–76.
17. Souza, R.B., Stehling, C., Wyman, B.T., et al. The effects of acute loading on T1rho and T2 relaxation times of tibiofemoral articular cartilage. Osteoarthr. Cartil. 2010 18, 1557–1563.
Figures