1145
Cluster Analysis of Cartilage T2 and T1rho Relaxation Times: Can the Contralateral Knee be used as a Control in the ACL-injured population?1Electrical Engineering, Stanford University, Stanford, CA, United States, 2Radiology, Stanford University, Stanford, CA, United States, 3Mechanical Engineering, University of Saskatchewan, SK, Canada, 4Radiology and Biomedical Imaging, University of California San Francisco, CA, United States, 5Bioengineering, Stanford University, Stanford, CA, United States
Synopsis
In an ACL-injured population, longitudinal studies that use advanced MRI techniques such as T2 and T1rho mapping to assess cartilage health, typically compare ACL-injured knees with a separate healthy group or the contralateral knees. It is still unclear whether the contralateral knees can be used as a control group. Using a cluster analysis-based technique, we identify in the contralateral knees, significant increase in T1rho relaxation times over 1-year that is comparable to the increase in the ACL-injured knees. These focal cluster areas may represent degenerative changes and demonstrate that the contralateral knees may not be good controls.
Introduction
Osteoarthritis is a degenerative joint disease that develops in over 40% of patients with ACL ruptures 10-20 years after injury [1]. To correctly design longitudinal patient studies, it is important to have a control group; however, for quantitative MRI studies, it is currently unclear whether this should be a separate healthy group or the contralateral knee of the ACL-injured group. To date, both designs have been used in studies at a single time point and longitudinally [2,3,4,5]. In one study, significant changes in mean T2 and T1rho relaxation times were reported in both the ACL-injured and contralateral knees over 1-year [2]. Reporting mean changes are important; however, assessing what drives these global changes by quantifying focal cartilage defects can provide additional information about degenerative disease progression. Our group created a cluster analysis-based technique to identify focal lesions that persist longitudinal in femoral articular cartilage [6]; we have shown significant differences between ACL-injured knees and a healthy volunteer group [6]. The goal of our study was to assess whether the contralateral knee can be used as a control in the ACL-injured population.Methods
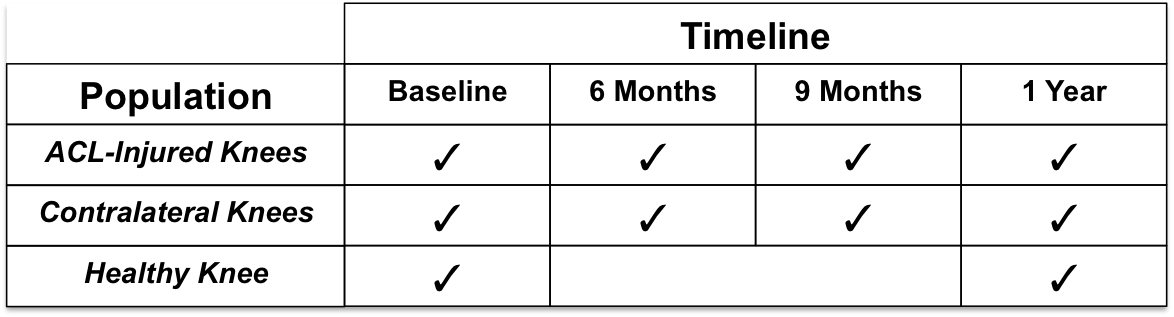
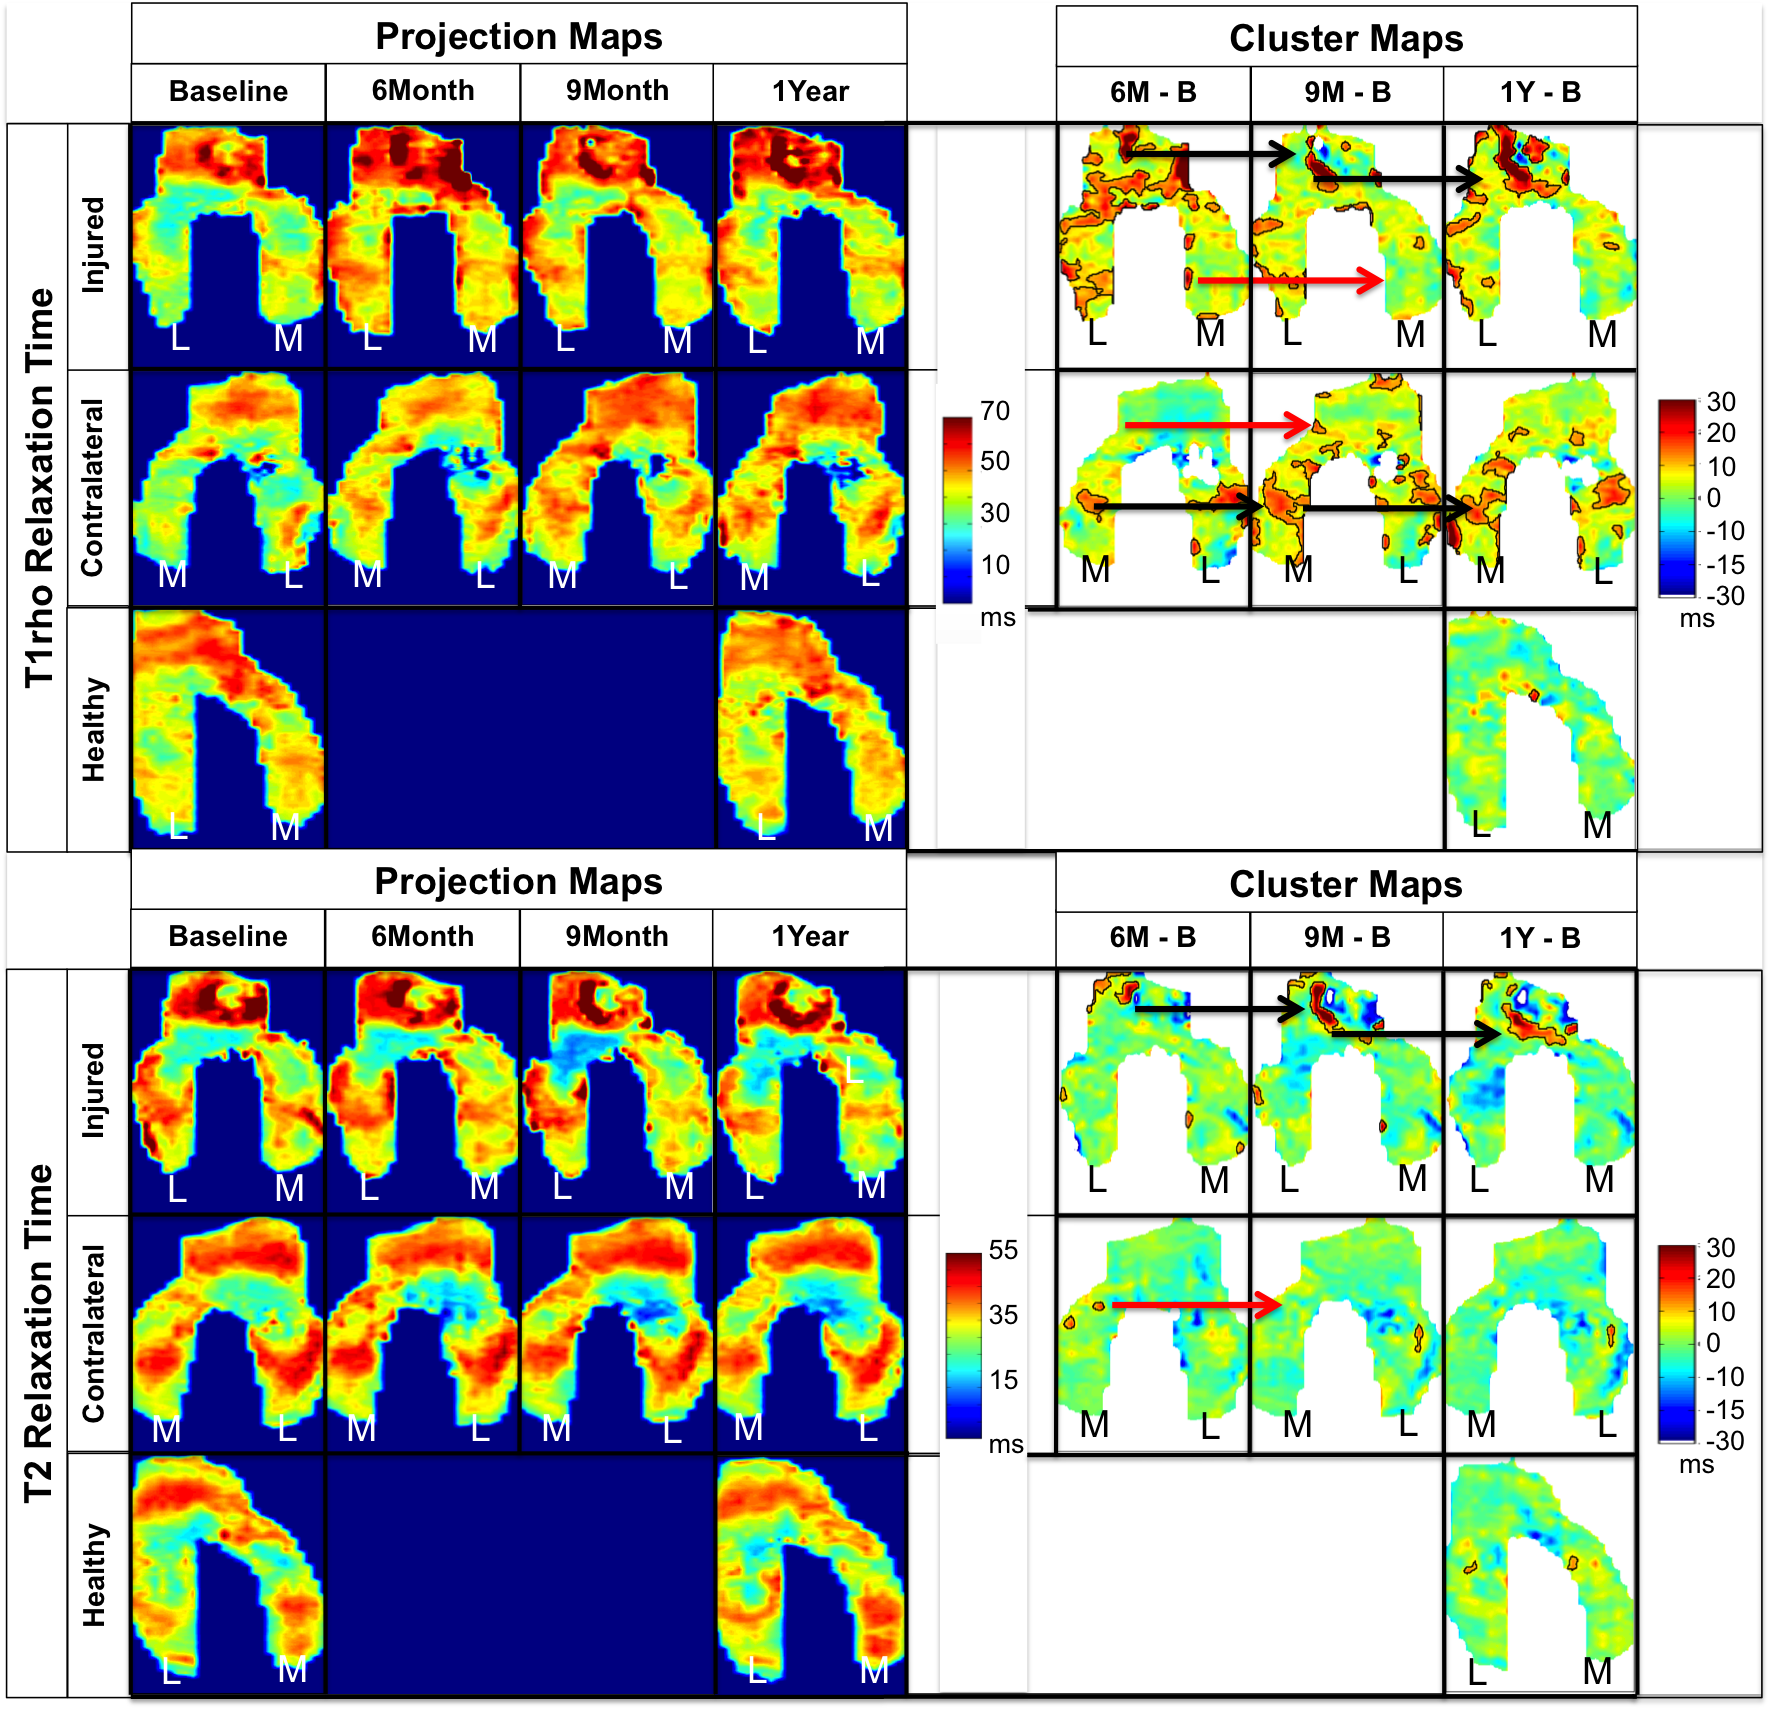
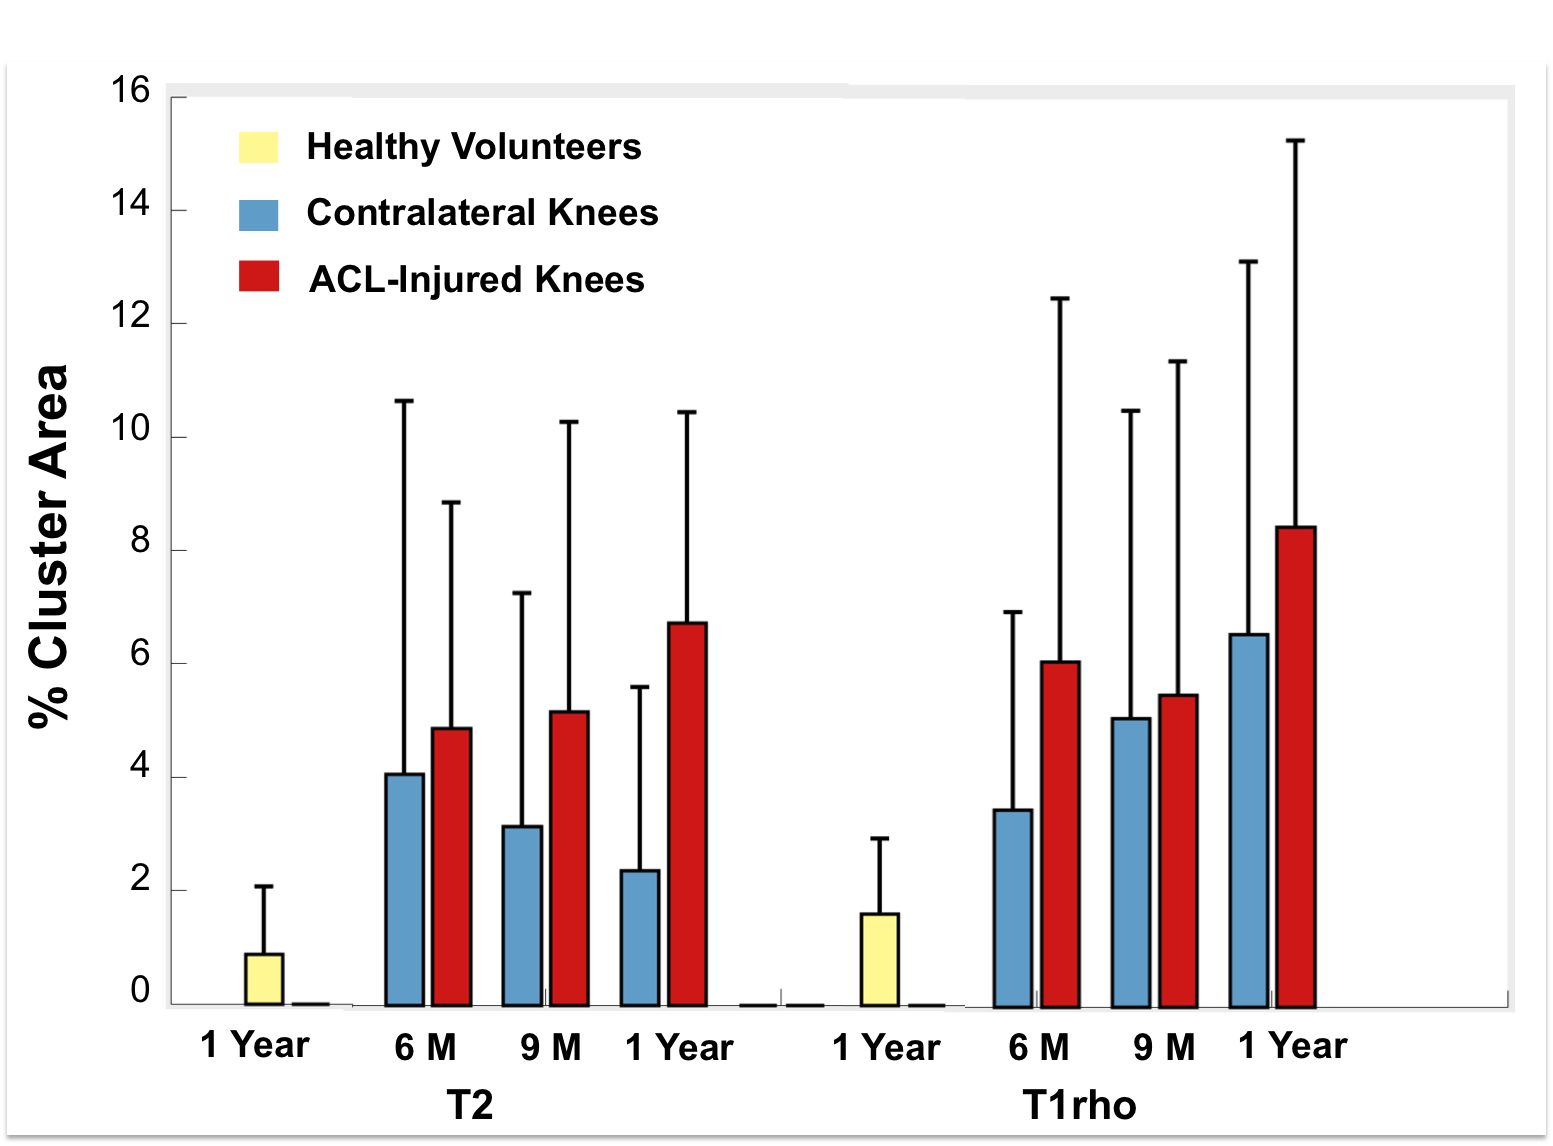
We scanned both knees of eighteen unilateral-ACL-injured patients and one knee of five healthy volunteers at 3T (MR 750, GE Healthcare, Waukesha, WI) using a volume-transmit, 8 channel-receive knee coil (Invivo Inv., Gainesville, FL). The scans were acquired at various time-points over 1-year (Table 1). We performed T2 and T1rho relaxation time mapping using a quantitative double-echo in steady-state sequence (DESS) [7] and a T1rho magnetization-prepared 3D spin-echo (CubeQuant) sequence [8], respectively. We created projection maps of the 3D cartilage surface at each time point and identified clusters where T2 and T1rho values were increasing in comparison to the baseline data (Fig. 1) [6]. To define clusters, thresholds of minimum increases in relaxation time and minimum area had to be met. Specifically, T2 increases had to be greater than 9ms and T1rho increases had to be greater than 10.8ms; these values were defined as two standard deviations of the mean change over 1-year for T2 and T1rho in the healthy volunteer group. Clusters had to exceed 12.4mm2 in size; this value was defined as the 85th percentile of cluster areas present in the healthy volunteer group. Our primary outcome measure was percent cluster area (%CA), defined as the combined area of all clusters of contiguous pixels that met the defined thresholds. We identified differences in %CA between the contralateral knees and the healthy knees as well as differences between the ACL-injured knees and the healthy knees using a Wilcoxon signed rank test.Results
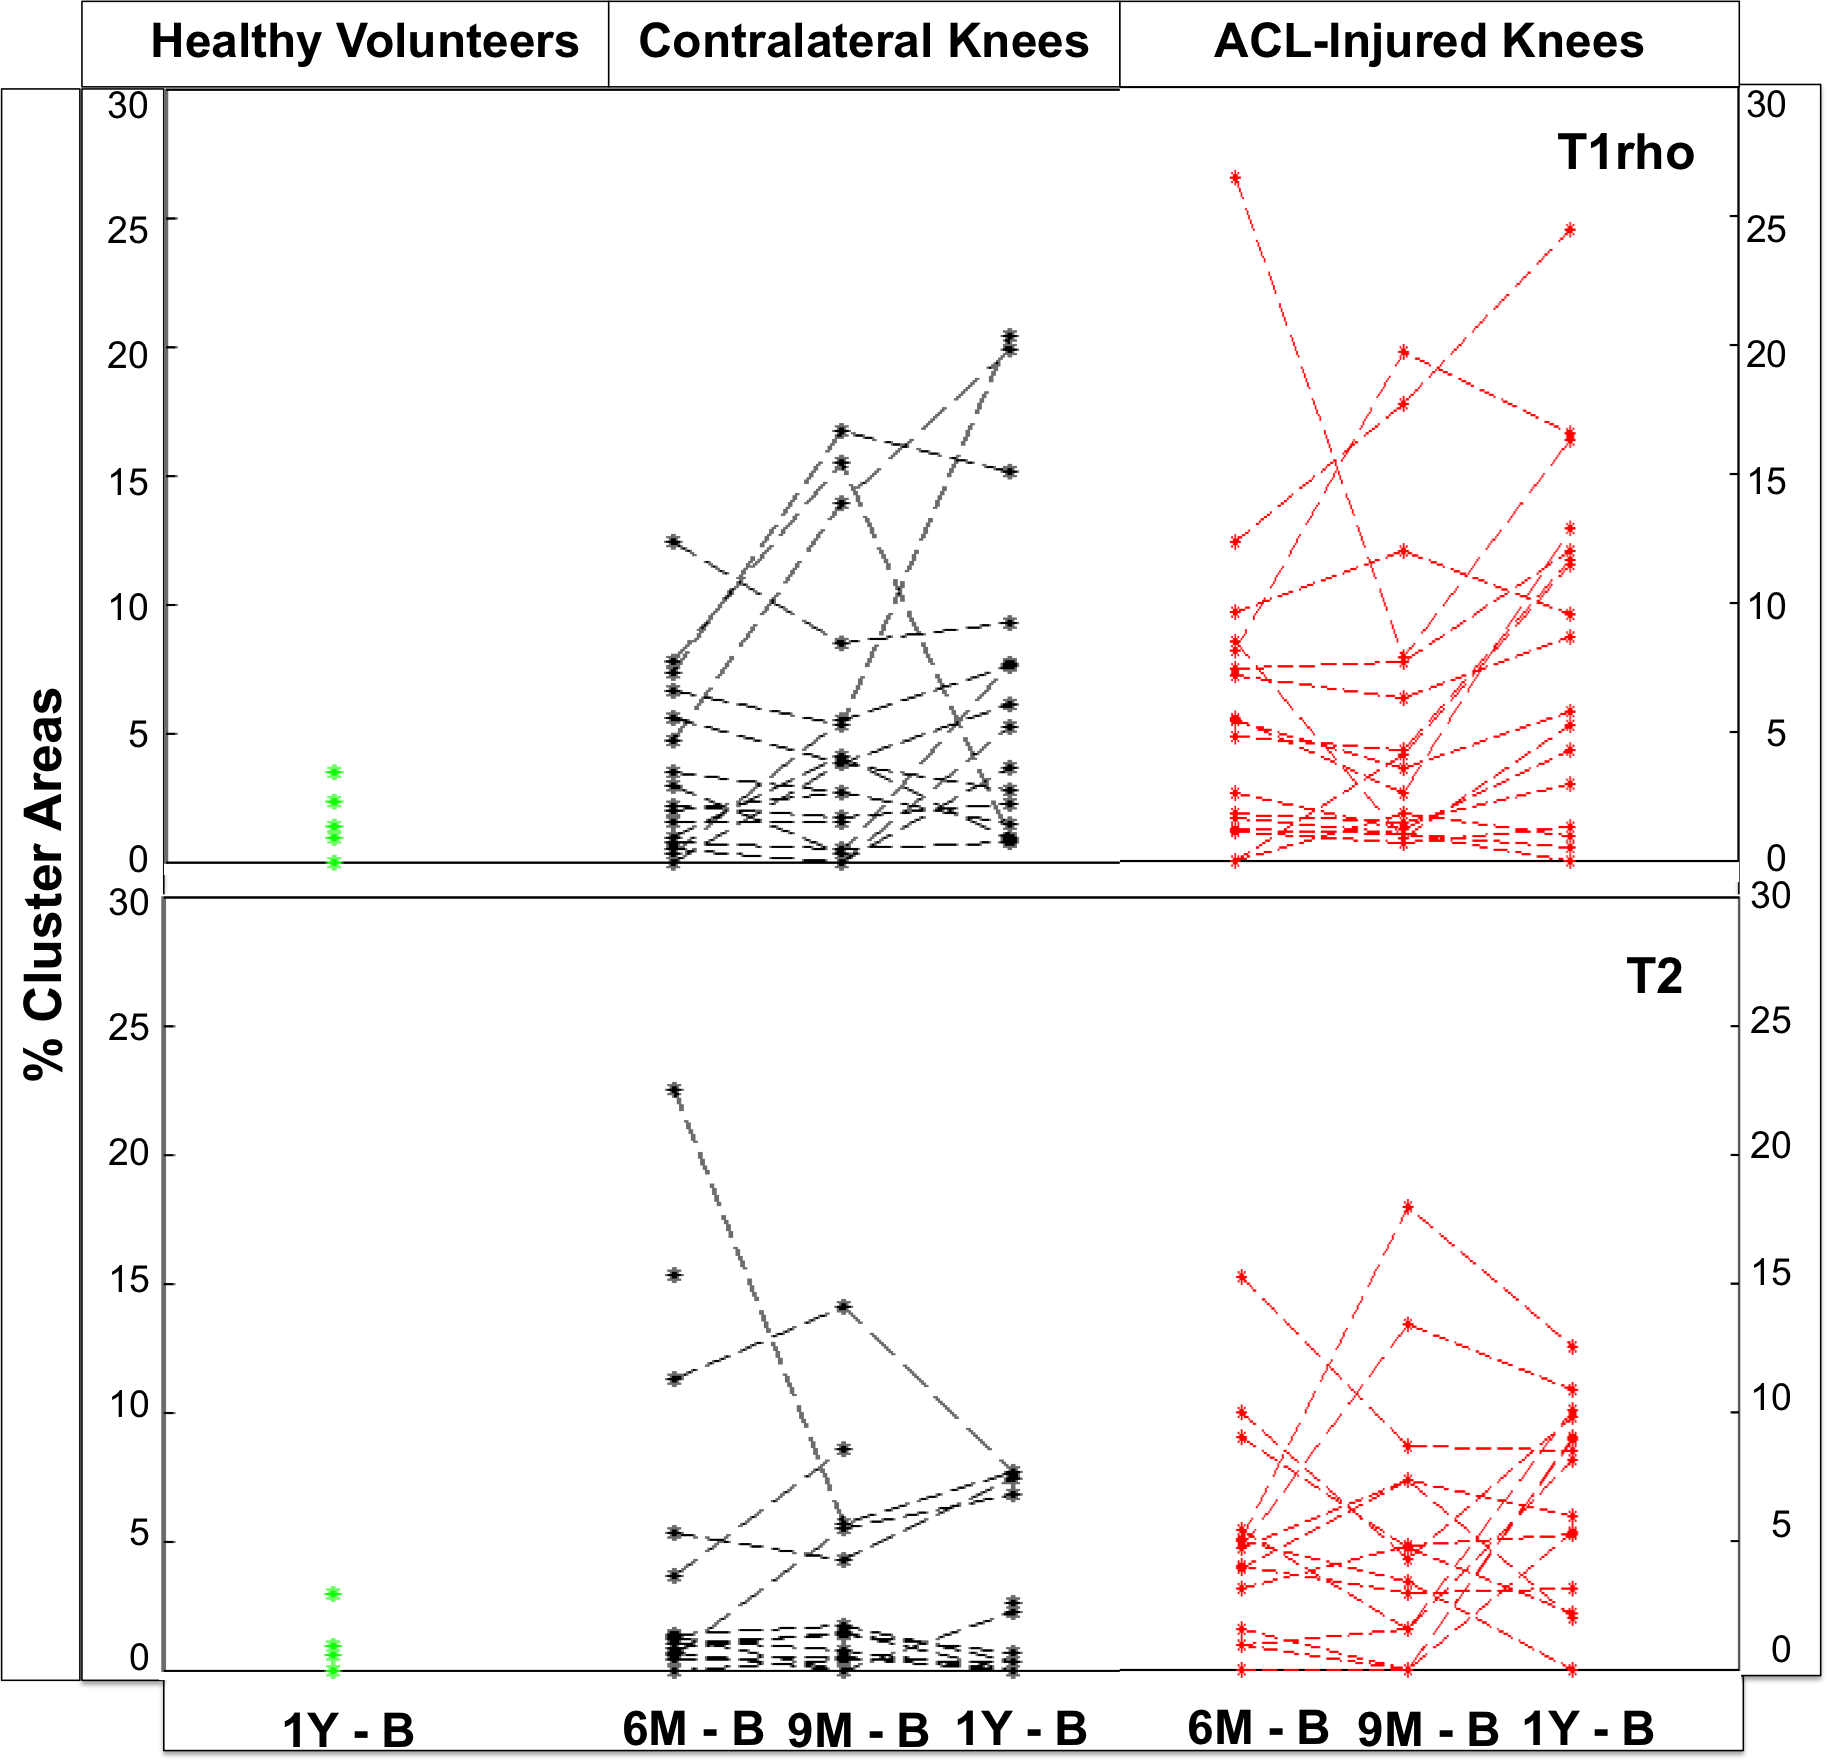
The mean T2 %CAs within the contralateral knee of the ACL-injured subjects decreased over 1-year while the mean T1rho %CAs increased over 1-year (Fig. 2). For T1rho, there was a significant increase in the %CAs of the contralateral knees as compared to the healthy-volunteer knees at 1-year (p =0.045). In the ACL-injured knees, the mean %CAs increased over 1-year for both T2 and T1rho relaxation times (Fig. 2). Significant increases in the %CAs of the ACL-injured knees as compared to the healthy-volunteer knees were observed at all time points for T2 (p < 0.01) as well as at the 6-month and 1-year change time points for T1rho (p < 0.05). Compared to the ACL-injured knees, most of the individual T2 %CAs of the contralateral knees showed minimal change over time, however, there were some exceptions (Fig. 3). The individual T1rho %CAs for the contralateral knees shows an increasing trend similar to that of the ACL-injured knees (Fig. 3). Some clusters track over time with increasing size or intensity [Fig. 1 – black arrows] while other smaller clusters exhibit no particular trend [Fig. 1 – red arrows].Discussion
We observed significant differences in T1rho %CAs between the contralateral knees and healthy volunteers’ knees at 1-year demonstrating that the contralateral knee may not be an appropriate control. The T1rho %CAs that track over time may be more progressive clusters representing much earlier OA changes. Minimal T2 %CA change and an overall decreasing trend over time suggest a more transient response of clusters that don’t meet the threshold criteria. Persistent and increasing %CAs in the ACL-injured knees suggests degenerative changes.
Conclusion
Comparable, significant increases over time in T1rho relaxation times of the ACL-injured and contralateral knees demonstrate that the contralateral knees may not be an appropriate control for quantifying cartilage changes in ACL-injured patient studies.Acknowledgements
R01 AR0063643, NIH R01EB002524, NIH K24AR062068, Arthritis Foundation, GE Healthcare and DARE FellowshipReferences
[1] Lohmander LS. et al. Arthritis Rheum 2004;50(10):3145e52. [2] Pedoia V. et al. Journal of Orthopaedic Research. 2016. Doi 10.1002/jor.23398 [3] Theologis AA. et al. Knee Surg Sports Traumatol Arthrosc. 2014. Doi: 10.1007/s00167-013-2397-z [4] Su F. et al. Osteoarthritis Cartilage 2013;21(8):1058e67. [5] Fleming BC. et al. Osteoarthritis Cartilage 2010. Doi: 10.10016/j.joca.2010.01.009 [6] Monu U. et al. Osteoarthritis and Cartilage. 2016. doi:10.1016/j.joca.2016.09.015. [7] Staroswiecki E. et al. Magn Reson Med 2012;1096:1086–1096. [8] Chen W et al. In: Proc Annual Meeting ISMRM 2011:231.Figures