1144
In Vivo Follow-up of Low-Grade Femoral Cartilage Defects using Sodium MRI at 7T1High Field MR Center, Department of Biomedical Imaging and Image-Guided Therapy, Medical University of Vienna, Vienna, Austria, 2Research Unit of Medical Imaging, Physics and Technology, University of Oulu, Oulu, Finland, 3CD Laboratory for Clinical Molecular MR Imaging, Vienna, Austria, 4Department of Orthopaedics, Medical University of Vienna, Vienna, Austria, 5Novartis Institutes for Biomedical Research, Basel, Switzerland, 6Division of Radiological Physics, Department of Radiology, University of Basel Hospital, Basel, Switzerland, 7Department of Traumatology, Medical University of Vienna, Vienna, Austria, 8Department of Diagnostic Radiology, Oulu University Hospital, Oulu, Finland, 9Medical Research Center, University of Oulu and Oulu University Hospital, Oulu, Finland
Synopsis
Sodium (23Na) MRI was employed for the evaluation of patients with ICRS Grade I-II cartilage defects at 7T. 23Na data from defect, weight-bearing, and non-weight-bearing region of femoral cartilage were obtained at baseline, 8-days, 3-months and 6-months follow-up. Significantly lower 23Na values were found in defect than in weight-bearing and non-weight-bearing regions at all time-points. While 23Na values in weight-bearing and in non-weight-bearing regions were stable over time, a significant decrease was found in the defects. 23Na-MRI allows noninvasive follow-up of changes in the cartilage GAG content and thus might be particularly useful for the evaluation of cartilage regenerating therapies.
Purpose
In early stages of cartilage degeneration, subtle morphological alterations are usually a result of much larger changes in biochemical composition of cartilage, such as depletion of glycosaminoglycans (GAG). Noninvasive MRI methods sensitive to changes in cartilage composition are therefore very attractive for studies aiming to evaluate cartilage degeneration or regeneration. Previous in vitro experiments with cartilage samples showed a high sensitivity of sodium (23Na) MRI to even small changes in the GAG concentration(1). Additionally, 23Na-MRI was successfully used for the in vivo evaluation of the GAG content in both cartilage repair tissue(2) and osteoarthritic cartilage(3).
The aim of this 7T study was to: i) evaluate the reproducibility of 23Na-MRI in patients with untreated low-grade chondral defects; ii) compare 23Na-results between different cartilage regions; iii) compare 23Na-data between baseline and follow-up measurements.
Methods
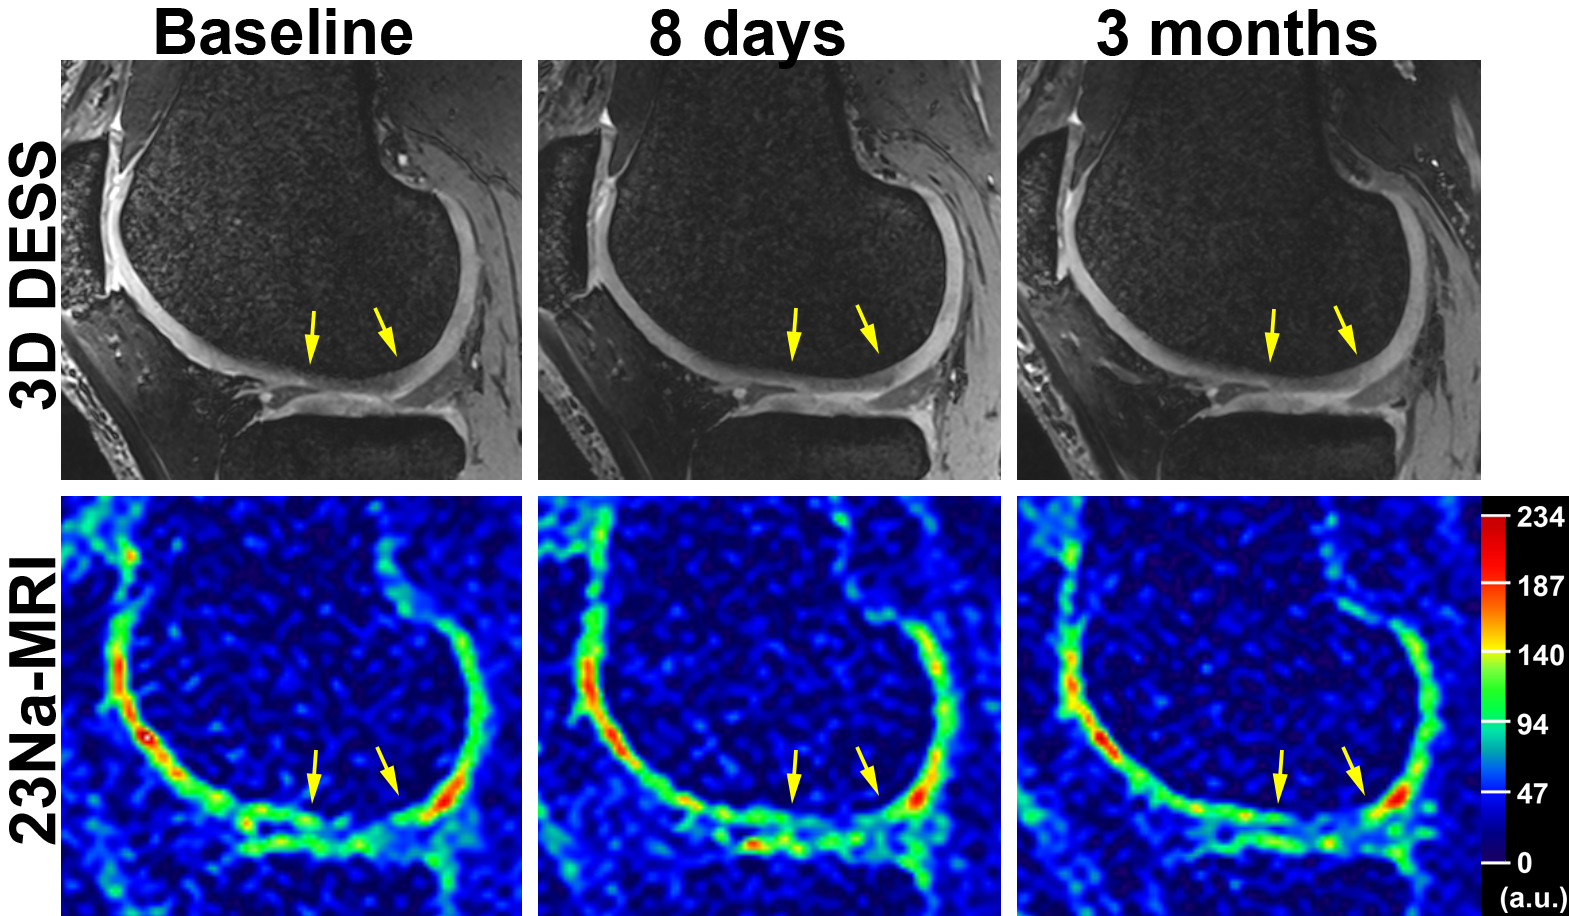
This study was approved by Institutional Review Board and informed consent was obtained from all patients. Ten patients (6 females, 4 males; mean age, 48±9 years; mean body mass index, 25.6±3.4 kg/m2; 6 right/4 left knees) with untreated chondral defects of ICRS Grade I (n=8) or II (n=2) were included in this longitudinal study. Each patient was imaged at baseline, 8-days, 3-months and 6-months follow-up. Eight lesions were located in a weight-bearing region of femoral cartilage (5 lateral/3 medial condyles), one in the non-weight-bearing region of lateral femoral condyle and one the in trochlea. All MRI images were acquired at a whole body 7T system (Magnetom, Siemens Healthineers, Germany). Morphological T2-weighted 3D DESS images (0.5mm isotropic resolution; TR/TE= 8.68/2.55ms; measurement time= 3:58min) (Fig.1) were acquired using a 28-channel knee array coil (Quality Electrodynamics, OH, USA). A spoiled gradient echo sequence with variable echo times(4) was used for 23Na imaging (resolution= 1.6×1.6×3.0mm3; TR= 9.2ms; TEmin/TEmax= 1.22/1.82ms; flip angle= 51°; bandwidth= 100Hz/pixel; measurement time= 25min) (Fig.1) using a 15-channel 23Na-only knee array coil (Quality Electrodynamics, OH, USA).
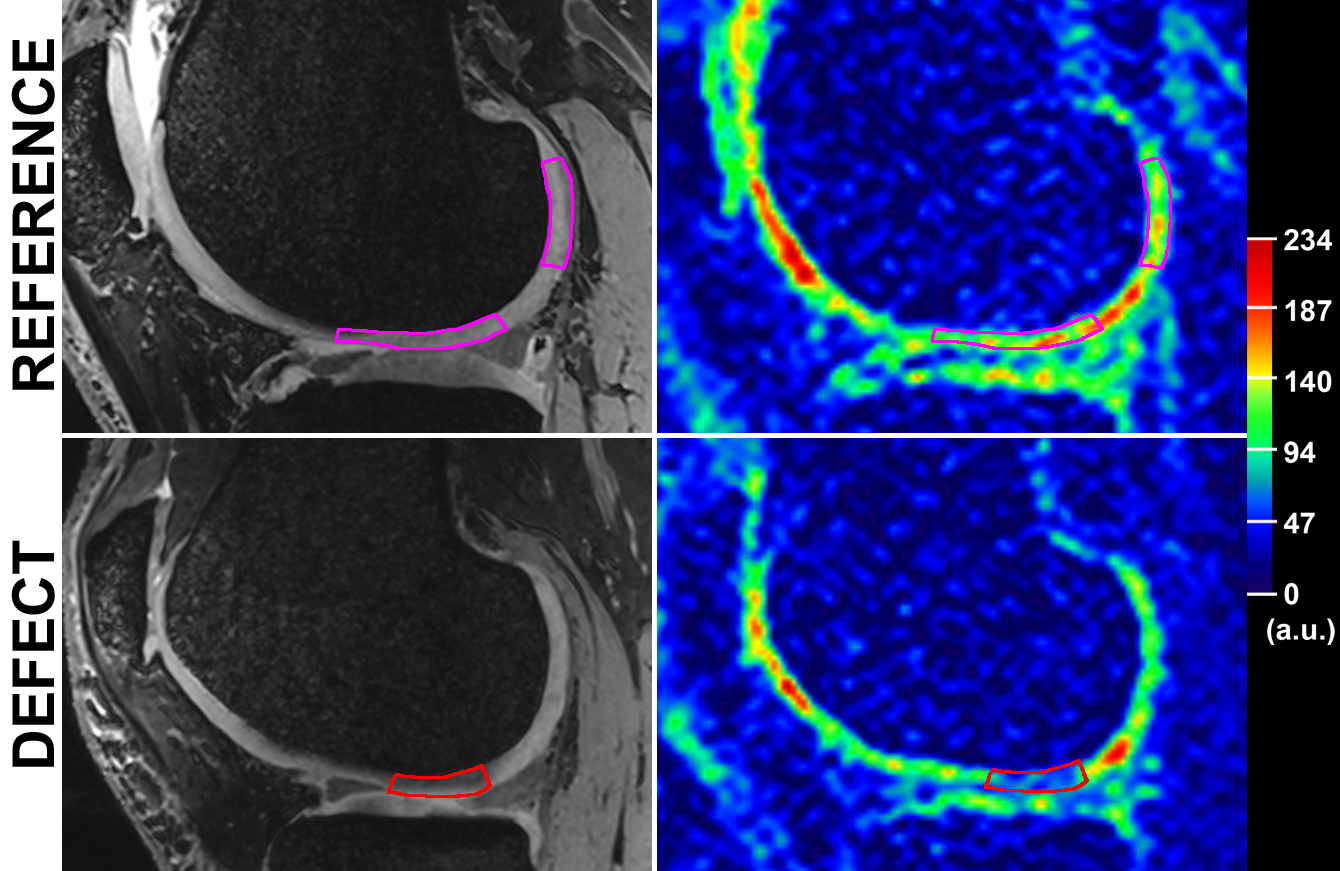
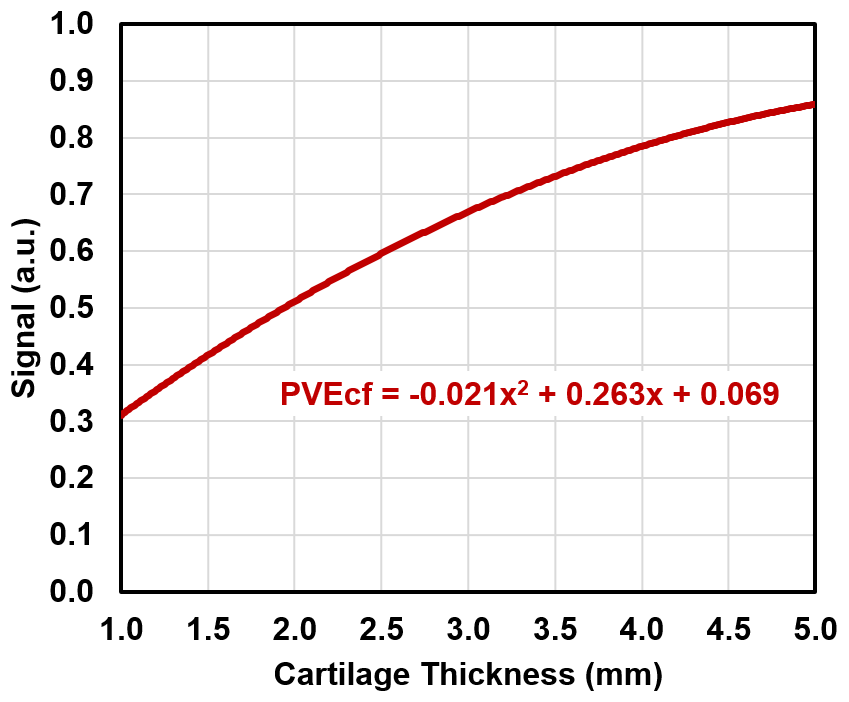
An expert musculoskeletal MRI radiologist identified one cartilage defect in each patient on morphological images from a routine 3T exam and selected corresponding 7T DESS images for manual segmentation and thickness measurements of cartilage. Images of a homogeneous phantom were used to correct 23Na-images for the spatially variable sensitivity of the knee coil. Regions-of-interest (ROIs) were drawn on DESS images, in chondral defect area in weight-bearing and in non-weight-bearing regions of normal-appearing femoral cartilage. All ROIs were subsequently transferred to the corresponding 23Na-images (Fig.2). In each patient, three consecutive 23Na-slices were evaluated on the JiveX viewer (VISUS GmbH, Germany). For the calculation of corrected 23Na-signal intensities (cSI), mean 23Na-signal intensities from ROIs were corrected for partial volume effects by fitting the cartilage thickness in ROI to a function describing the signal attenuation in 23Na-image(5) (Fig.3). Since some of the follow-up scans of this ongoing study were not acquired yet, the data from 3-months and 6-months were grouped together for statistical evaluations. Intra-class correlation coefficients (ICC) and analysis of covariance models with pair-wise comparisons were determined.
Results
i) The reproducibility of 23Na-cSI values between the baseline and 8-days follow-up was almost perfect in all regions (ICC; weight-bearing: 0.91, non-weight-bearing: 0.93, defect: 0.97).
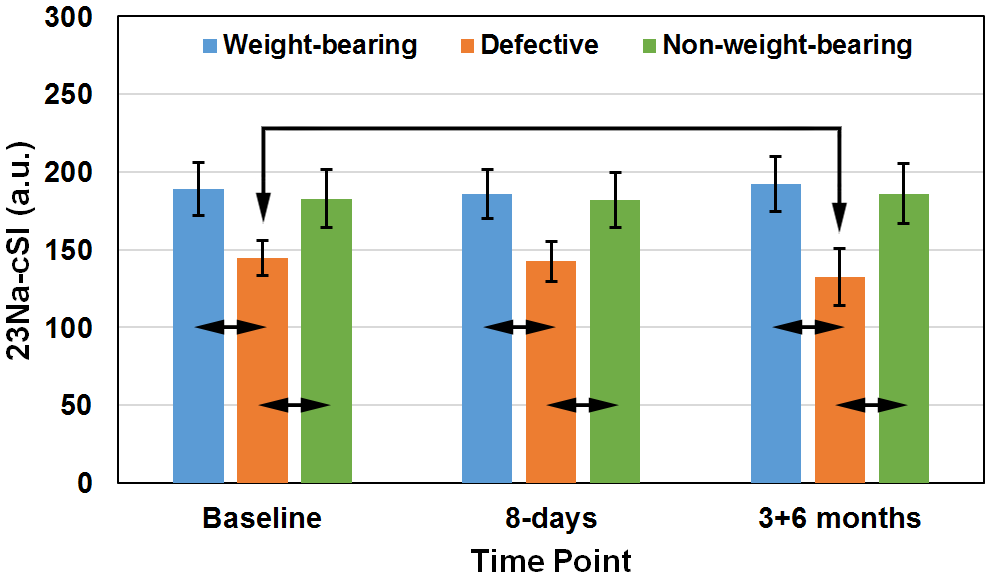
ii) 23Na-cSI values were significantly lower in the defects than in weight-bearing or in non-weight-bearing regions at all time-points (baseline: p<0.001; 8-days: p<0.001; 3+6-months: p<0.03) (Fig.4).
iii) Comparison between the baseline and 3+6-month measurements did not show any significant changes in 23Na-cSI values calculated from weight-bearing and non-weight-bearing regions. However, a significant decrease of 23Na-cSI values in defect area was observed between the baseline and 3+6-month scans (p=0.007) (Fig.4). While four patients showed stable 23Na-cSI values (change range: -1% to -3%), another three patients showed lower 23Na-cSI values (change range: -12% to -20%) in the follow-up measurements.
Discussion
Our preliminary results demonstrate that 23Na-MRI at 7T can offer very reproducible measurements. The obtained 23Na-cSI values were able to differentiate between normally appearing cartilage and ICRS Grade I or II chondral defects. Furthermore, our preliminary data suggest that some defects could show faster progression of degeneration than others. This could be explained by different types of injuries in patients and by different intervals between the time of injury and the baseline scan. Interestingly, only one patient showed morphological progression of the defect (Grade II->III). This is in line with previous studies suggesting that changes in biochemical composition of cartilage precede morphological changes.Conclusion
23Na-MRI enables noninvasive follow-up of cartilage degeneration in patients with low-grade cartilage defects based on monitoring of changes in the GAG content. 23Na-cSI values may therefore serve as a valuable biomarker for the evaluation of changes in GAG content during cartilage regenerating therapies.Acknowledgements
No acknowledgement found.References
(1) Borthakur A., et al., Sensitivity of MRI to proteoglycan depletion in cartilage: comparison of sodium and proton MRI. Osteoarthritis Cartilage. 2000;8:288-93.
(2) Zbyn S, et al., Evaluation of native hyaline cartilage and repair tissue after two cartilage repair surgery techniques with 23Na MR imaging at 7 T: initial experience. Osteoarthritis Cartilage. 2012;20:837-45.
(3) Madelin G., et al., Articular Cartilage: Evaluation with Fluid-suppressed 7.0-T Sodium MR Imaging in Subjects with and Subjects without Osteoarthritis. Radiol. 2013;268,481-91.
(4) Deligianni X., et al., High-Resolution Fourier-Encoded Sub-Millisecond Echo Time Musculoskeletal Imaging at 3 Tesla and 7 Tesla. Magn Reson Med. 2013;70,1434-39.
(5) Moon C.H., et al., Quantitative 23Na MRI of Human Knee Cartilage Using Dual-Tuned 1H/23Na Transceiver Array Radiofrequency Coil at 7 Tesla. J Magn Reson Imaging. 2013;38,1063-72
Figures