1143
Two compartmental diffusion model of skeletal muscle: application to aging and chronic limb suspension induced DTI changes in the medial gastrocnemius1Physics, San Diego State University, San Diego, CA, United States, 2Physics, UC San Diego, San Diego, CA, United States, 3Radiology, UC San Diego, San Diego, CA, United States
Synopsis
Diffusion tensor imaging (DTI) is a powerful technique that allows one to probe tissue at the microstructural level. Though microarchitecture determines the DTI indices, a diffusion model is required to make inferences about the microstructure. We applied a two compartmental diffusion model for muscle to explain differences in the DTI indices with age and with atrophy induced by limb suspension. The model qualitatively explains the changes in DTI seen in limb suspension that is linked to decrease in muscle fiber diameter and in intracellular volume fraction. Extensions to the model are required to explain the age related changes in DTI.
Purpose
Skeletal muscle diffusion tensor imaging allows the computation of indices (e.g., lead eigenvalues (λ1, λ2, λ3) eigenvectors, and fractional anisotropy (FA)) that reflect underlying muscle tissue microarchitecture (e.g., muscle fiber diameter, dm, asymmetry of muscle fiber cross-section, α, intracellular volume fraction Vin, fractional collagen content Vcol in the extracellular matrix). However, a direct inference of the micro-architectural parameters is not possible from the computed diffusion tensor indices. We perform two-compartment modeling that relates the underlying tissue microstructure to the diffusion signal and apply this model to explain age and chronic atrophy related changes in the diffusion tensor indices.Methods
All imaging studies were performed after IRB approval. Magnetic Resonance Imaging studies were performed on (i) nine young (27.5 ± 4.8 yrs) and eight senior (77.6 ± 7.3 yrs) female subjects for the aging study and (ii) seven subjects who were scanned pre and post Unilateral limb suspension (ULLS) for the chronic atrophy study. The ULLS model included a 4-week unloading of the dominant leg using crutches and the non-dominant leg supported by a raised shoe. The DTI protocol was: Fat suppressed single shot EPI sequence without dual 180° pulses. Thirty-two non-collinear gradient directions with a b-factor of 400s/mm2 were used to map the direction dependent diffusion. Imaging parameters were echo time (TE)/repetition time (TR): 49 ms/4000 ms with 4 signal averages. Diffusion data were pre-processed for eddy currents, field map corrections followed by B-spline registration to a volume with geometric fidelity for susceptibility induced artifacts, and denoised prior to computing the diffusion tensor. The simulation was performed using the two-compartment model (fibers (intra-myocellular space) embedded in an extracellular matrix (endomysium)) for muscle diffusion proposed by Karampinos et al1. We simulated the changes in diffusion eigenvalues/FA for different combinations of the underlying parameters (e.g., α, Vcol, Vin) to explore the changes in the microstructural features that can account for the experemntaly observed changes with aging and with chronic atrophy.Results
Table 1 summarizes the eigenvalues and FA for the medial gastrocnemius in the young and senior cohorts and for the pre- and post- ULLS cohorts. In the aging study, significant increases in the three eigenvalues and a small increase in FA (not significant) were observed in the senior cohort compared to the young cohort. In contrast to aging, in chronic atrophy induced by ULLS, significant decreases were observed in all three eigenvalues for the post- ULLS while the FA increased though it did not reach significance. Figures 1 through 3 are the simulation for FA, the second and the third eigenvalue. Table 2 summarizes the direction of change in each microstructure variable and the impact on the DTI indices.Discussion
Muscle loss is seen with aging as well as post-ULLS (-9.6% change from pre- to post-ULLS). This muscle loss is anticipated to arise from muscle fiber atrophy (decrease in diameter). However, the fact that the DTI indices do not show similar trends with aging induced atrophy and with ULLS induced atrophy indicates that more complex (and different) changes occur at the microstructural level in the two types of atrophy. It is anticipated that in both atrophy, Vin decreases from a decrease in muscle fiber diameter (dm decrease). The simulation shows that even with an unchanging alpha and collagen fraction, decrease in Vin and dm will decrease all three eigenvalues and increase FA (Table 2). This explains the experimental observations of the changes in the DTI indices with ULLS induced atrophy. However, it does not explain the increase in eigenvalues seen with aging. In aging, an extracellular volume increase has been observed which was possibly accompanied with increase in collagen deposition: both these microstructural changes will further decrease the eigenvalues and thus still does not explain the observed significant increase in the eigenvalues. It is possible that we have to extend the simulation to Vin <0.5 to explore the effect of really large increase in the extracellular volume.Conclusion
We have demonstrated the potential of modeling to link the observed DTI indices to the underlying microstructure. The current model explains the DTI changes seen in atrophy induced by ULLS but not by aging indicating that the model has to be extended to account for the more complex structural/ compositional changes with age.Acknowledgements
This work was supported by the National Institute of Arthritis and Musculoskeletal and Skin Diseases Grant 5RO1-AR-053343-08.References
[1] Karampinos DC, King KF, Sutton BP, Georgiadis JG. Ann Biomed Eng. 2009 Dec;37(12):2532-46.Figures
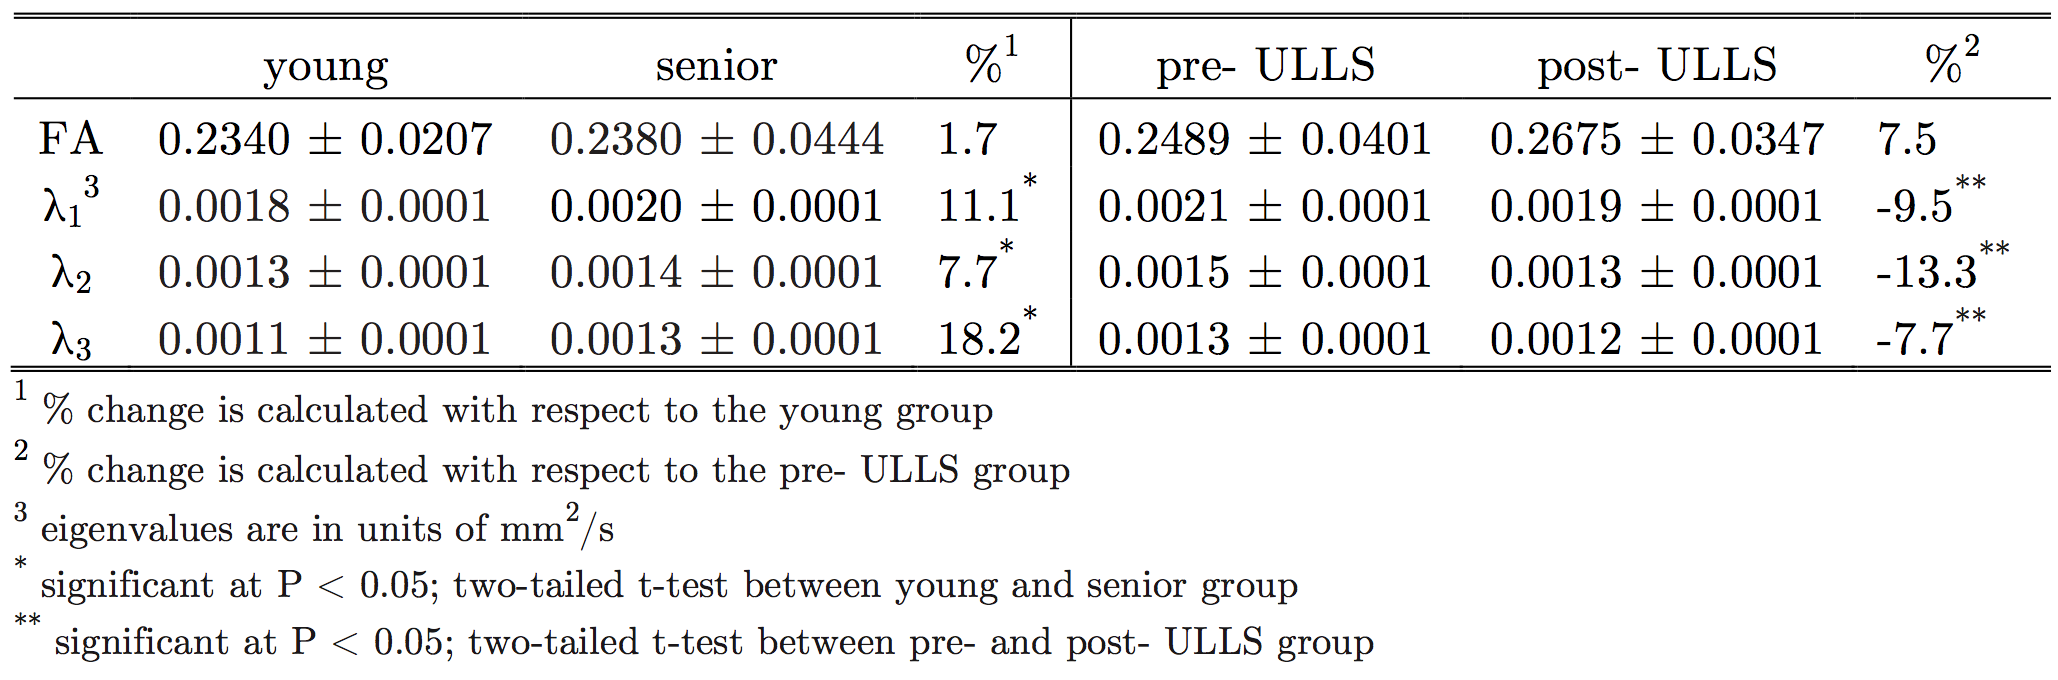
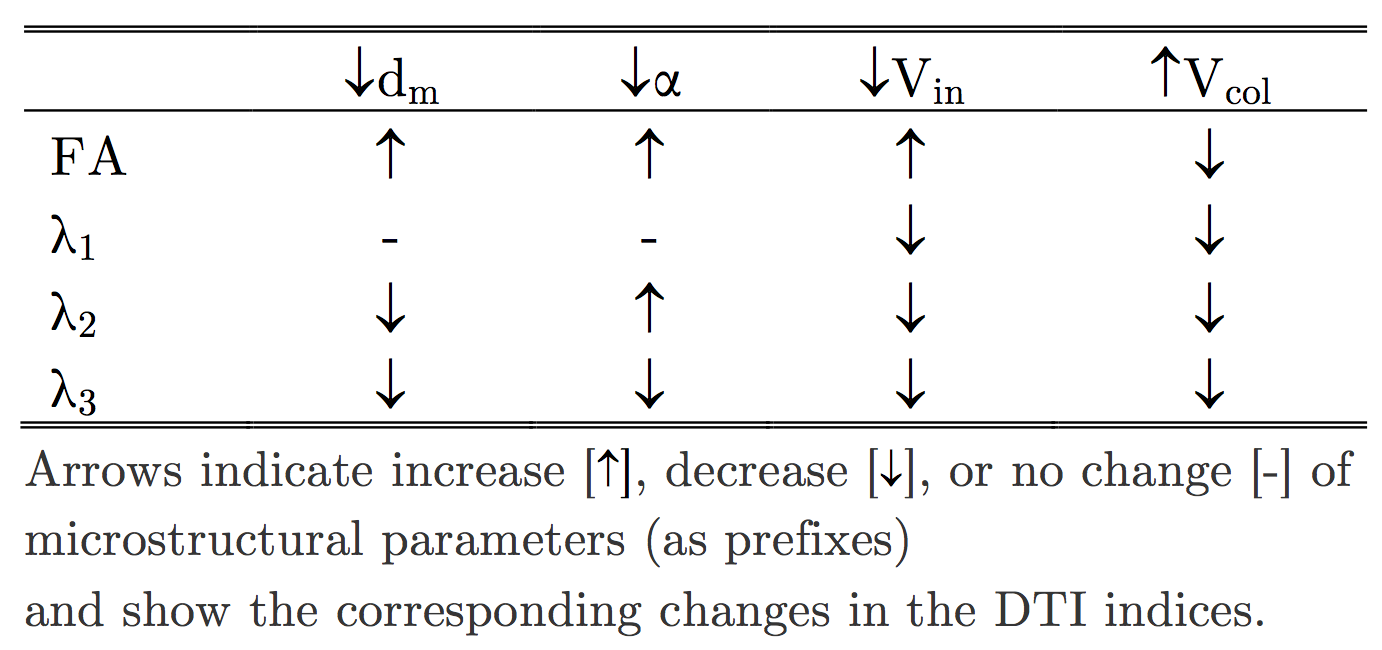
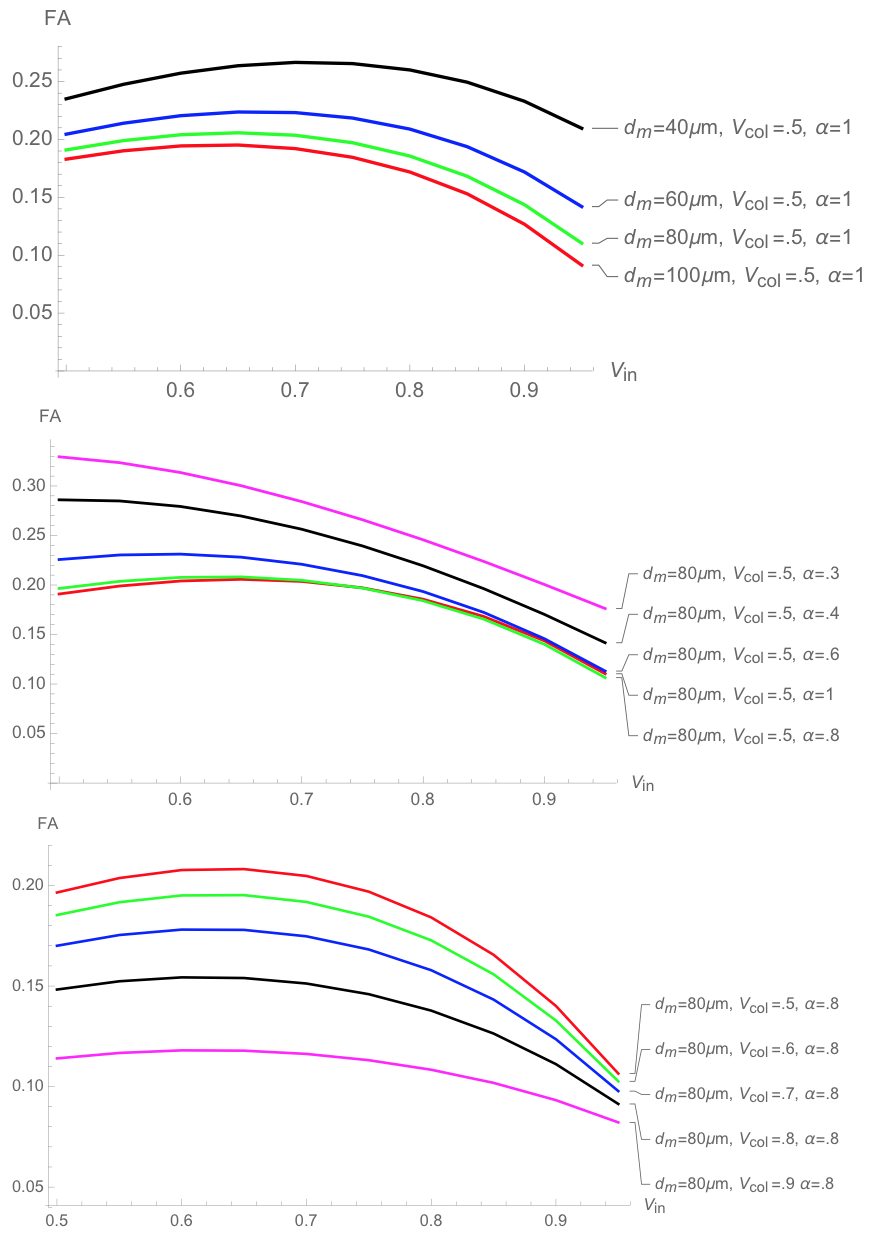
Figure 1. Simulation for FA values
Top: variable dm (muscle fiber diameter)
Middle: variable α (asymmetry of muscle fiber cross-section)
Bottom: variable Vcol (collagen volume fraction)
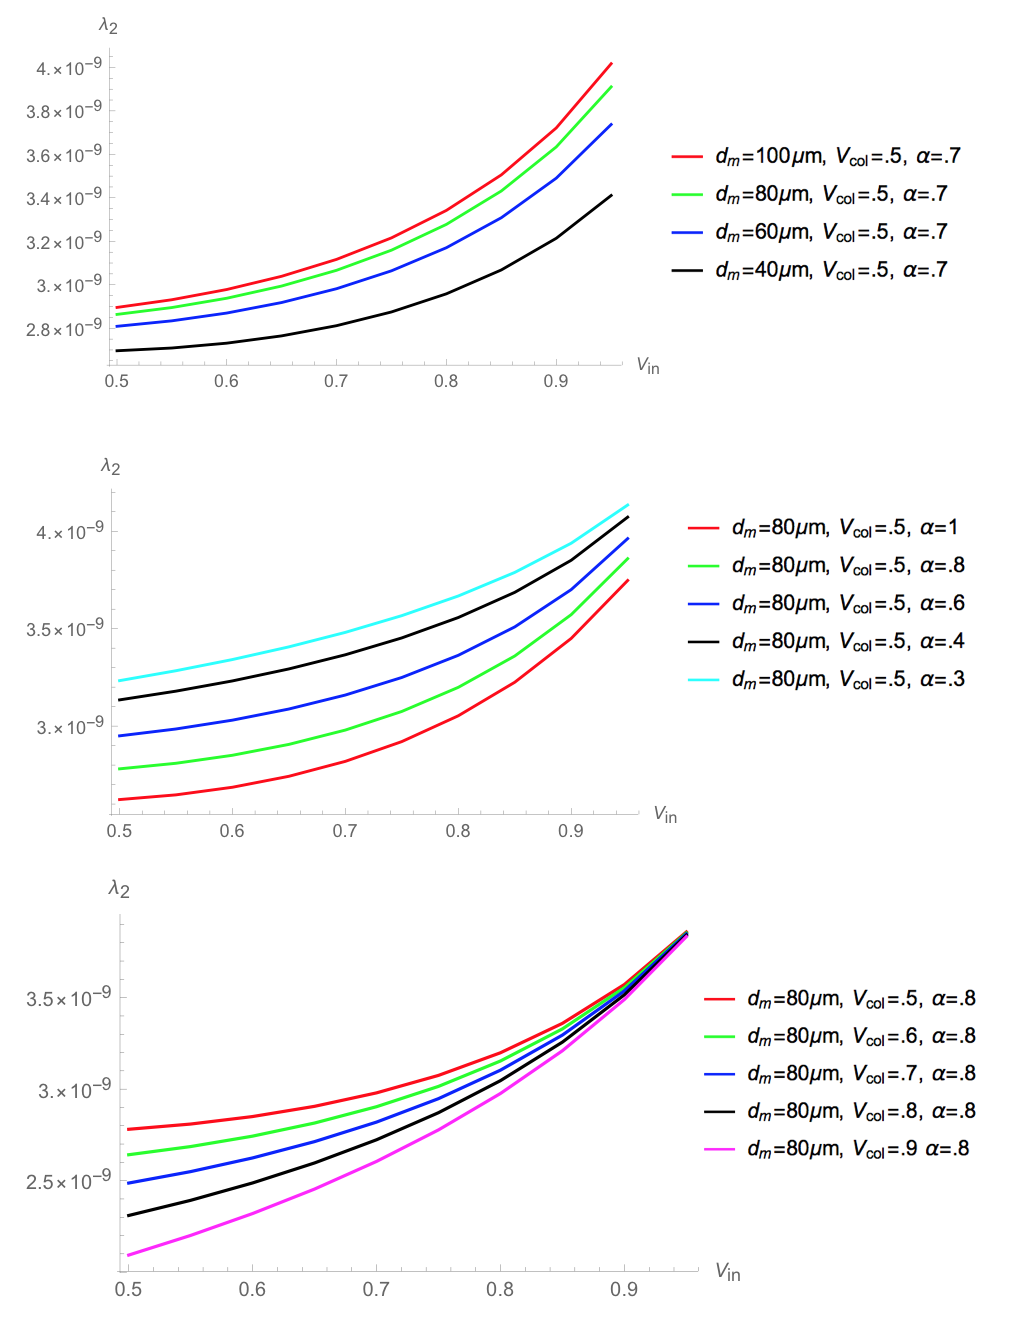
Figure 2. Simulation for λ2
Top: variable dm (muscle fiber diameter)
Middle: variable α (asymmetry of muscle fiber cross-section)
Bottom: variable Vcol (collagen volume fraction).
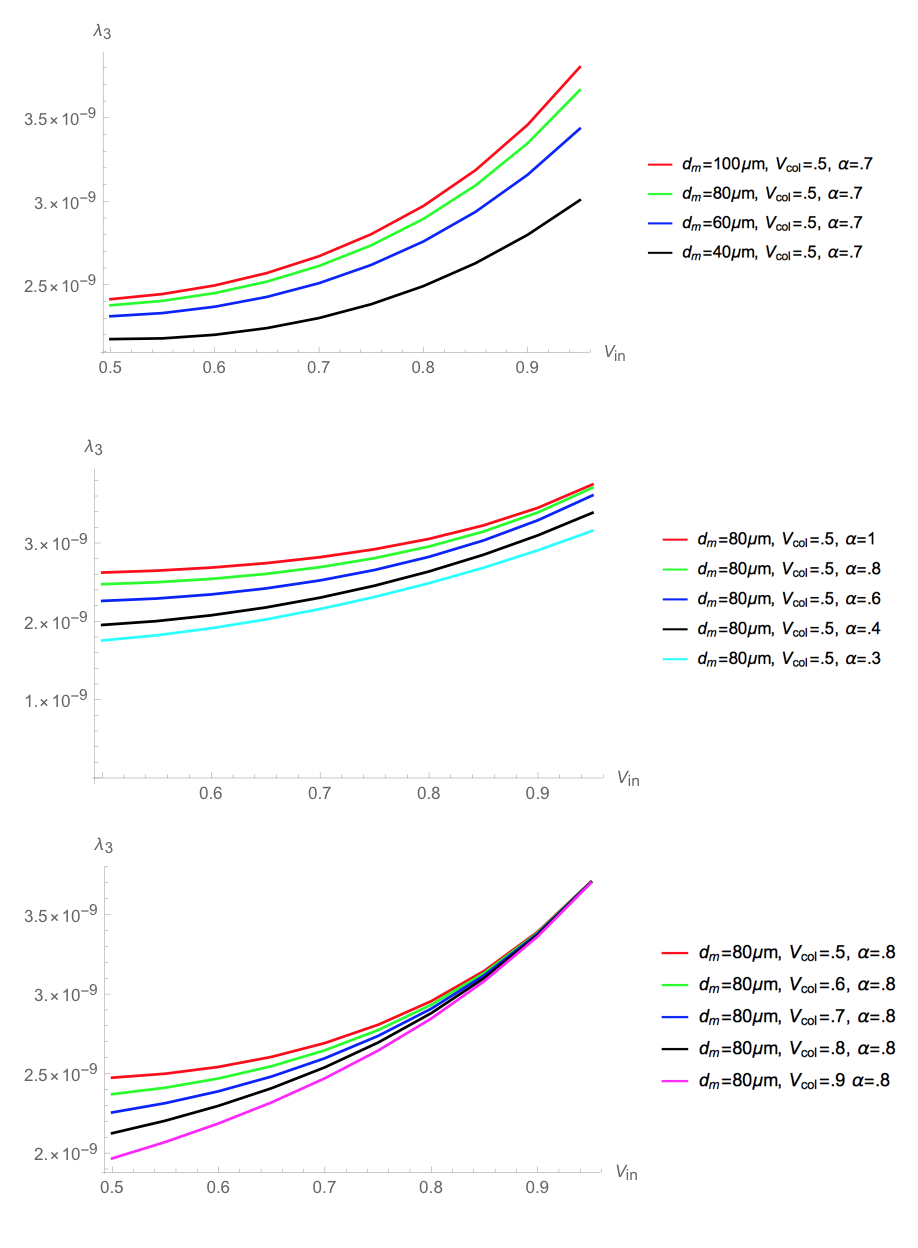
Figure 3. Simulation for λ3
Top: variable dm (muscle fiber diameter)
Middle: variable α (asymmetry of muscle fiber cross-section)
Bottom: variable Vcol (collagen volume fraction).