1138
Fibrosis in a Renal Allograft: The Role of Magnetic Resonance Elastography as a Non- Invasive Measurement Tool1Medical Imaging, St. Michael's Hospital, Toronto, ON, Canada, 2Li Ka Shing Knowledge Institute, St. Michael's Hospital, Toronto, ON, Canada, 3Medicine – Division of Nephrology, St. Michael's Hospital, Toronto, ON, Canada, 4Pathology, St. Michael's Hospital, Toronto, ON, Canada
Synopsis
A major reason for poor long-term kidney transplant outcomes is interstitial fibrosis. Currently, percutaneous biopsy, an invasive procedure that samples <1% of the allograft, is the gold standard for detecting renal allograft fibrosis. As the allograft scars, it stiffens due to the deposition of stiff extracellular matrix. This stiffening can be imaged non-invasively using magnetic resonance elastography (MRE). We used serial renal stiffness MRE imaging and serial percutaneous biopsies to measure whole allograft fibrosis preogression in a kidney transplant recipient. We show that renal allograft MRE can detect changes in overall fibrotic burden, as confirmed by biopsy.
Introduction
A major reason for poor long-term kidney transplant outcomes is the development of interstitial fibrosis and tubular atrophy.1,2 Percutaneous biopsy, an invasive procedure that samples <1% of the allograft, is the gold standard for detecting renal allograft fibrosis.3-5 As allograft scars, it stiffens due to the deposition of stiff extracellular matrix, which can be imaged non-invasively using a technique called magnetic resonance elastography (MRE).6 Here, to assess the possibility of using MRE as a non-invasive measure of fibrosis, we used serial renal stiffness MRE imaging and serial percutaneous biopsies to measure whole allograft fibrosis progression in a kidney transplant recipient.Case Presentation/Methods
A 37-year-old Caucasian male diagnosed with ESRD secondary
to obstructive uropathy underwent a living unrelated donor kidney transplant. Before receiving his allograft, the patient was enrolled into
a clinical study requiring a protocol biopsy. Our local REB approved the study
protocol and the patient provided written and informed consent to participate.
At 2-years transplant, the patient’s creatinine was stable at 2.2mg/dL (eGFR 39mL/min) and his urine albumin:creatinine ratio was 4.2mg/g creatinine. At this time, as a requirement of the separate clinical trial he was enrolled in, the patient underwent a protocol percutaneous allograft biopsy. To evaluate for a correlation between MRE-derived stiffness and biopsy-derived stiffness, we also performed a MRE on his renal allograft 1 month prior to the biopsy.
At 3.2-years post-transplant, the patient’s eGFR had declined to 23mL/min. His urine albumin:creatinine ratio had risen to 38.4mg/g creatinine. Given the unexplained rise in serum creatinine and urine albumin excretion, he underwent a clinically indicated allograft biopsy. To again evaluate for a correlation between MRE-derived stiffness and biopsy-derived fibrosis, the patient underwent a second MRE scan.
Using histology from biopsy and MRE imaging, we compared the changes in the patient’s renal allograft between two time points: 2-years post-transplant and 3.2-years post-transplant.
Results
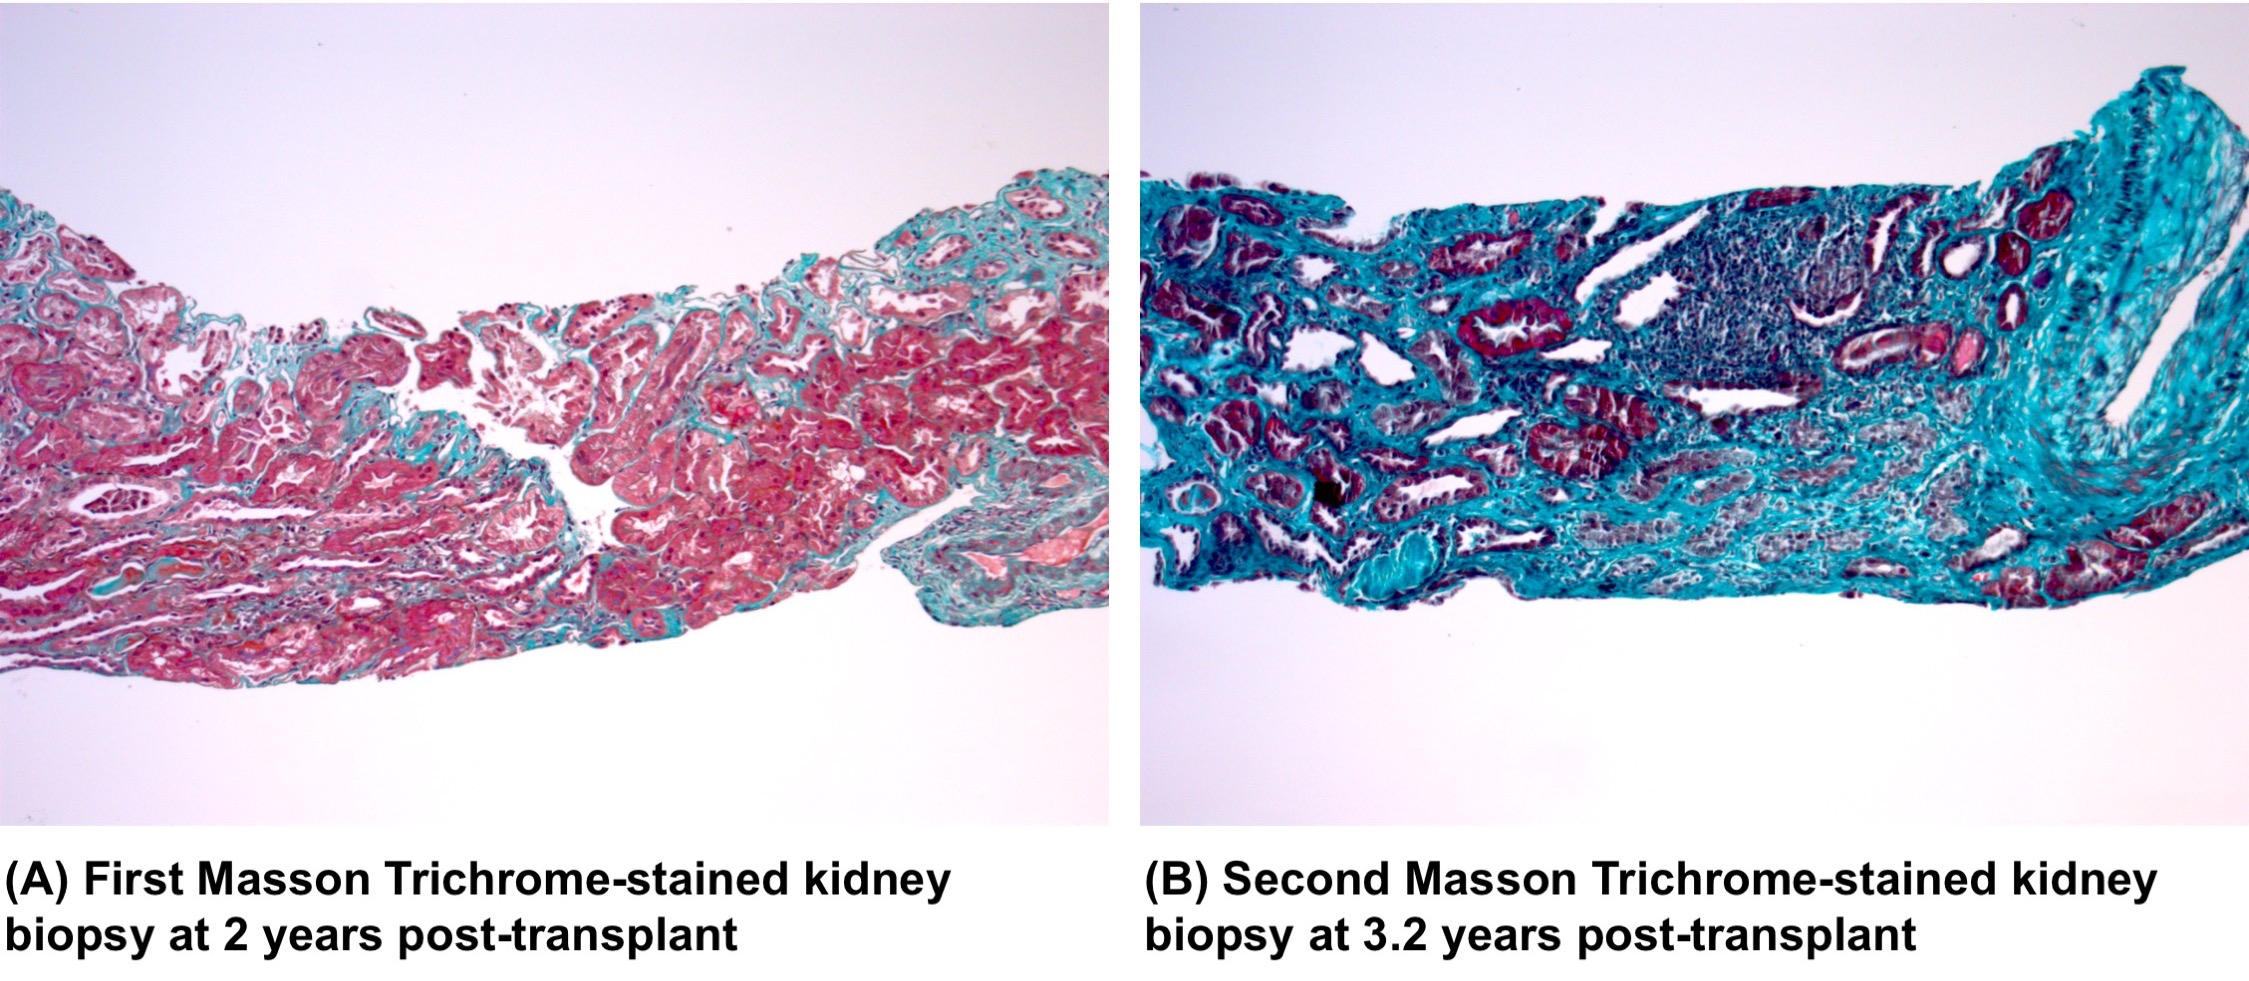
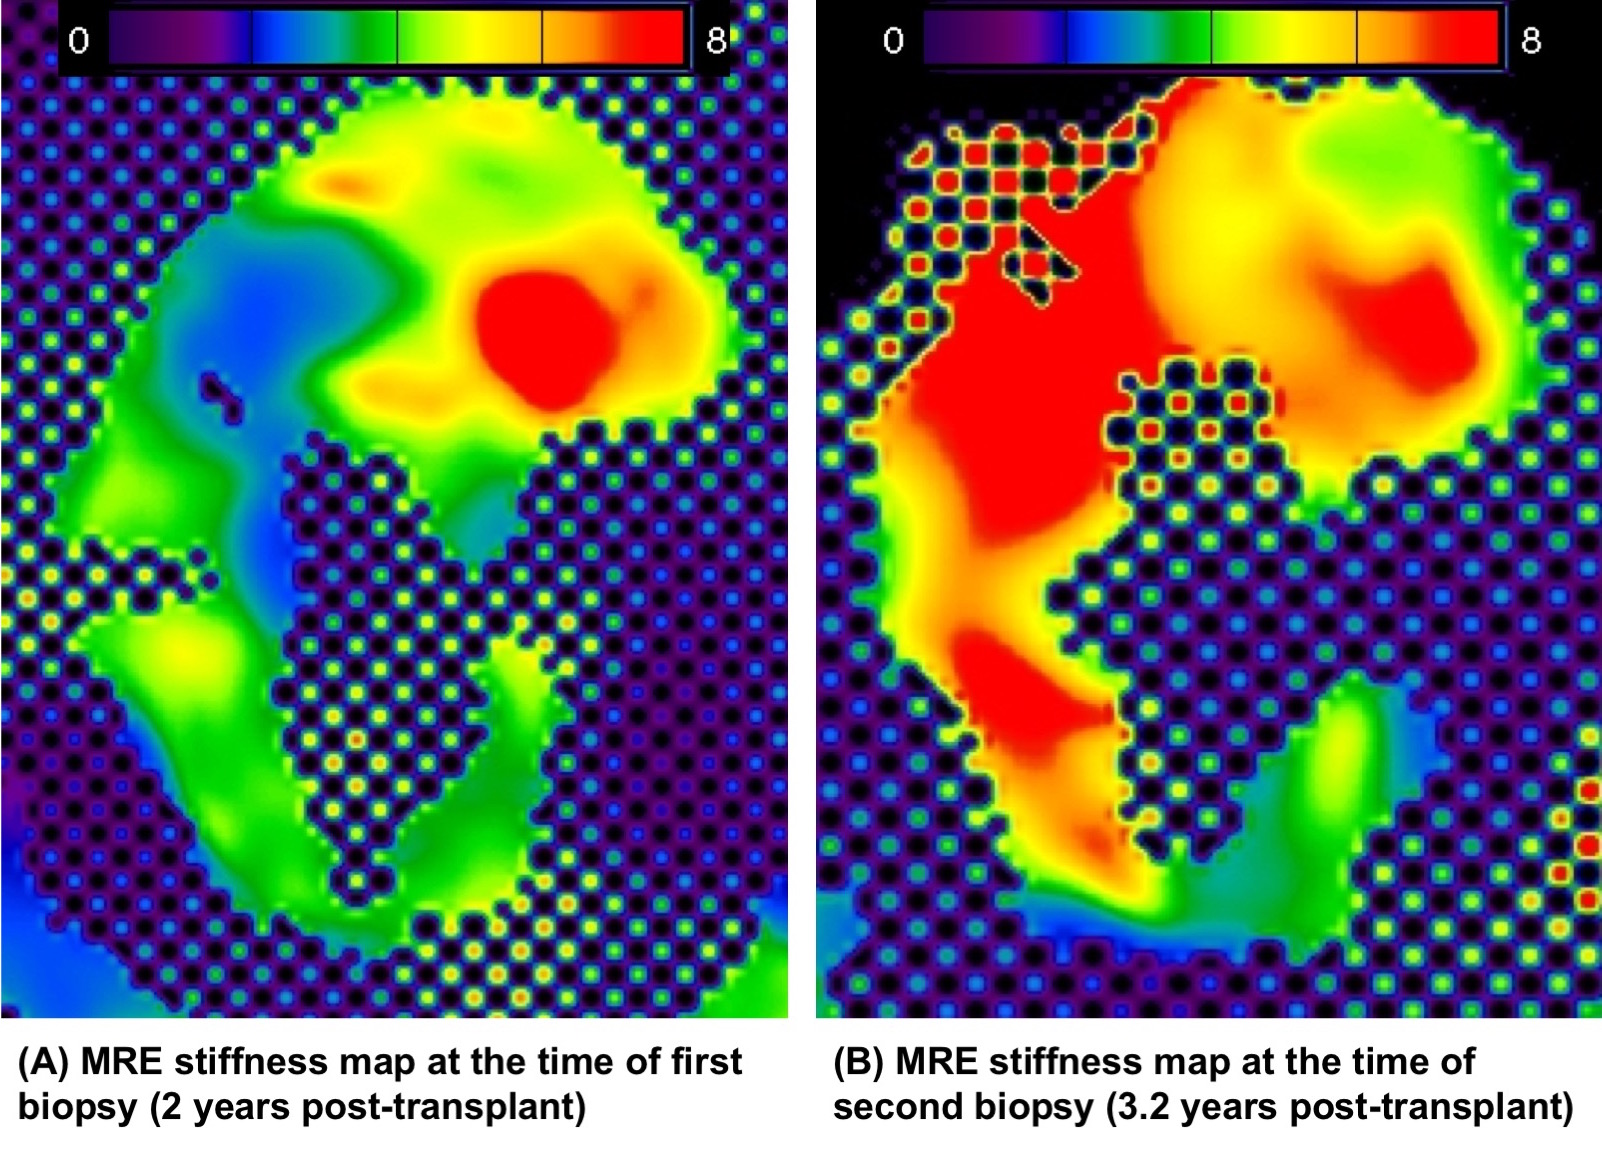
The first biopsy and MRE (2-years post-transplant) was during a period of stable and relatively normal allograft function, while the second biopsy and MRE (3.2 years post-transplant) were performed in the setting of significant renal dysfunction (Figure 1, Figure 2).
At 2-years post-transplant, the biopsy demonstrated only mild (ci1) fibrosis and the MRE-derived whole kidney stiffness score was 4.878 kPa.
At 3.2-years post-transplant, when a biopsy was ordered by the renal transplant team for declining eGFR and increased albuminuria, it showed an increase in fibrotic burden (ci2). At this time, MRE-derived whole kidney stiffness was similarly increased at 6.593 kPa.
Discussion
While elastography has been performed previously in both native and transplant kidneys7-9, to our knowledge, this is the first report of serial biopsy and MRE, enabling simultaneous documentation of stiffness and fibrosis progression over time. The histological change from mild to moderate fibrosis between the two time points and similarly increased MRE-derived whole kidney stiffness demonstrate that the whole kidney MRE appears to be sensitive to the progression of fibrosis in the same patient as measured by biopsy, the only current method available for fibrosis assessment. This is consistent with findings of other earlier case-control studies.8,10
Although other factors such as hydrostatic pressure due to microvascular perfusion and urinary flow can also affect renal stiffness7,12, we directly evaluated the impact of fibrosis on stiffness by comparing MRE-derived stiffness to biopsy assessment. Therefore, while preliminary, this observation suggests that renal allograft MRE can detect changes in overall allograft fibrotic burden.
The current reference standard is a percutaneous biopsy which is both invasive and limited by possible sampling bias. MRE may be a non-invasive alternative to detect fibrotic progression while accounting for the heterogeneous distribution of fibrosis, a feature that can readily be seen from MRE.
Conclusion
This is the first time that a change has been observed in renal allograft MRE-derived whole
kidney stiffness values that is consistent with changes in fibrosis scores from
renal biopsy and other clinical measurements of graft function in the same
patient over time. While biopsy will never be replaced as a key diagnostic
procedure, our preliminary finding raises a possibility of using MRE as a
supplementary tool for the measurement of whole kidney scar burden and its
progression over time, without the need for repeated biopsies. Given the
importance of fibrosis as a marker of irreversible injury, such knowledge might
inform decisions regarding the utility and administering toxic therapies for
reversible inflammation seen on a concomitantly obtained biopsy.Acknowledgements
This work was supported by a Collaborative Health Research Project Grant from the Canadian Institutes of Health Research and the National Sciences and Engineering Research Council of Canada, as well as grants from the Physicians’ Services Incorporated Foundation, Astellas Pharma Canada (SG-185) and from the St. Michael’s Hospital Foundation. The authors wish to thank technologists Anthony Sheen and Cindy Hamid for performing the research MRI scans, and research staff Lindita Rapi, Michelle Nash and Shalini Anthwal for assistance in ethics board approvals, patient recruitment, data collection, and study coordination. The authors also wish to thank Drs. Andrew Common, Danny Marcuzzi and Vikram Prabhudesai for performing all allograft biopsies. Dr. Darren Yuen is supported by a KRESCENT New Investigator and Canadian Diabetes Association Clinician Scientist salary support award, and is also a recipient of a CIHR New Investigator awardReferences
1. Djamali A, Samaniego M. Fibrogenesis in kidney transplantation: potential targets for prevention and therapy. Transplantation 2009;88(10):1149-1156.
2. Naesens M, Kuypers DR, De Vusser K, Evenepoel P, Claes K, Bammens B et al. The histology of kidney transplant failure: a long-term follow-up study. Transplantation 2014;98(4):427-435.
3. Corapi KM, Chen JL, Balk EM, Gordon CE. Bleeding complications of native kidney biopsy: a systematic review and meta-analysis. American journal of kidney diseases : the official journal of the National Kidney Foundation 2012;60(1):62-73.
4. Naesens M, Kuypers DR, De Vusser K, Vanrenterghem Y, Evenepoel P, Claes K et al. Chronic histological damage in early indication biopsies is an independent risk factor for late renal allograft failure. American journal of transplantation : official journal of the American Society of Transplantation and the American Society of Transplant Surgeons 2013;13(1):86-99.
5. Seron D, Moreso F. Protocol biopsies in renal transplantation: prognostic value of structural monitoring. Kidney Int 2007;72(6):690-697.
6. Rouviere O, Yin M, Dresner MA, Rossman PJ, Burgart LJ, Fidler JL et al. MR elastography of the liver: preliminary results. Radiology 2006;240(2):440-448.
7. Venkatesh SK, Ehman RL. Magnetic resonance elastography of abdomen. Abdominal imaging 2015;40(4):745-759.
8. Rouviere O, Souchon R, Pagnoux G, Menager JM, Chapelon JY. Magnetic resonance elastography of the kidneys: feasibility and reproducibility in young healthy adults. J Magn Reson Imaging 2011;34(4):880-886.
9. Lee CU, Glockner JF, Glaser KJ, Yin M, Chen J, Kawashima A et al. MR elastography in renal transplant patients and correlation with renal allograft biopsy: a feasibility study. Acad Radiol 2012;19(7):834-841.
10. Marticorena Garcia SR, Fischer T, Dürr M, Gültekin E, Braun J, Sack I et al. Multifrequency Magnetic Resonance Elastography for the Assessment of Renal Allograft Function. Investigative Radiology 2016;Publish Ahead of Print:1.
11. Jiang N, Leung G, Jothy S, Yuen DA, Kirpalani A. Assessment of renal allograft fibrosis with magnetic resonance elastography in kidney transplantation patients. In. International Society for Magnetic Resonance in Medicine Scientific Meeting. Toronto, Canada, 2015.
12. Korsmo MJ, Ebrahimi B, Eirin A, Woollard JR, Krier JD, Crane JA et al. Magnetic resonance elastography noninvasively detects in vivo renal medullary fibrosis secondary to swine renal artery stenosis. Invest Radiol 2013;48(2):61-68.
Figures