1135
Assessing tumor mechanical nonlinearity by MR elastography at different strain levels1'Laboratory of Imaging Biomarkers CRI UMR1149, INSERM, Paris, France, 2Sanofi oncology, Vitry-sur-Seine, France, 3Imaging Sciences and Biomedical Engineering, King's College London, London, United Kingdom
Synopsis
In this study we attempt to access nonlinear mechanical properties of tumors by applying external loads. Experiments were performed on subcutaneous tumors implanted in mice. MR elastography acquisitions were realized at 600 Hz while deformations were applied, in order to obtain apparent elasticity (G’) values for each strain application. Results showed nonlinear G’ values increasing with loads, when deformations were clearly observed. Some results showed a decrease of G' potentially due to wave displacement polarization. We showed the feasibility of assessing the nonlinear regime of tumor mechanical properties that may potentially be an indicator of internal tumor forces.
Introduction
MR elastography (MRE) can reliably be used to assess mechanical properties of tumors in small animal models [1-4]. In this proof of concept study, we propose to interrogate tumor mechanical properties in the nonlinear regime of static strain. Towards this objective, tumor mechanical properties are measured while applying a deformation to the tumor at several strain levels.Materials and Methods
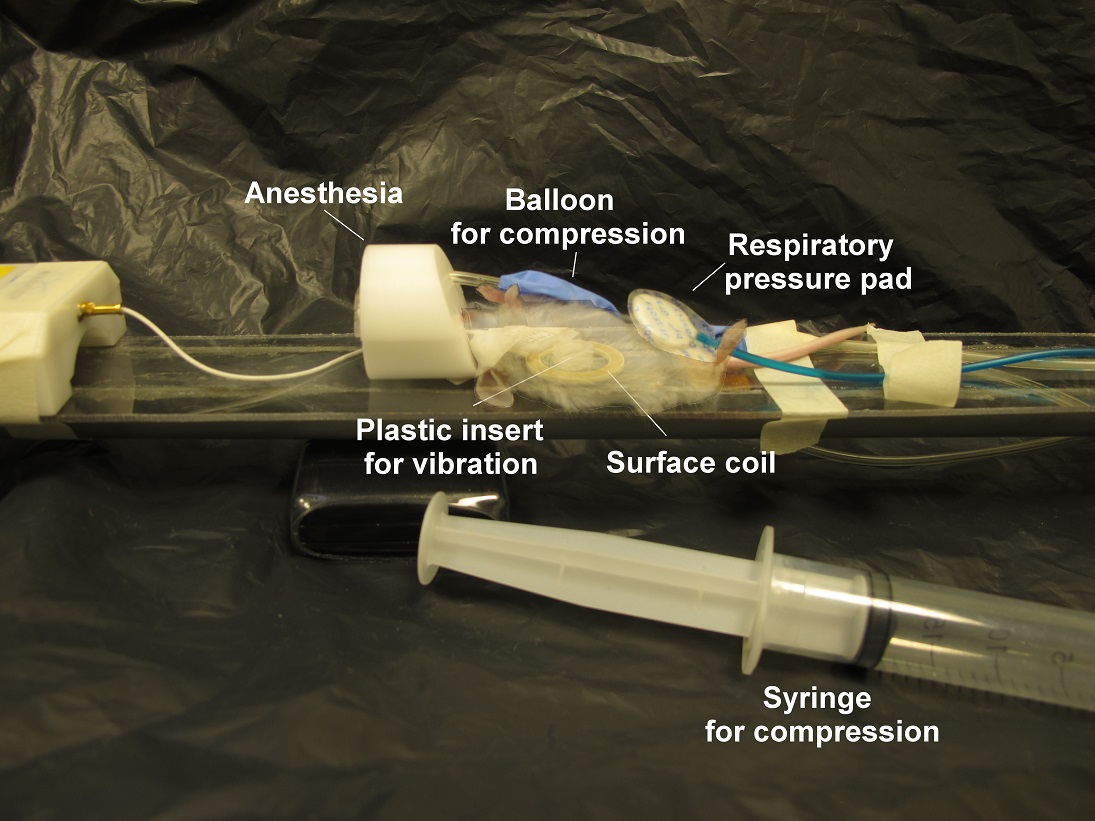
Experiments were performed on subcutaneous tumors (patient-derived hepatocellular carcinoma xenografts, SA-LIV-0265, Sanofi) implanted in left flank of SCID mice (n=10, Sanofi Oncology, Vitry-Sur-Seine, France), in a 7T MRI scanner (PharmaScan, Bruker, Germany). Mice were anesthetized with isoflurane and maintained at 37°C while their respiration rate was monitored by a pressure pad. Animals were positioned such that their tumors were in direct contact with a plastic insert matching the tumor curvatures, placed inside the opening of a planar circular surface coil (Fig 1). Mechanical vibrations were generated by an electromagnetic shaker and transmitted to the tumor via a flexible carbon fiber rod linked to the plastic insert [5]. A balloon was placed on the abdomen in order to apply a load to the tumor by inflating the balloon. Mouse breathing was carefully monitored during the inflation procedure by watching for signs of distress in the respiration signal. MRE acquisitions were performed at basal strain state, and from one to three increasing strain levels. Mechanical excitation was performed at 600 Hz and synchronized with a sinusoidal motion-encoded spin-echo sequence. MRE acquisition parameters were: matrix=87×67×9, resolution=0.30×0.30×0.35 mm3, TR/TE=1007/18 ms and scan time of 4 min 30 s for each of the three acquired spatial direction, including 4 time steps. Motion encoding was carried out at the mechanical excitation frequency for 2 periods and a maximum amplitude of 300 mT.m-1. Maps of viscoelastic moduli, G′ and G′′, were obtained by inversion of the Helmoltz wave equation [6]. In addition to MRE acquisitions, for each strain level, an anatomical scan was acquired (sequence: ultra-fast-SE, matrix=150×150×40, resolution=0.2×0.2×0.5 mm3, TR/TE=9000/60 ms).Results
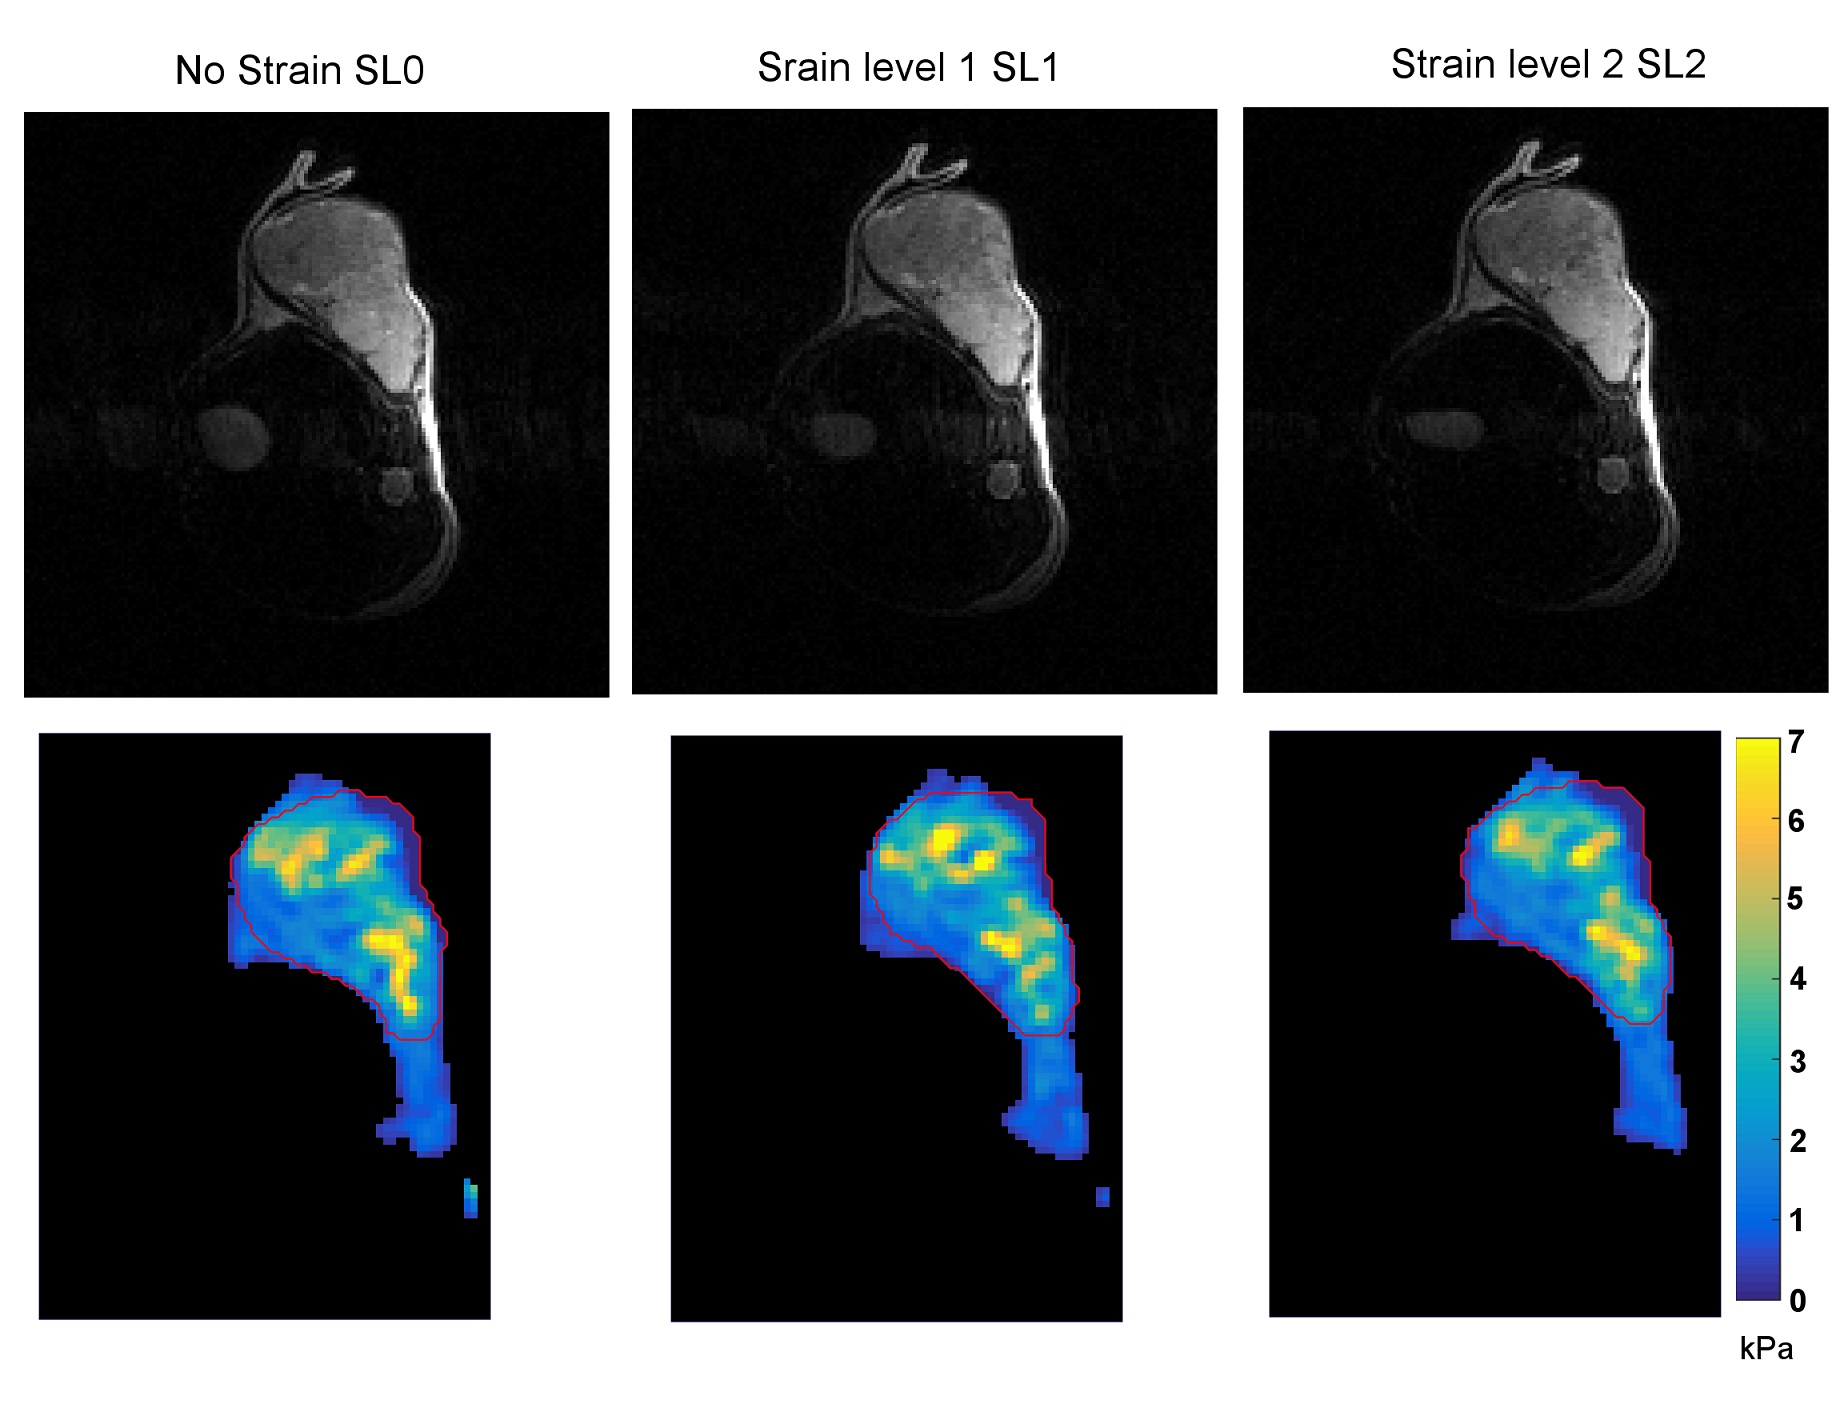
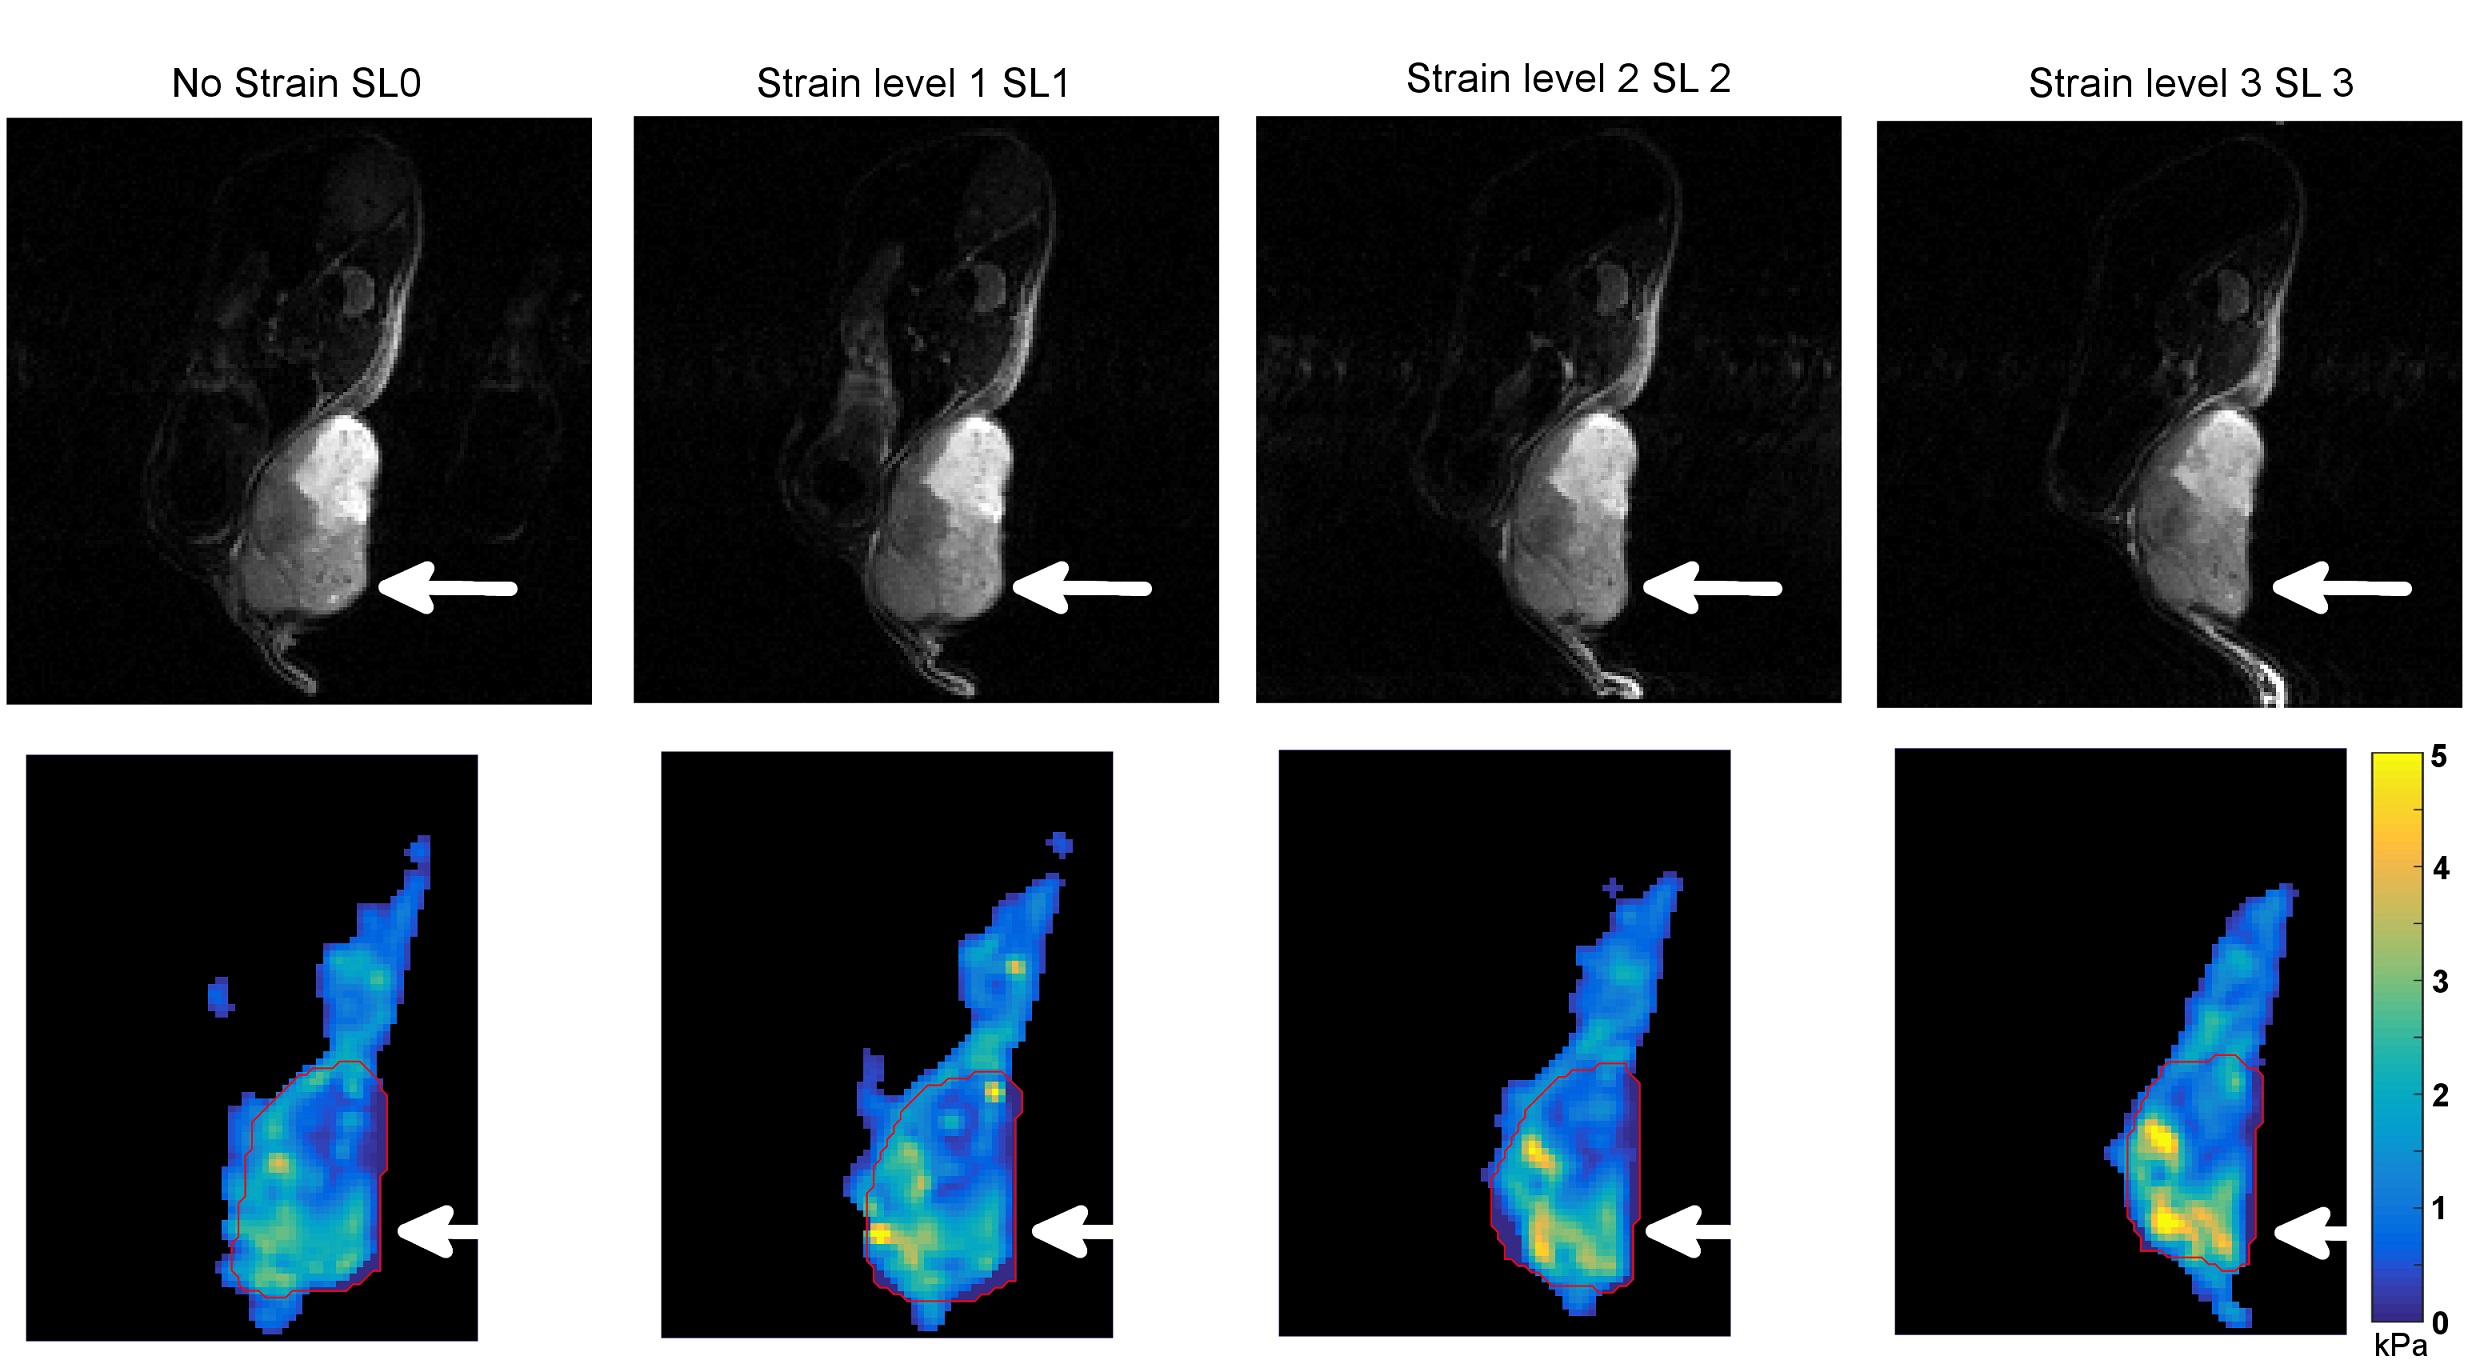
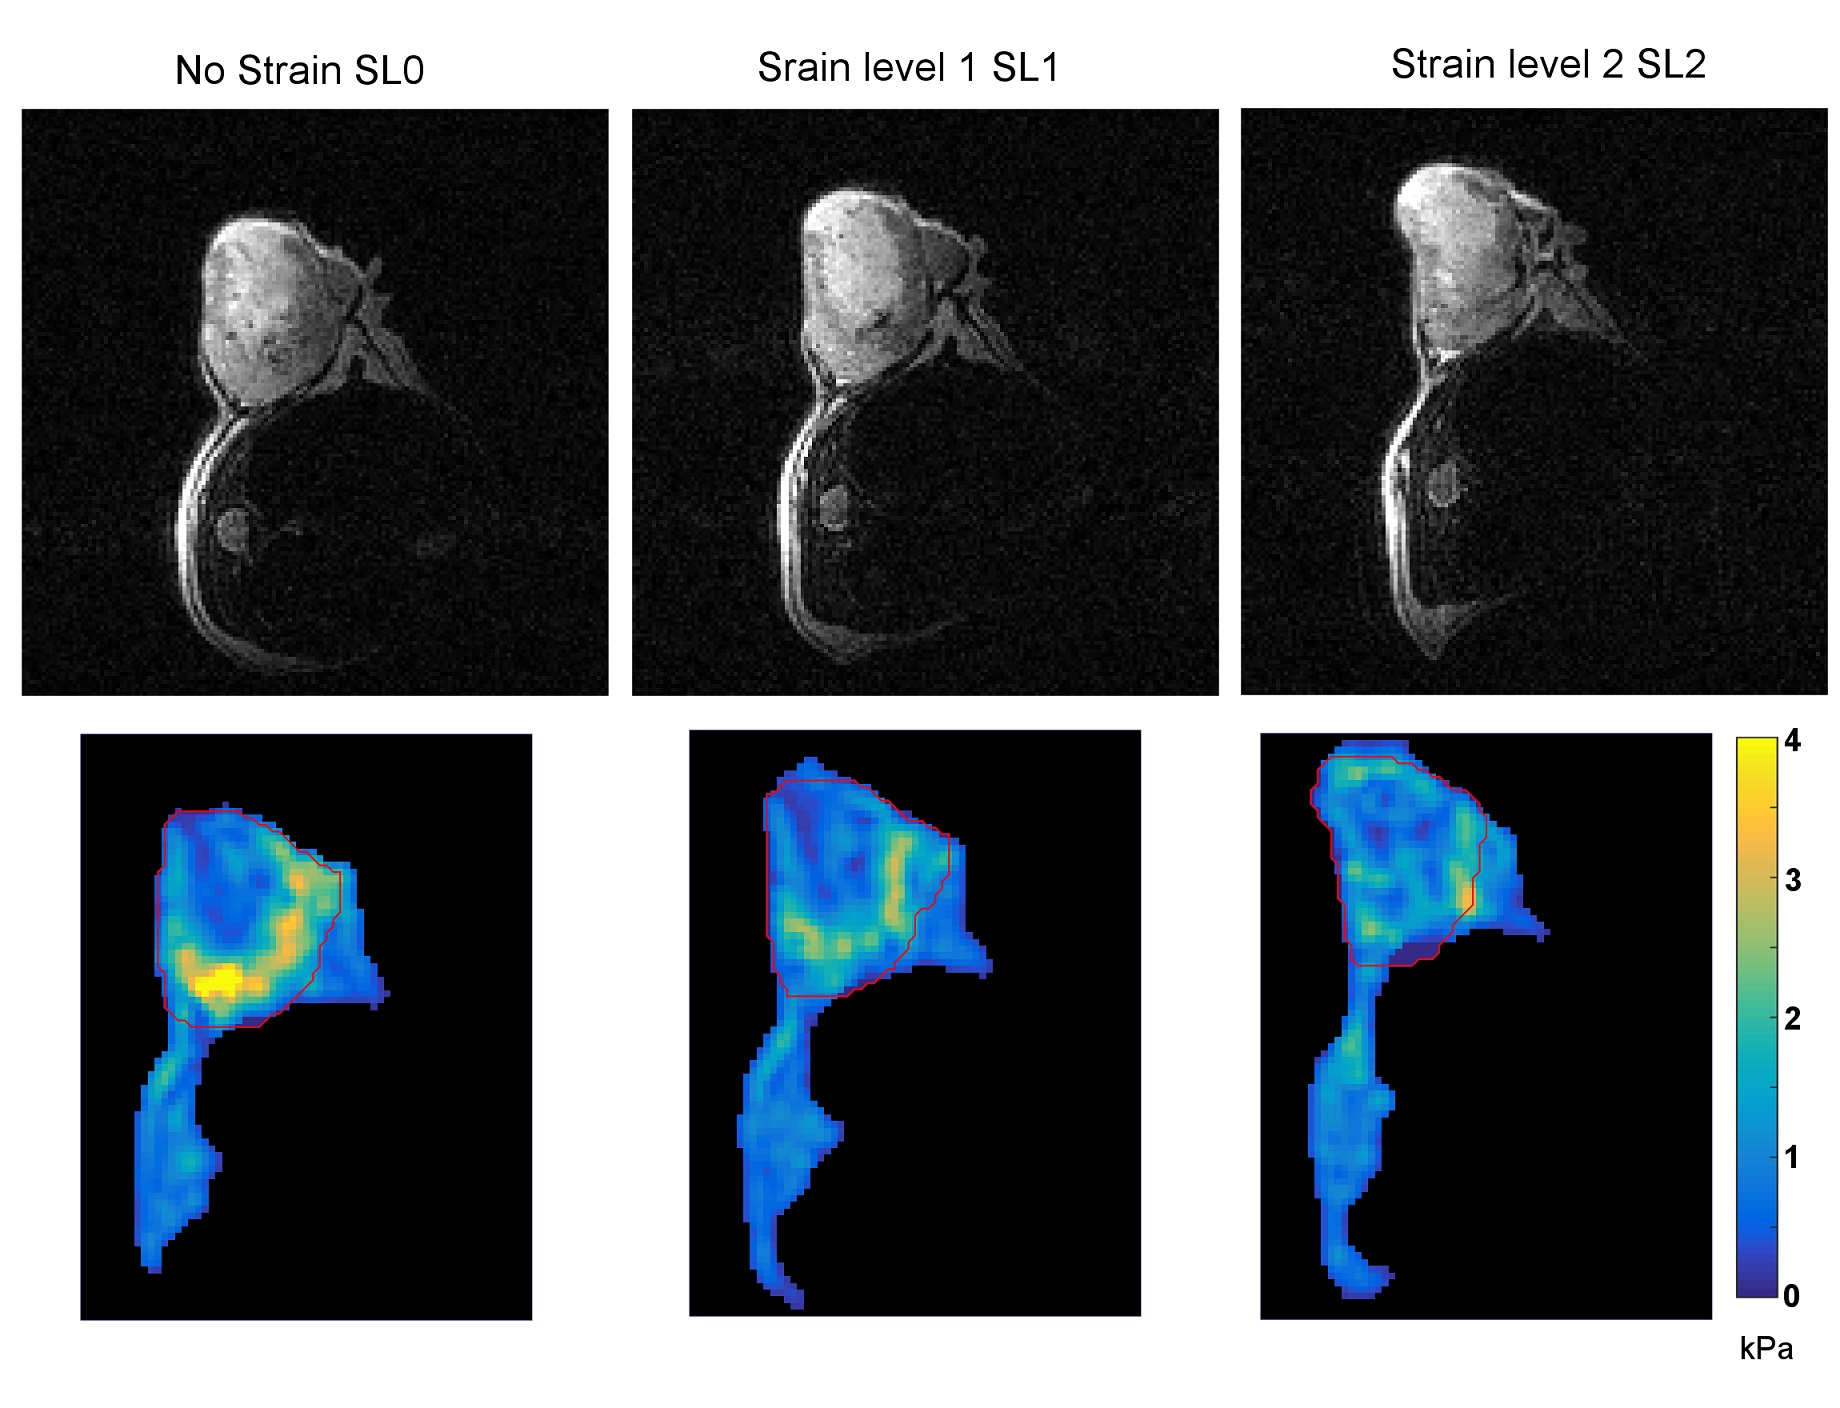
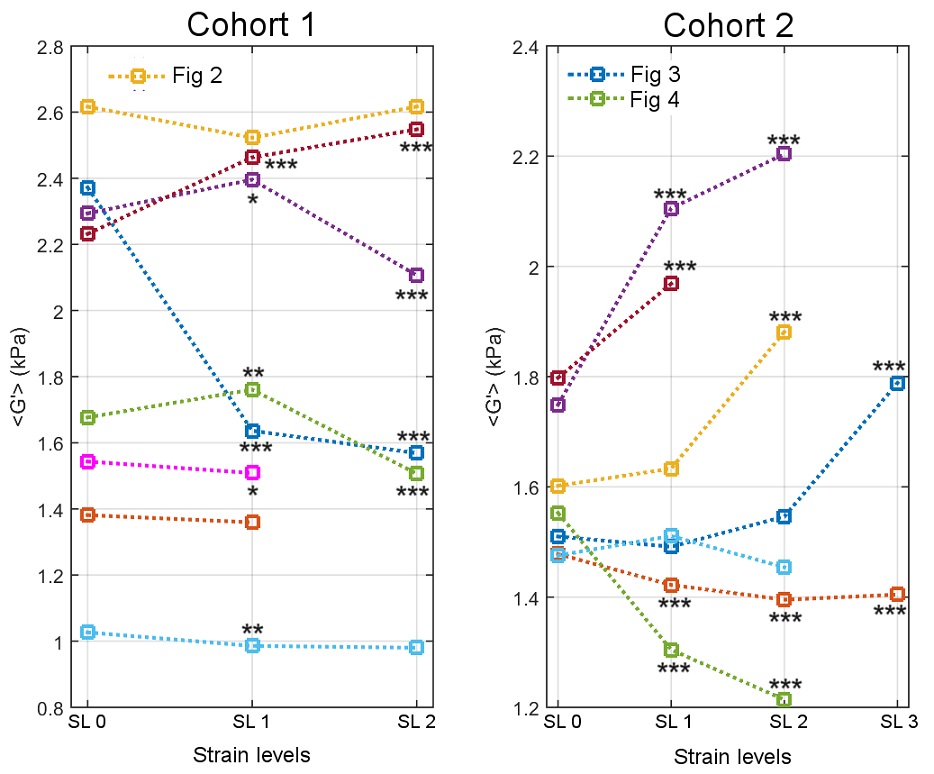
Figures 2, 3 and 4 show G′ maps overlaid on anatomical images, at several acquired strain levels for three different mice. Mean values of G′ measured on the whole tumor for these mice are plotted on Fig 5, for each strain level, as well as G' measured from 12 other acquisitions (a total of 10 mice with five were acquired twice at different days). These plots show apparent elasticity evolution with increasing strain. For five of the 15 experiments, apparent elasticity increases with applied load as expected [7]. Increases of up to 0.45 kPa (26%) were achieved, and in these five cases, G' values increased of 0.30 kPa (17%) on average. Some G′ values did not follow this trend however, such as on Fig 2. This figure shows that the tumor is not deformed as desired but displaced. On Fig 3, a G′ value that increases non linearly with external load is presented. In this particular case, the anatomical reference scan demonstrates an important deformation that is only present in a specific region of the tumor (white arrow). As a result, parametric maps show that where the tumor is the most deformed, stiffness is increasing the most (bottom of the tumor). Finally, Fig 4 shows, on the contrary, that stiffness may also decrease despite efficient tumor deformation.Discussion and conclusion
This work shows the feasibility of measuring mechanical properties of mouse xenografts under external load. Maximum values of G′, on Fig 3, matching with the largest tumor deformation, highlights the importance of mechanical heterogeneity of tumors, as tumor regions that were the least deformed showed mostly liquid necrosis on anatomical scans. Hence in future iterations of this work, the local stiffness increases will be correlated to local deformation. For Fig 4, where stiffness decreases with increasing strain, this could be due to the isotropic reconstruction that does not take into account the displacement field wave polarization. Indeed, according to polarization, waves may propagate through a softer effective medium (elongated portion of the strained tumor) or stiffer effective medium (narrowed portion). This polarization will be taken into account by performing anisotropic reconstruction. Tumoral internal forces such as interstitial fluid pressure (IFP) may be involved in tumor mechanical properties. IFP is an indicator of the biodistribution of therapeutic agents and of the tumor metastatic potential [8-9], hence the tumor mechanical parameters response during applied external loads may potentially be influenced by IFP. To conclude, in this work we show the initial feasibility of measuring mechanical properties in a mouse model of liver cancer undergoing deformation to assess the non-linear elastic regime.Acknowledgements
No acknowledgement found.References
[1] Jamin Y et al. Cancer Res 2015;75(7):1216-24
[2] Jamin Y et al. British Journal of Cancer 2014;110:1727-1732
[3] Zhao XG et al. In Proceedings of the 2002 IEEE Engineering in Medicine and Biology Society Conference 2007;2050–2052 (IEEE, New York)
[4] Jugé L et al. Radiology 2012;264:436–444
[5] Ronot M et al. Plos One 2014; 9(4):e94679
[6] Sinkus R et al. Magn Reson Imaging 2005; 23:159-165
[7] Payan Y et al. in Studies in mechanobiology, Tissue engineering and biomaterials (Springer, Berlin ; New York, 2012)
[8] Stylianopoulos T et al. PNAS 2013;110(46) 18632-7
[9] Heldin CH et al. Nat Rev Cancer 2004; 4:806-813
Figures