1133
Towards single-shot 3D MR elastography: Application to intrinsically activated motion fields in the human brain.1Department of Medical Informatics, Charité - Universitätsmedizin Berlin, Berlin, Germany, 2German Center for Neurodegenerative Diseases (DZNE), Bonn, Germany, 3Department of Physics and Astronomy, University of Bonn, Germany, 4Department of Radiology, Charité - Universitätsmedizin Berlin, Berlin, Germany
Synopsis
This study introduces a single-shot 3D EPI sequence for rapid motion field acquisition. The method can be applied for MRE under pulsatile motion or for directly analyzing intrinsic motion fields in pulsatile organs such as the brain. Through 3D k-space sampling, inter-slice phase offset artifacts, which essentially result from 2D k-space MRE, are most effectively avoided. In a first application we used the new method for the measurement of intrinsic brain pulsation in the human brain and analyzed the intensity of deflection field components by stochastic sampling at rest and during Valsalva maneuver.
Introduction
Intrinsic pulsation of the brain at the cardiac pulse frequency has
previously been used as the motion source for magnetic resonance
elastography (MRE) of the brain1,2. However, data acquired with a
2D sequence suffer from inter-slice phase offsets (ISPOs) that occur
when adjacent slices are acquired during different cardiac phases2. ISPOs hamper the calculation of through-plane derivatives, which
are required for inversion of the 3D wave equation. Common solutions
include physiological triggering (leading to excessively long scan
times), or only using the in-plane derivatives of the displacement
field, which precludes a number of established MRE data analysis
strategies, such as calculating the displacement field divergence2
(volumetric strain).
Methods
As a novel approach to overcome ISPOs we developed a 3D single-shot spin-echo EPI3,4 sequence based on the gradient-echo sequence described in reference [5]. The sequence was equipped with a pair of bipolar motion-encoding gradients between the excitation and the inversion pulse to encode tissue motion in the phase of the acquired MR signal. A protocol was set up to acquire a 48×48×8 matrix with an isotropic resolution of 4 mm along a Cartesian trajectory within 239 ms. The flip angle was optimized based on the spin-echo Ernst angle for this TR and a T1 of 1700 ms. A set of 300 volumes, corresponding to 100 time steps for each of three orthogonal motion-encoding directions, were acquired on a clinical 3T MR scanner (Siemens Magnetom Trio, Erlangen, Germany) to sample intrinsic brain pulsation with a temporal resolution of 239 ms, thus spanning an observation interval of 24 seconds per encoding direction. Of these 100 time steps, the first 30 steps were discarded to allow for build-up of transverse steady-state magnetization. The following sequence parameters were used: echo time: 125 ms; GRAPPA factor: 2 (in-plane); motion-encoding gradient: bipolar trapezoidal waveform with a duration of 28 ms per lobe and an amplitude of 25 mT/m. A group of 7 male healthy volunteers (age range: 26-56 years, mean age: 36 years) was examined using this technique. Two scans were performed on each subject, first a baseline under relaxed and calm breathing, followed by an identical scan in which the volunteer was asked to perform the Valsalva maneuver (forced expiration against the closed glottis) to increase intracranial pressure.
Data processing: The acquired motion-encoded complex phase images were first smoothed using a Gaussian kernel (width: 11 voxels, stdev: 1.2 voxels) and then interpolated to a resolution of 2×2×4 mm3 using cubic interpolation to improve the conditioning of the subsequent 2D Laplacian phase unwrapping step6. The unwrapped time series were subjected to temporal Fourier transform to obtain a frequency-resolved spectrum of time-harmonic oscillation amplitudes that constitute cardiac pulsation. Because of the low SNR of the measurements, deflection amplitudes were averaged over the brain parenchyma.
Results
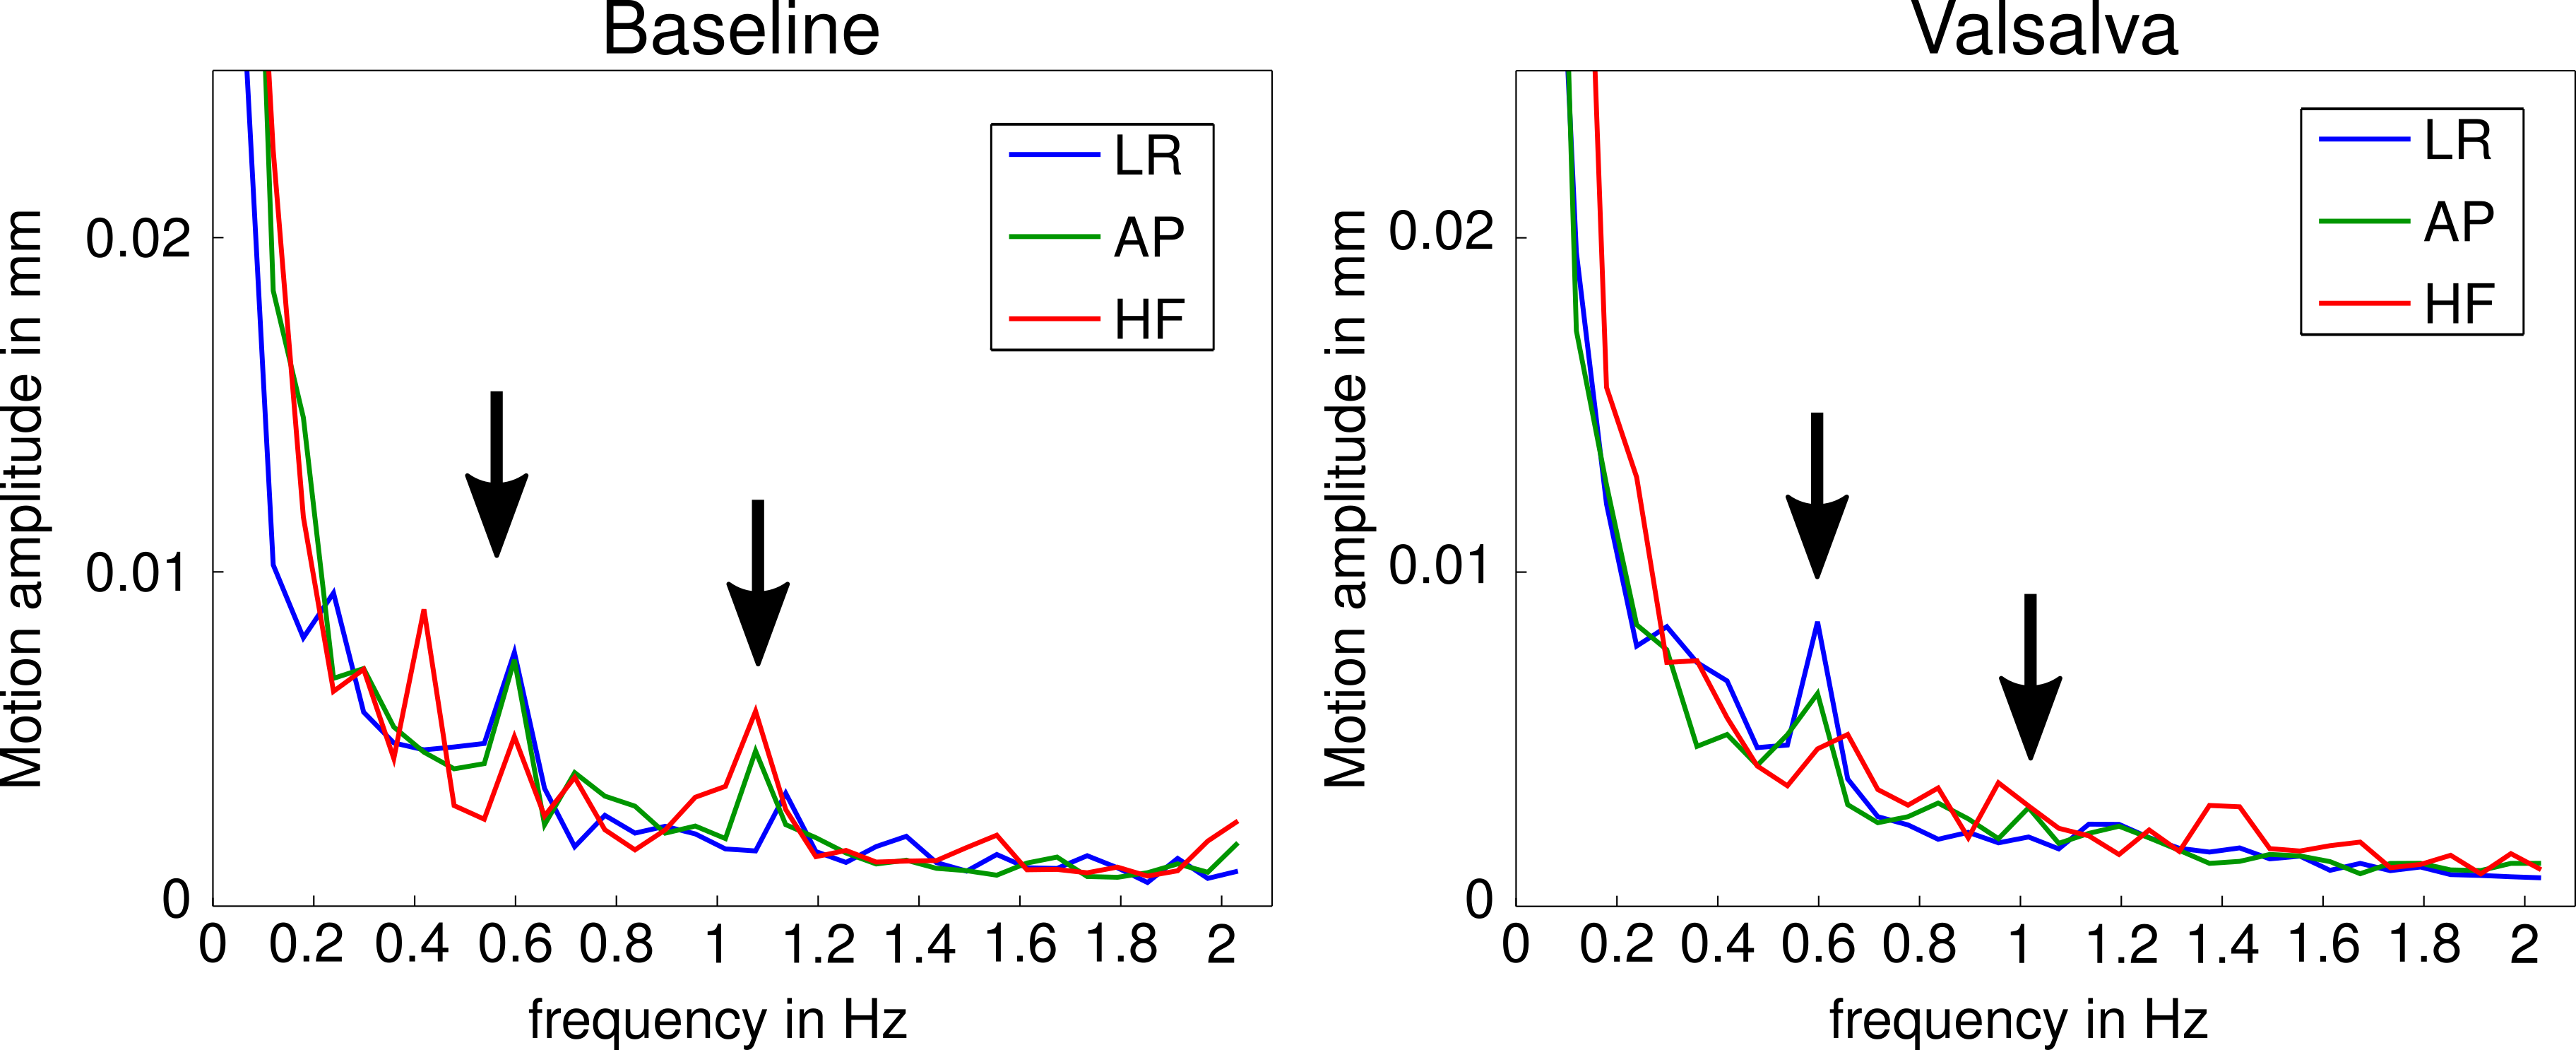
The spectra of scans under normal conditions and Valsalva are shown in Fig. 1. In the frequency spectra of the baseline scans, all seven volunteers presented a significant peak around a frequency of 0.5 Hz, which is much lower than the actual cardiac pulse rate (~1 Hz, 60 bpm). A second peak at the pulse rate was present in all subjects. This pulse-rate intensity peak was weaker than the low frequency (0.5 Hz) peak in 5 volunteers and of comparable intensity in 2 subjects. Under Valsalva maneuver, the 1-Hz peak was strongly attenuated down to noise level in all subjects, whereas the 0.5-Hz peak was still perceptible in 4 subjects.Discussion
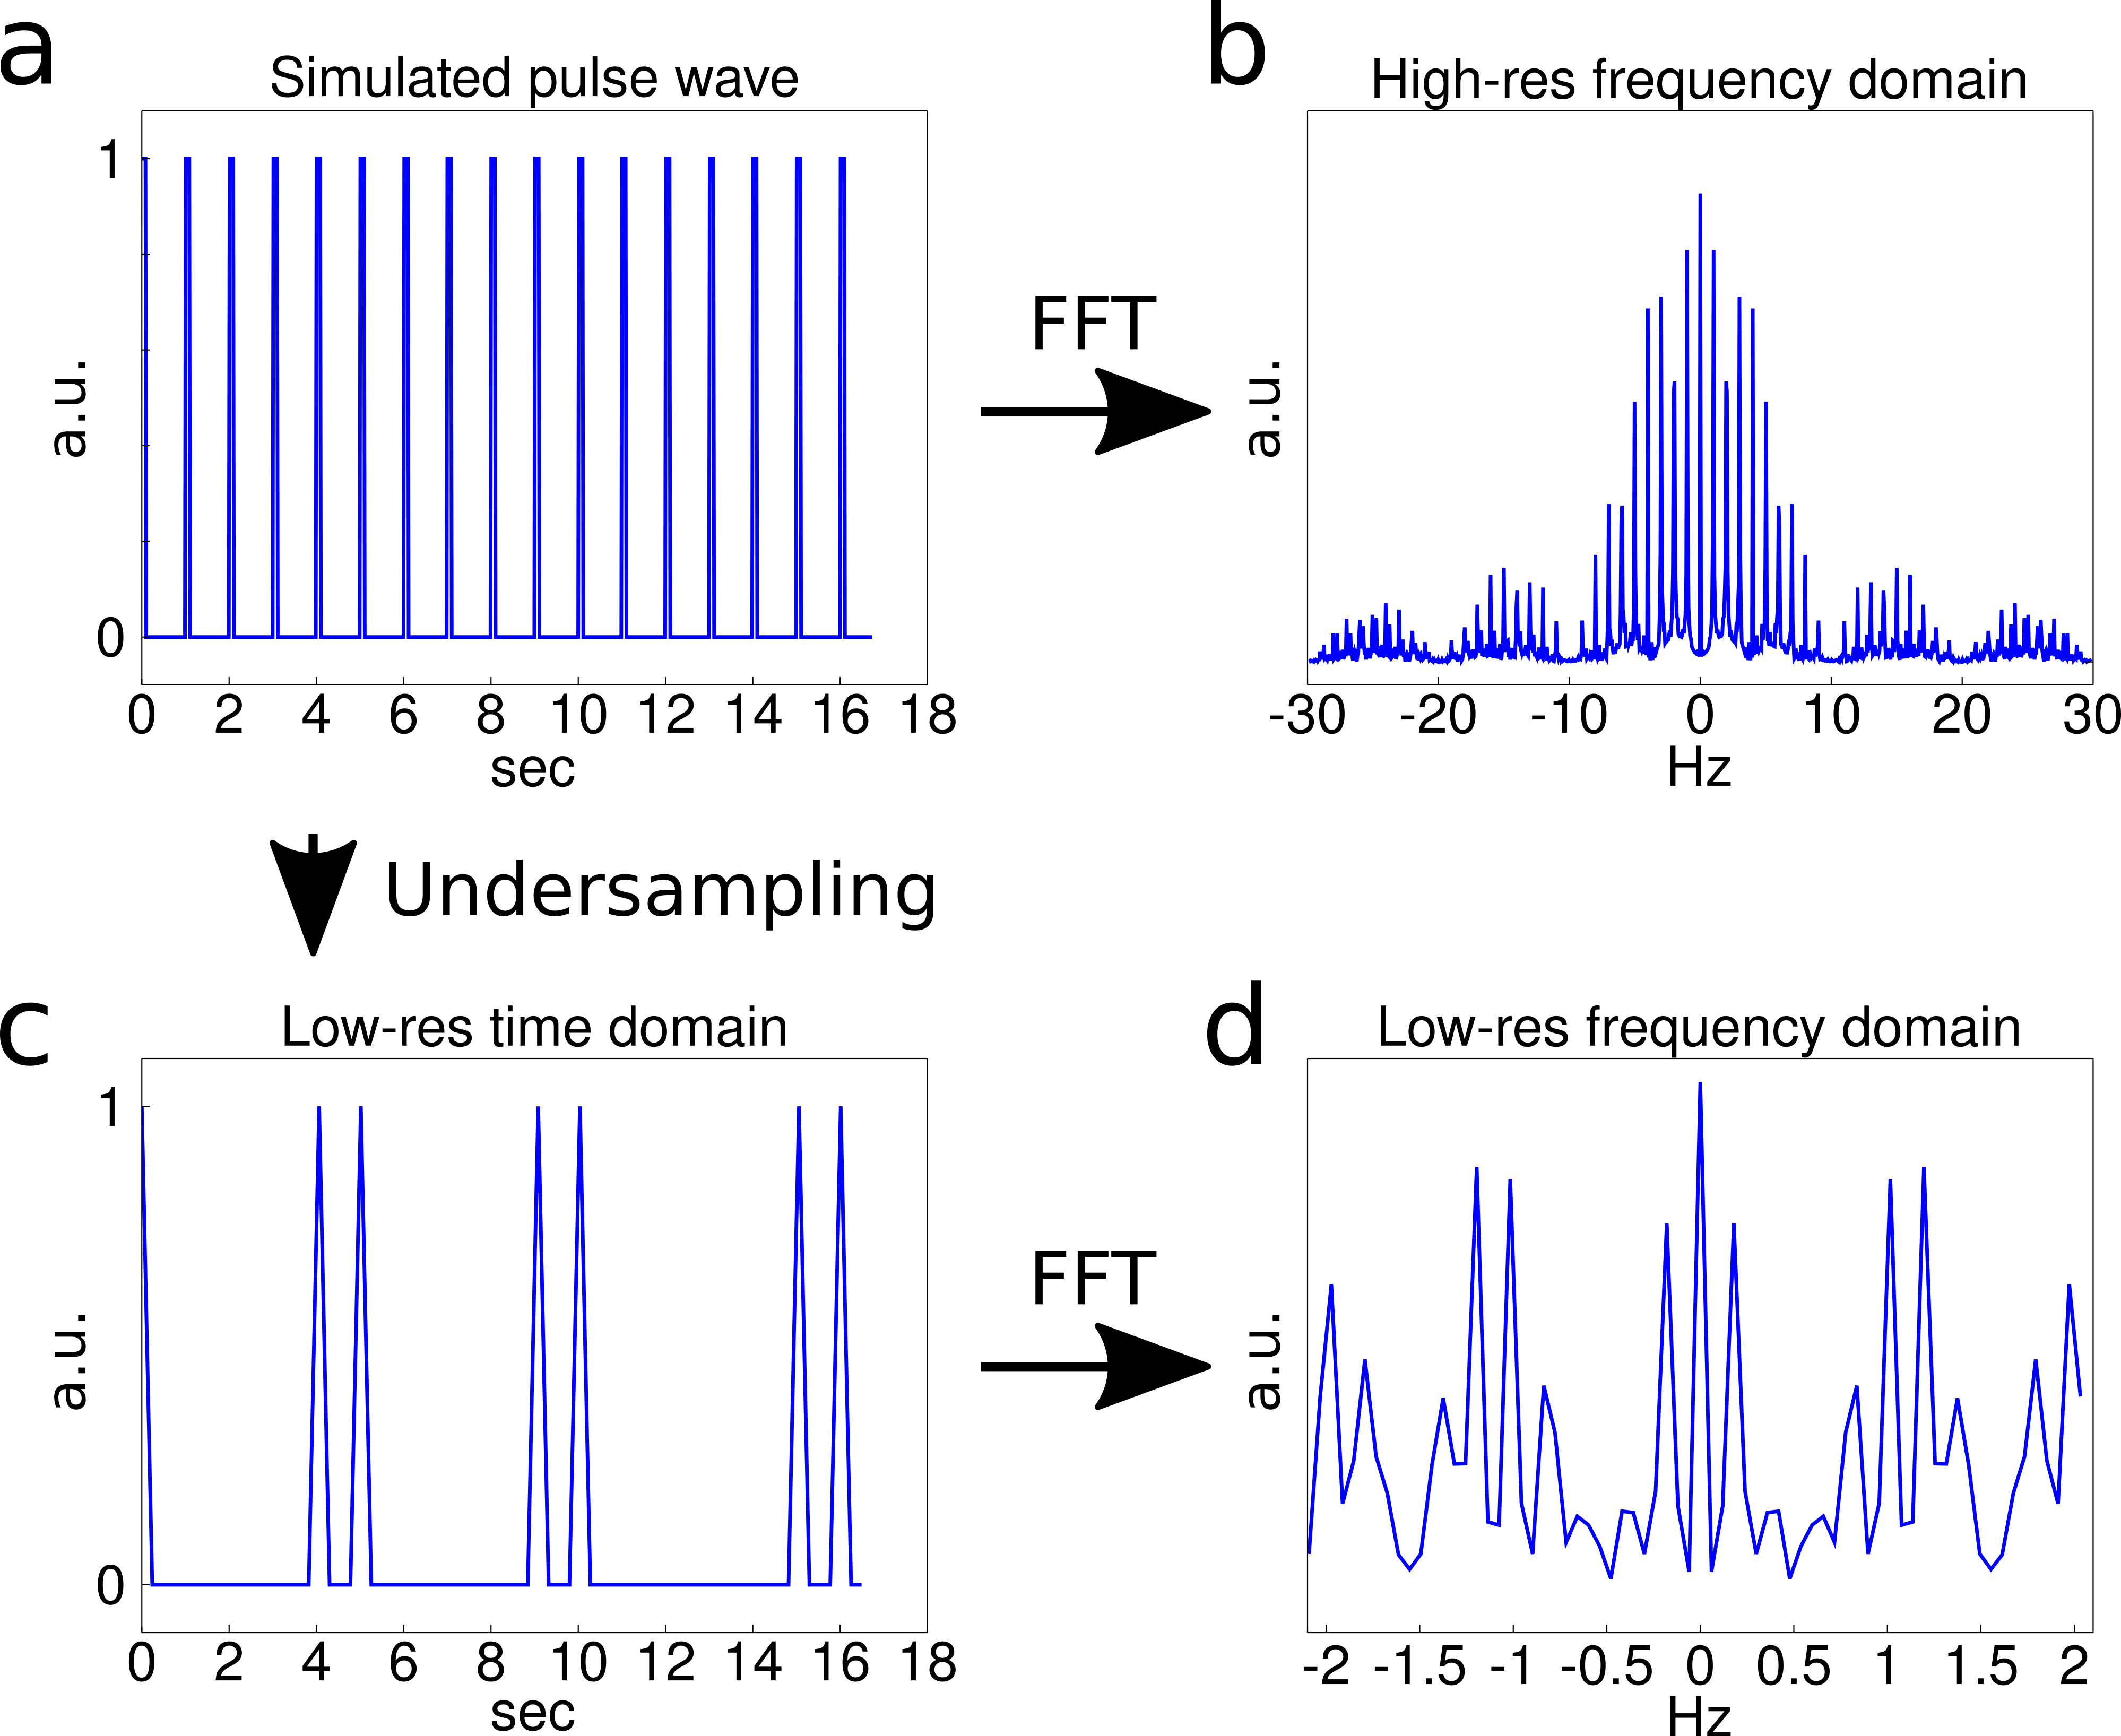
To understand the presence of the 0.5-Hz peak, the sampling of an idealized cardiac signal with an unmatched sampling rate was simulated, as shown in Fig. 2. From the simulation it becomes clear that such peaks can appear as a consequence of non-harmonic periodic motion and bandwidth limitations, leading to an amplification of the sidebands in the spectrum. The broadening of the frequency spectrum under the Valsalva paradigm is attributed to both the modulation of the heart rate during the maneuver and changes in the deflection amplitude of the arterial pulse wave7. In summary, we introduced a single-shot 3D EPI sequence for rapid motion field acquisition and demonstrated its capability of detecting pulsatile motion in the in vivo brain. ISPO artifacts that are present in 2D k-space acquisitions were effectively avoided. Current developments focus on SNR improvement by further TE reduction as well as physiological triggering to reconstruct unbiased motion pattern spectra with the goal of acquiring time-resolved spatial maps of cerebral pulsation amplitudes, which could be used to analyze poroelastic properties of the brain in the low-frequency domain.Acknowledgements
No acknowledgement found.References
1. Weaver, J. B. et al. (2012). Brain mechanical property measurement using MRE with intrinsic activation. Physics in Medicine and Biology, 57(22), 7275–87.
2. Hirsch, S. et al. (2013). In vivo measurement of volumetric strain in the human brain induced by arterial pulsation and harmonic waves. Magnetic Resonance in Medicine, 70(3), 671–83.
3. Mansfield, P. (1977). Multi-planar image formation using NMR spin echoes. Journal of Physics C: Solid State Physics, 10(3), L55–L58.
4. Harvey, P. R., & Mansfield, P. (1996). Echo-volumar imaging (EVI) at 0.5 T: First whole-body volunteer studies. Magnetic Resonance in Medicine, 35(1), 80–88.
5. Stirnberg, R., & Stöcker, T. (2014). Conventional 2D-EPI or Segmented 3D-EPI? A Temporal SNR Study at 3 and 7 Tesla. In Proceedings of the 22nd Annual Meeting of ISMRM, Milan (p. 868).
6. Schofield, M. A., & Zhu, Y. (2003). Fast phase unwrapping algorithm for interferometric applications. Optics Letters, 28(14), 1194–6.
7. Elisberg, E. I. (1963). Heart Rate Response to the Valsalva Maneuver as a Test of Circulatory Integrity. JAMA, 186, 200–5.
Figures