1120
Irradiated Brain Parenchyma Promotes Virulent Proliferation of Naive Glioma Cells: Mouse Model of Recurrent Glioblastoma1Chemistry, Washington University in St. Louis, St. Louis, MO, United States, 2Radiology, Washington University in St. Louis, St. Louis, MO, United States, 3Radiology, Guangzhou First People's Hospital, Guangzhou, People's Republic of China, 4Neurosurgery, Washington University in St. Louis, St. Louis, MO, United States, 5Pathology and Immunology, Washington University in St. Louis, St. Louis, MO, United States, 6Radiation Oncology, Washington University in St. Louis, St. Louis, MO, United States, 7Alvin J Siteman Cancer Center, Washington University in St. Louis
Synopsis
For many years, research on recurrent glioblastoma has largely focused on therapy-induced cancer-cell changes. Herein, we show that gliomas resulting from naïve, non-irradiated DBT tumor cells implanted into irradiated mouse brains grow more rapidly than tumors resulting from naïve DBT cells implanted into non-irradiated mouse brains. Likewise, survival post-implantation is reduced, and MRI and histology document striking differences between naïve tumors implanted in irradiated vs. non-irradiated brain. Collectively, these data provide new insights into the enhanced invasiveness of recurrent gliomas and, importantly, demonstrate a novel recurrent glioblastoma model for further investigation of the long-term effects of radiotherapy on tumor microenvironment.
Introduction
Despite state-of-the-art radiotherapy, Glioblastoma (GBM) invariably recurs near the margins of the targeted irradiation field. For many years, research on glioma and its recurrence has focused largely on radiation therapy-induced cancer-cell changes (e.g., glioma stem cells1), while less attention has been paid to the impact of anti-cancer treatments on the tumor microenvironment (TME). Recently, there has been growing recognition that, following radiotherapy, the TME, and especially tumor-associated microglia and macrophages, contributes significantly to the resistance and recurrence of glioma.2,3 In this regard, several factors responsible for the interaction between tumor and TME after radiotherapy have been identified.4 However, in these studies, both tumor cells and their host (i.e., the TME) were irradiated. In the present study, we demonstrate that radiation-induced changes in healthy brain parenchyma drive the explosive, virulent growth of naïve, non-irradiated tumor cells.Methods
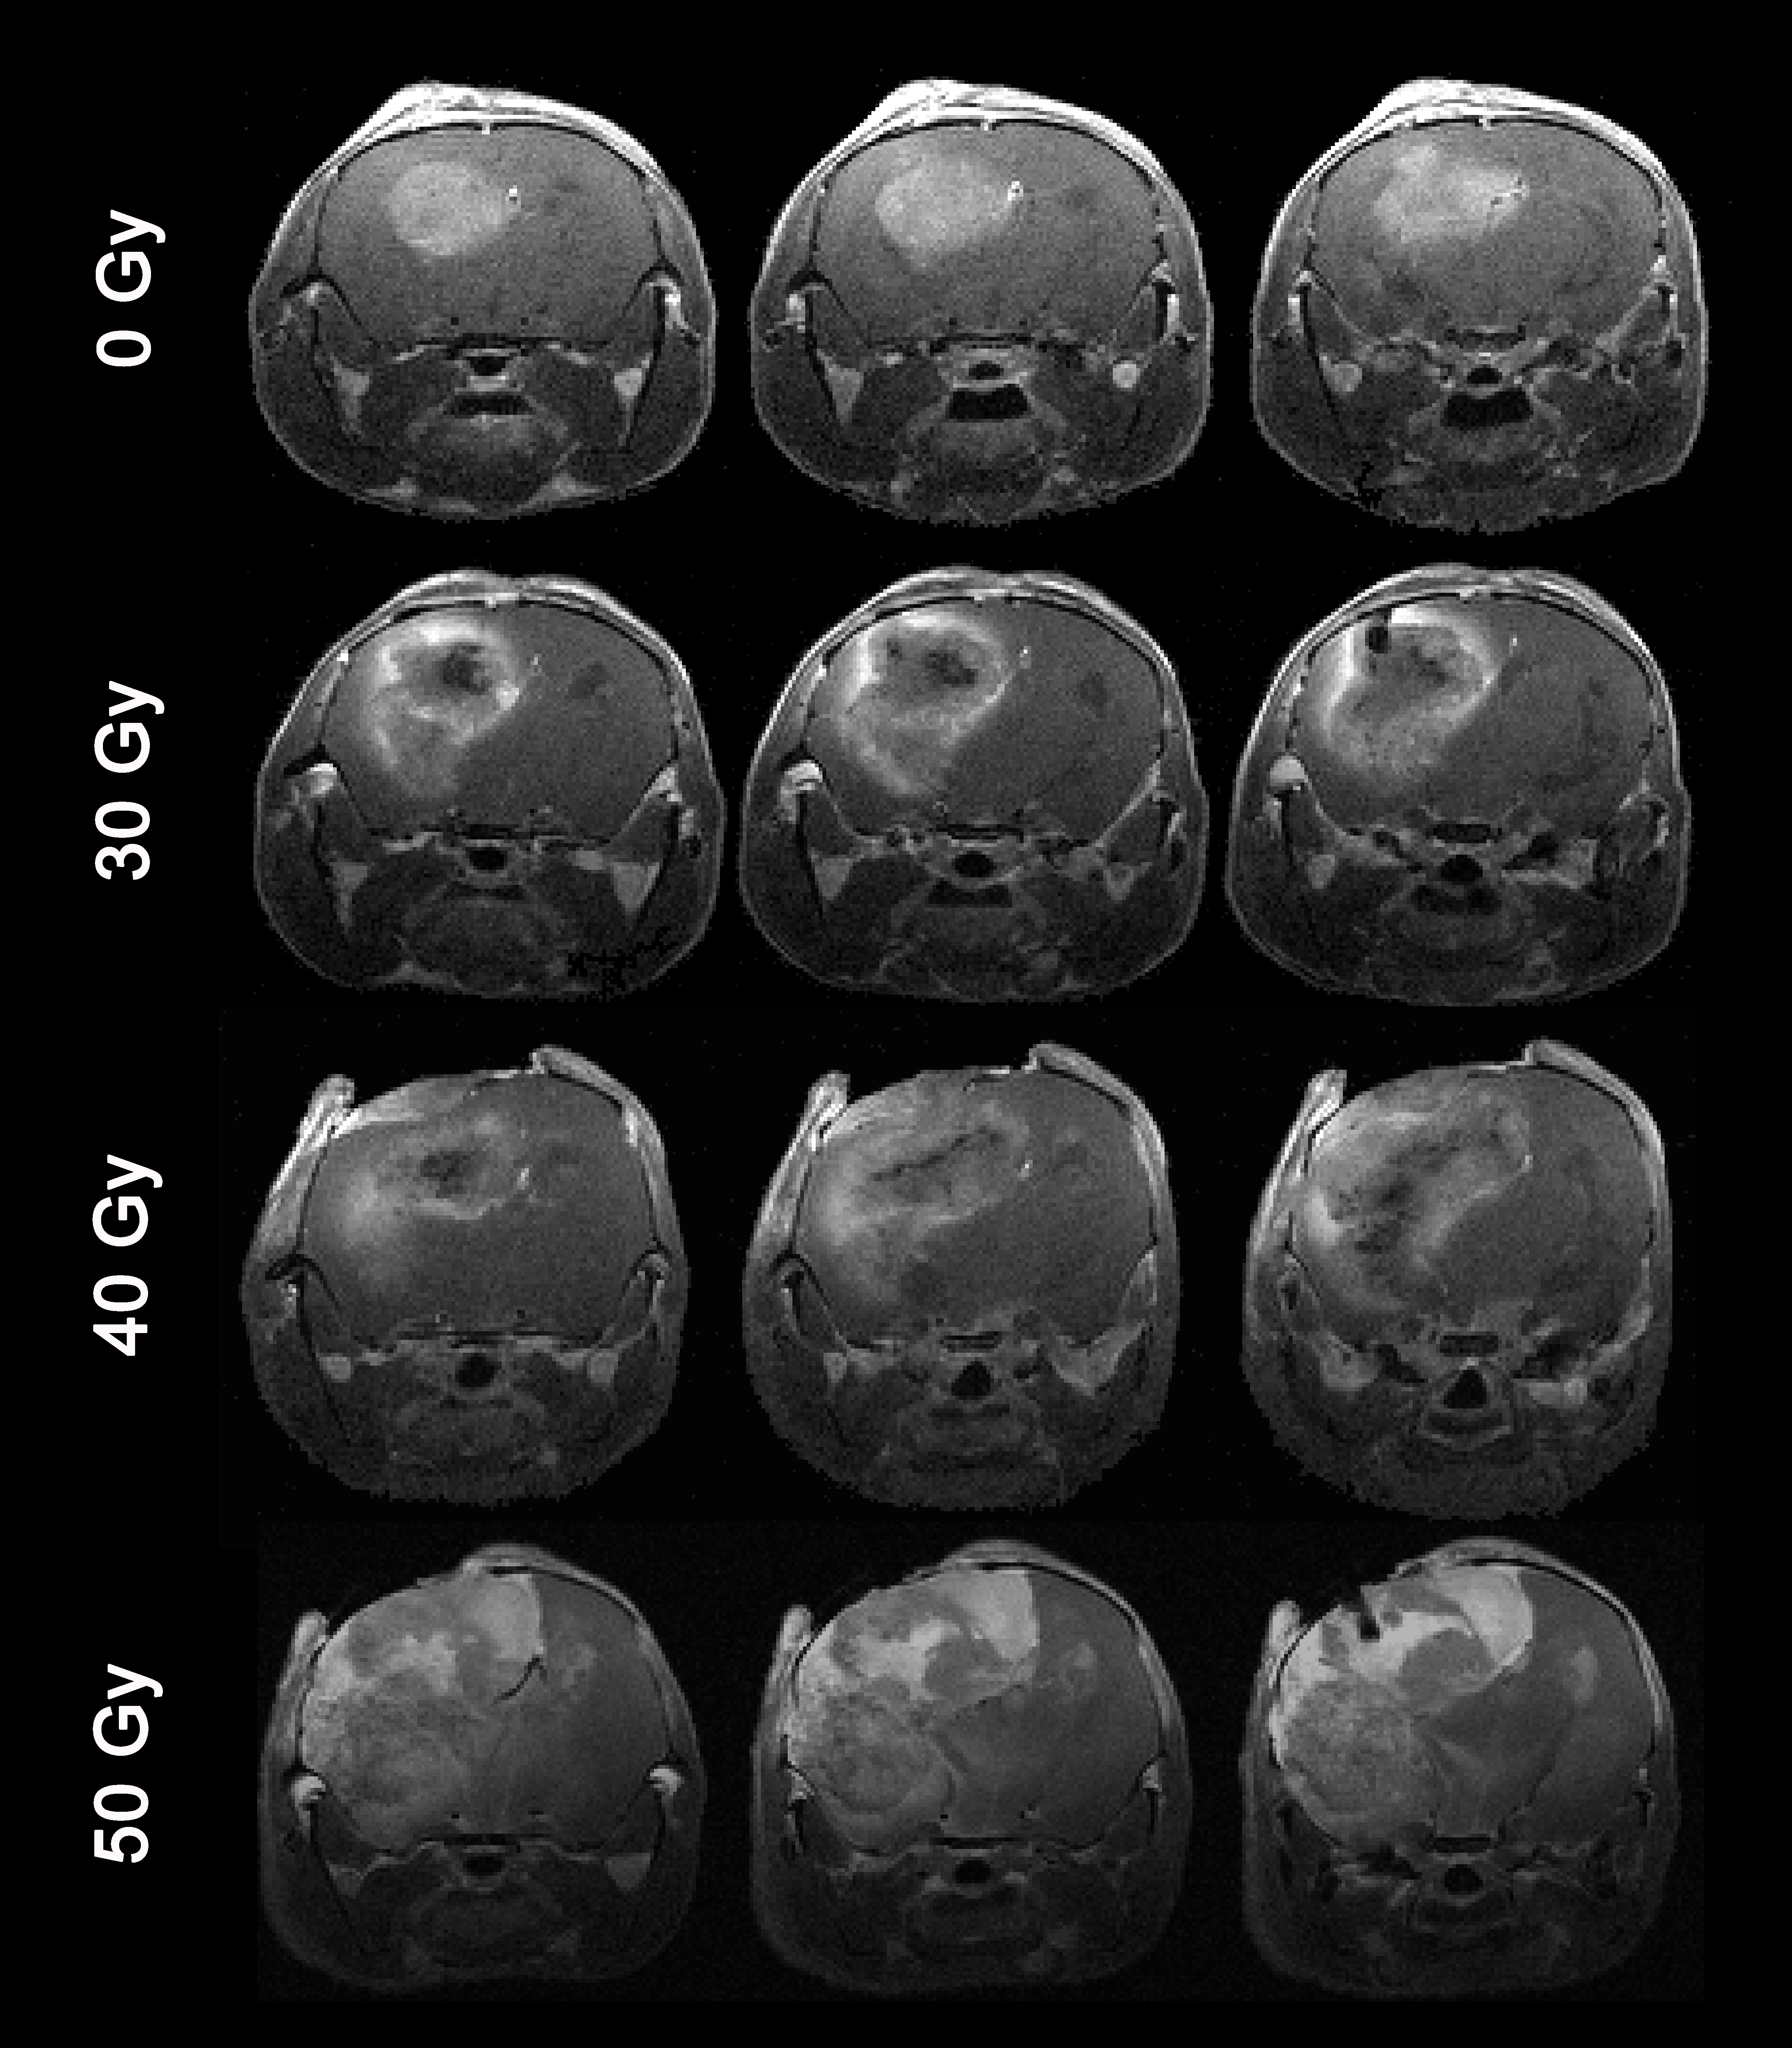
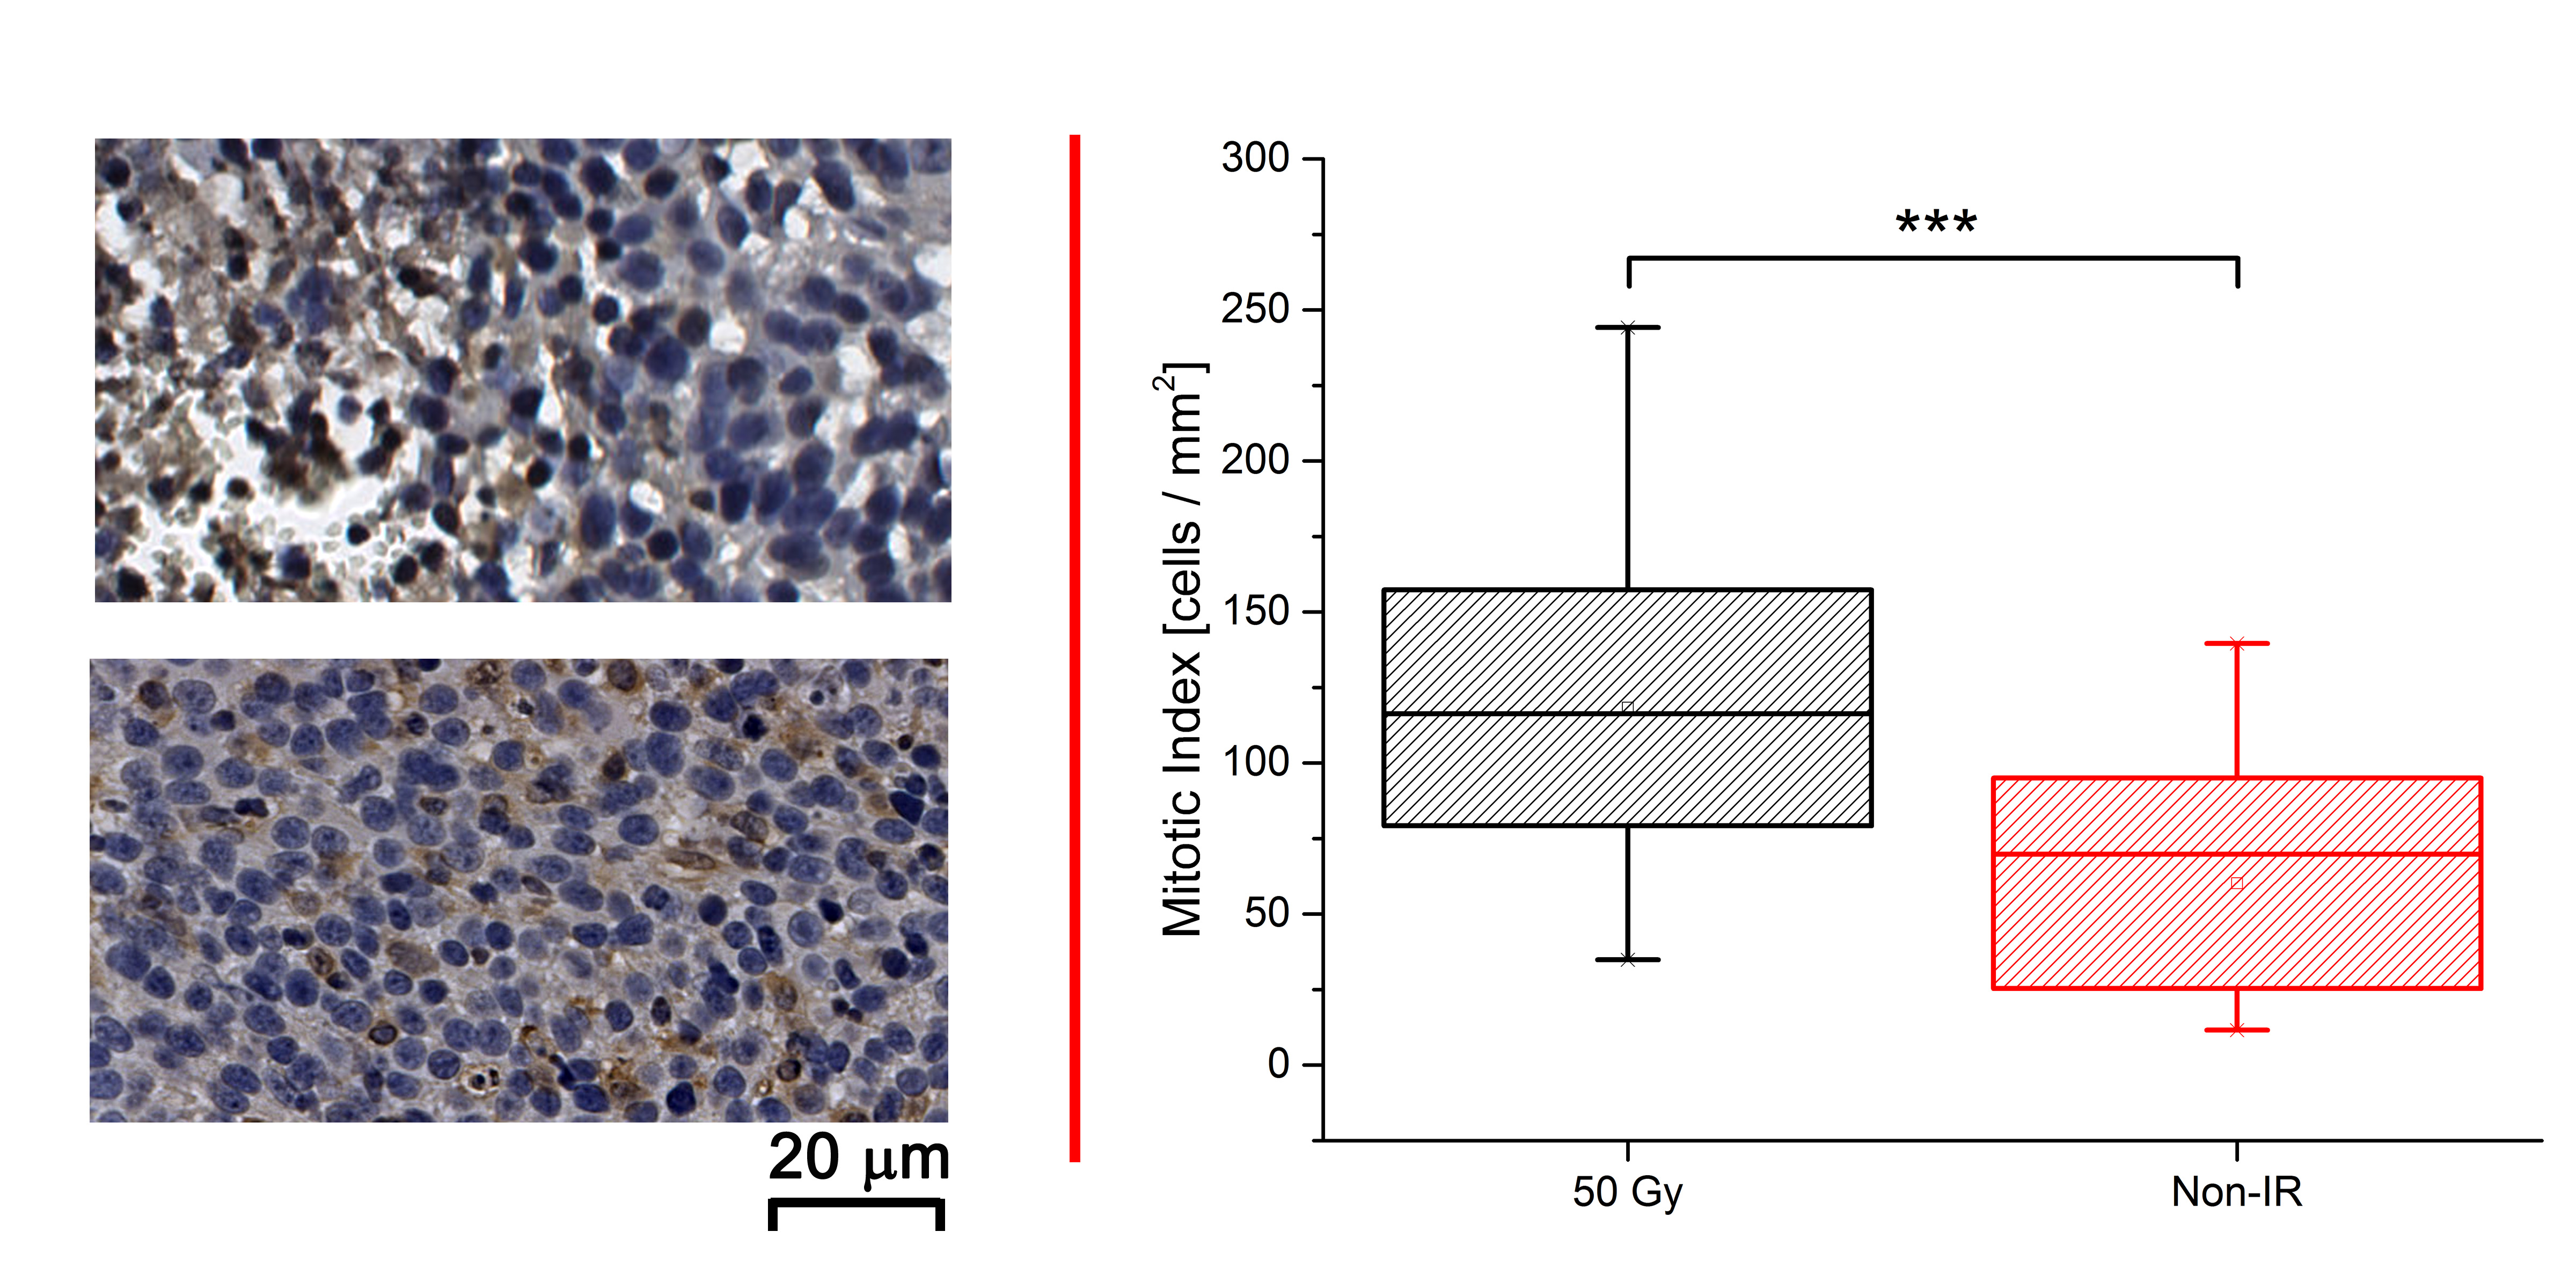
Animal Model: Two sets of experiments were performed on female BALB/c mice. In experiment “A”, three cohorts of mice (n = 5 each) received a single-fraction 0 (sham), 30, or 40 Gy dose of radiation from the Leksell Gamma Knife® PerfexionTM (Elekta, Stockholm, Sweden). Under those doses, no apparent ipsilateral radiation necrosis (RN), detected by either anatomic MR imaging or standard hematoxylin and eosin (H&E) staining, occurs up to 20 weeks post irradiation.5 In experiment “B”, two cohorts of mice (n = 5 each) received a single-fraction 0 (sham) or 50 Gy dose of radiation. At 50 Gy, the onset of RN typically occurs at approximately 4 weeks post-irradiation.5 For both experiments, at 6~8 weeks post-irradiation, murine glioblastoma DBT cells were implanted (~10k cells in 10 μL per mouse) over 3 minutes at a site 2 mm posterior and 3 mm to the left of bregma and 2 mm below the cortical surface. MRI: Images were acquired with a 4.7-T small-animal Agilent/Varian DirectDriveTM scanner using actively decoupled transmit and receive coils. Multislice, post-contrast T1-weighted, spin-echo transaxial images were acquired for mice in both experiments, with the following parameters: TR = 650 ms; TE = 16 ms; FOV = 15 x 15 mm2; slice thickness = 0.5 mm; 21 slices to cover the whole brain. Histology: Standard H&E and immunohistochemical staining for Ki-67, a cellular marker for proliferation, were performed. Mitotic figures were counted in the most cellular area of the tumor (10 random fields for each brain, area of each field 0.086 mm2), following well-defined criteria for quantifying cells in mitosis.6 From these areas, the mitotic index, the number of mitotic figures per mm2 of neoplastic epithelium, was calculated. Data analysis: For experiment “A”, a repeated-measures one-way ANOVA was used to compare the MR-derived tumor-lesion volumes. Hypo-enhanced regions within the tumors were also treated as tumor lesions. Mortality was compared among 0/30/40 Gy irradiation-dose groups, using Kaplan-Meier analysis of survival, followed by the two-tail Mantel-Cox Test. For experiment “B”, a non-parametric Mann-Whitney U-test was used to compare the mitotic indices for tumors developed in irradiated vs. non-irradiated brains.Results and Discussion
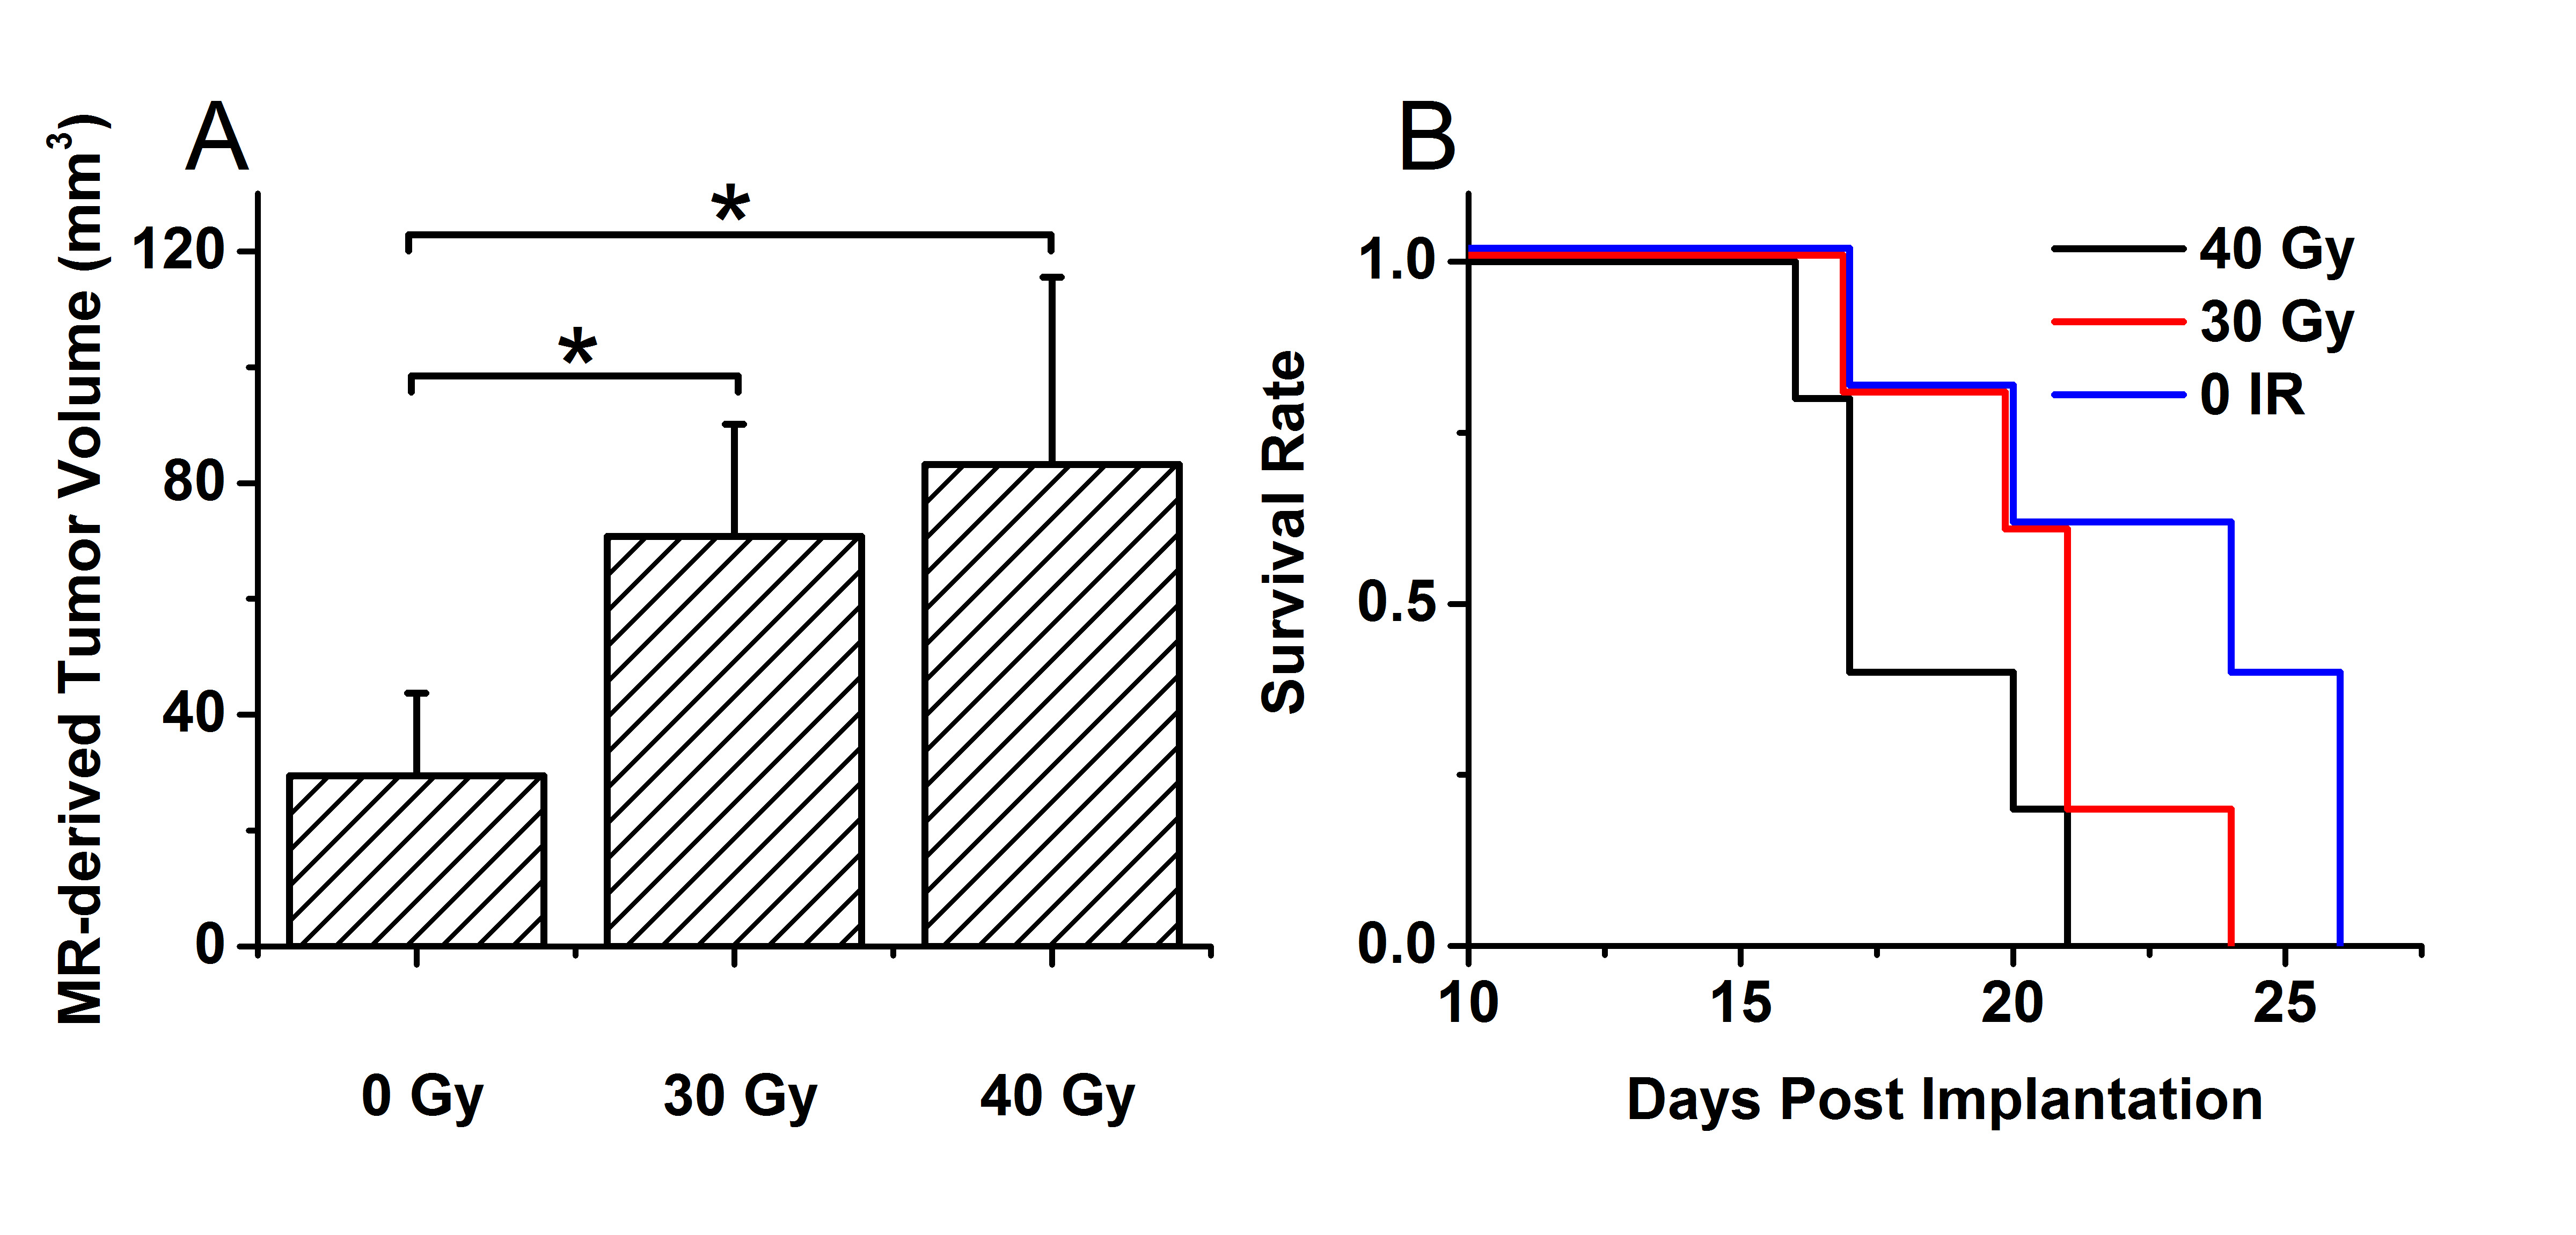
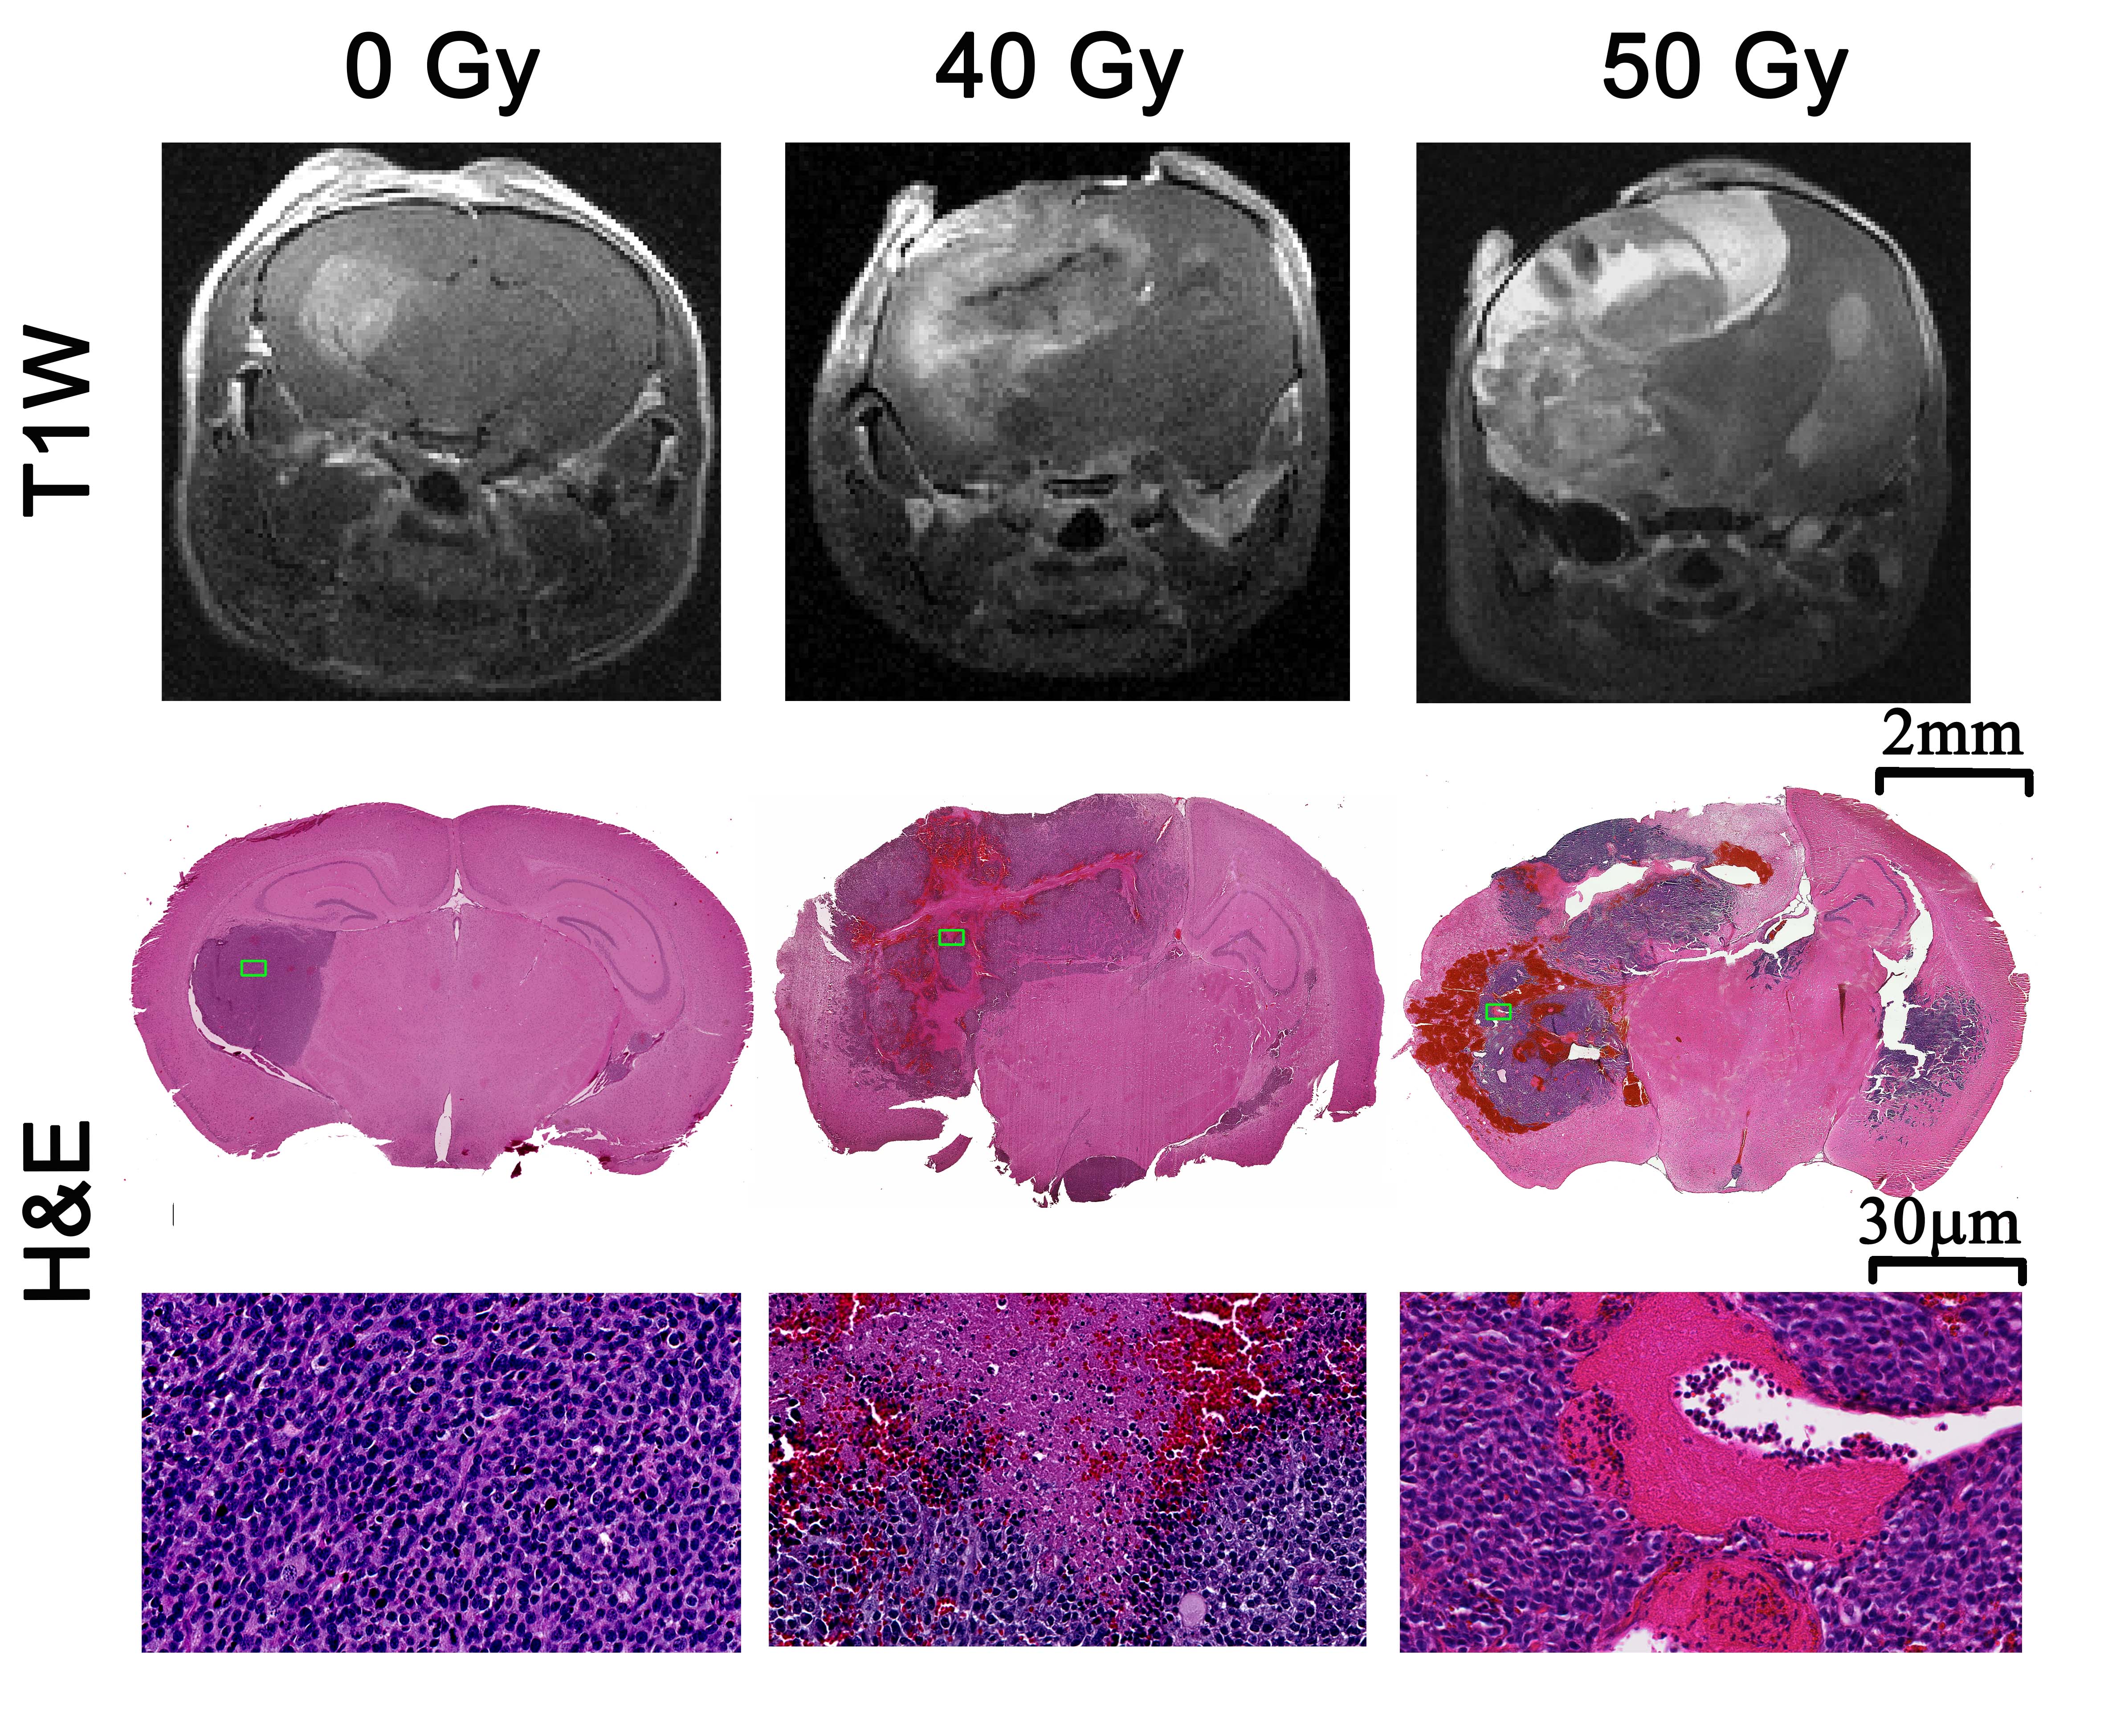
As shown in Figure 1, naïve, non-irradiated, DBT-cell tumors implanted into the brains of irradiated mice grew more rapidly and showed marked virulence, compared to the control group (i.e., non-irradiated tumors implanted into healthy brain). Further, tumor enhancement patterns were more heterogeneous for the irradiated environment, whereas the control group displayed homogeneous enhancements with well-circumscribed tumors. Figure 2 shows that the irradiated groups had much larger tumor volumes (P < 0.05 for 0 Gy vs. 30 and 40 Gy) on day 17 post-implantation. Likewise, median survival post-implantation was reduced (P < 0.05 for 0 Gy vs. 40 Gy; no significance for 0 Gy vs. 30 Gy, likely due to the modest number of animals, n = 5, in each cohort). Histologically, tumors growing in an irradiated background, with and without apparent RN, displayed a heterogeneous appearance, with large, mixed areas of hemorrhage and tumor necrosis (Figure 3). Under higher optical resolving power (20x , bottom row), these tumors displayed prominent changes, including tumor-cell necrosis and tumor-cell loss, not seen in the control-mouse tumors. Further, immunohistochemistry analysis demonstrated increased positive Ki-67 staining and mitotic index for tumors implanted into brains of irradiated mice (Figure 4, P<0.001).Conclusions
Collectively, the presented data provide remarkable new insights into the enhanced proliferation of recurrent gliomas, clearly demonstrating that irradiation primes the TME for enhanced, virulent tumor regrowth, a finding of substantial clinical import. Implantation of tumor into a previously irradiated field with non-invasive, longitudinal, MRI monitoring provides a novel, robust model of recurrent GBM, a platform for further investigation of the long-term effects of radiotherapy on the tumor microenvironment.Acknowledgements
This project was supported by NIH grant R01 CA155365 (J.R.G), and funding from the Alvin J. Siteman Cancer Center (P30 CA091842). We thank Dr. Dinesh Thotala (Radiation Oncology, Washington University) for providing the DBT tumor cells.References
1. Bao S, Wu Q, McLendon RE, et al. Glioma stem cells promote radioresistance by preferential activation of the DNA damage response. Nature. 2006;444:756–760; 2. Barker HE, Paget JTE, Khan AA, Harrington KJ. The tumour microenvironment after radiotherapy: mechanisms of resistance and recurrence. Nat Rev Cancer. 2015;15:409–425; 3. Hambardzumyan D, Gutmann DH, Kettenmann H. The role of microglia and macrophages in glioma maintenance and progression. Nat Neurosci. 2016;19:20–27; 4. Ohuchida K, Mizumoto K, Murakami M, et al. Radiation to Stromal Fibroblasts Increases Invasiveness of Pancreatic Cancer Cells through Tumor-Stromal Interactions. Cancer Res. 2004;64:3215–3222; 5. Jiang X, Yuan L, Engelbach JA, et al. A Gamma-Knife-Enabled Mouse Model of Cerebral Single-Hemisphere Delayed Radiation Necrosis. PloS One. 2015;10:e0139596; 6. van Diest PJ, Baak JPA, Matze-Cok P, et al. Reproducibility of mitosis counting in 2,469 breast cancer specimens: Results from the Multicenter Morphometric Mammary Carcinoma Project. Hum Pathol 1992;23:603–607.Figures