1119
Multiparametric MRI with spatiotemporal evaluation reveals potential therapy response biomarkers for 177Lu-octreotate therapy of mice with human neuroendocrine tumor1Department of Radiation Physics, University of Gothenburg, Gothenburg, Sweden, 2Proteomics Core Facility, University of Gothenburg, Gothenburg, Sweden, 3Department of Pathology, University of Gothenburg, Gothenburg, Sweden
Synopsis
Tissue parameters derived from multiparametric MRI were evaluated as potential imaging biomarkers for therapy response assessment in mice with human neuroendocrine tumor treated with 177Lu-octreotate. Animals were imaged before and repeatedly after 177Lu-octreotate treatment, using T2w, IVIM-DWI, DCE-MRI, T1- and T2*-mapping techniques. MR-parameters were evaluated regionally and longitudinally, and quantitative proteomics was used to evaluate underlying biological response in central and peripheral tumor separately. Several MR-parameters showed strong correlation with tumor response, as verified by MRI-based tumor volume measurements, but also with proteins associated with radiobiological effects on tumor tissue. Spatial and temporal evaluation increased sensitivity of the methods.
Introduction and Purpose
Incidence of small intestine neuroendocrine tumors (siNETs) increase, and metastases are often present at diagnosis1. Radionuclide therapy using 177Lu-octreotate show promise for treatment of patients with inoperable siNET2,3, but indicators for individual prediction of disease progression and therapeutic response are needed for optimization and improved understanding of response mechanisms. Multiparametric magnetic resonance imaging (mpMRI) offer potential, non-invasive, response biomarkers for regional and longitudinal tumor characterization.
The aims of this study were to evaluate MR-features derived from mpMRI of siNETs regarding their efficacy of response assessment after 177Lu-octreotate therapy, and to correlate the MR-features with spatially matched protein expression levels.
Material and Methods
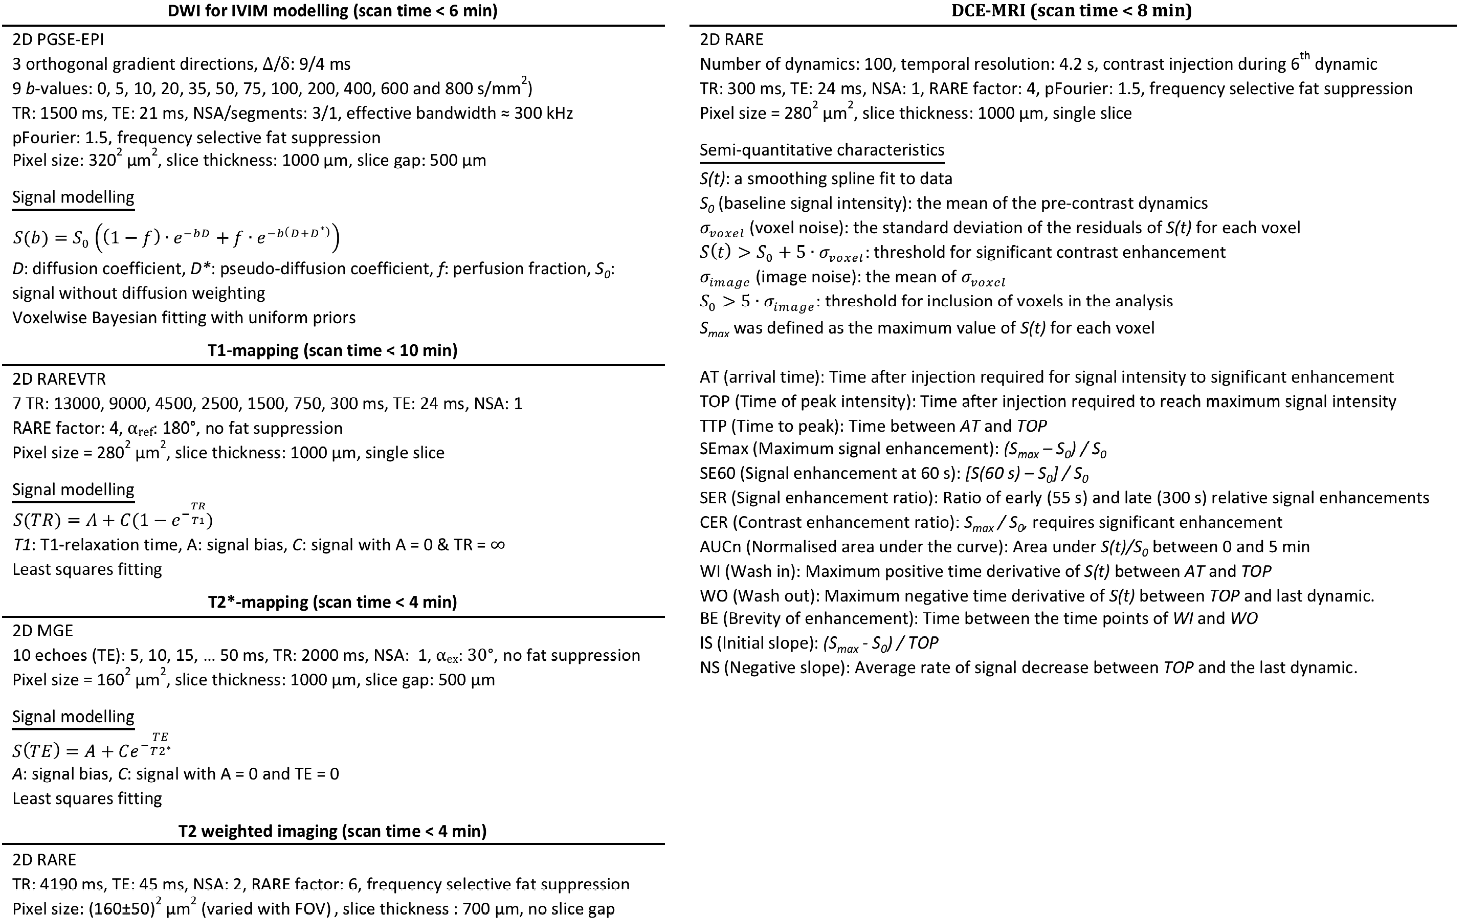
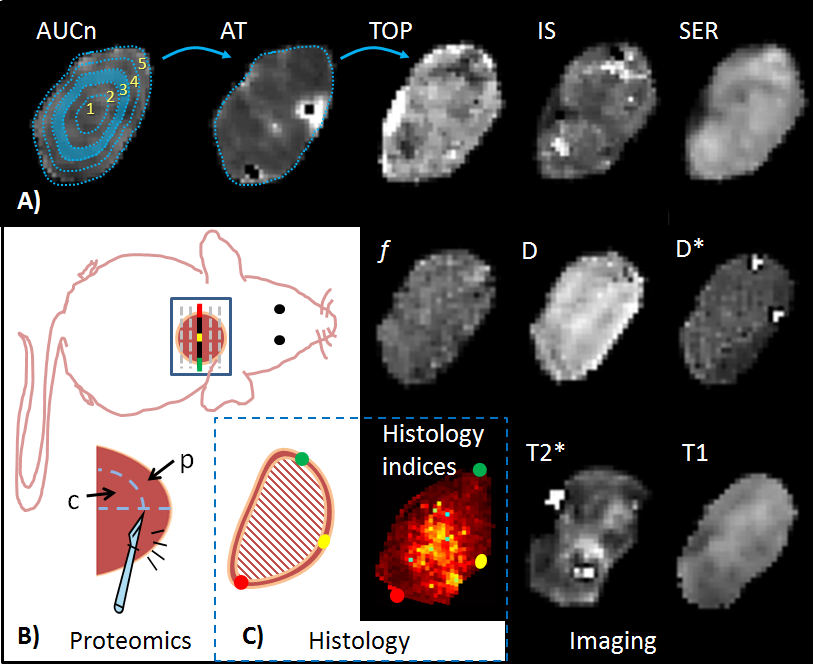
Mice (n=21) with subcutaneous human siNETs received 15 MBq 177Lu-octreotate on day 0. mpMRI was performed under anaesthesia on days:[-1,1(n=4); -1,1,3,8,13(n=17)] in a small-animal 7T MR-system, using MR-techniques and sequence parameters described in fig.1.
Central and peripheral tumor samples were excised and snap frozen for quantitative proteomics after the final mpMRI experiment (fig.2), as previously described4, and proteins passing a false-discovery rate of 1% and containing minimum one unique peptide were further evaluated regarding biological functions using Gene Ontology database (http://www.geneontology.org)5.
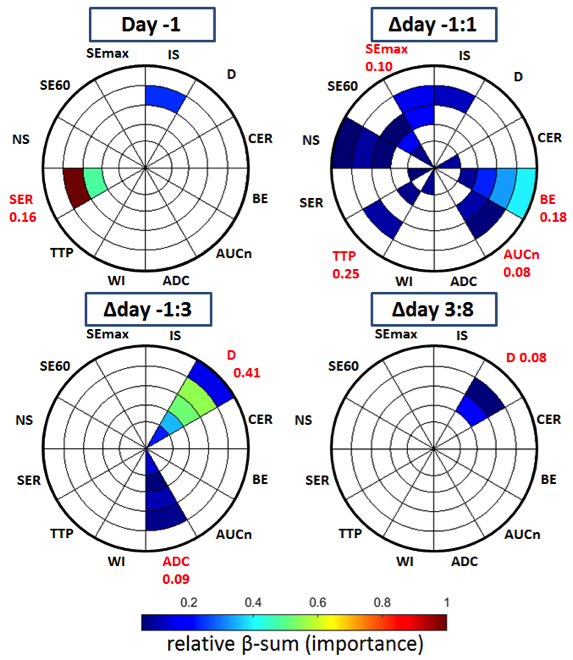
Tumor volumes were estimated from T2w MRI as previously described6, and response was defined for individual tumors as the mean change in relative volume from day -1 to day 8. Model fitting- and semi-quantitative techniques were used to derive MR-parameter maps (fig.1), which were evaluated on 5 annular disc-shaped regions of different radius (fig.3). Pre-treatment MR-parameter values and their longitudinal development (e.g. value(day3)-value(day1), denoted Δday1:3) were evaluated for each disc and for the tumor mean value. Parameter changes were evaluated for ΔdaysA:B=-1:1,-1:3,-1:8,-1:13,1:3,3:8 and 8:13.
To rank the MR-parameters by their efficacy regarding response assessment, the lasso linear regression method, preconditioned using supervised principal components, was used7. Missing values were accounted for by repeating the method 5000 times, with stochastic data imputation each time, and the regression coefficients from each round were cumulatively added to form “β-sums” specific to each MR-parameter, according to which they were ranked.
Results and Discussion
Tumor shrinkage or stabilized growth was observed in all tumors between day -1 and day 8, and growth was then re-established in most tumors (data not shown). It should be noted that a non-curative amount of 177Lu-octreotate was used to enable longitudinal evaluation and induce a wider range of biological responses.
The efficacy of MR-parameters regarding response prediction/assessment, was ranked according to the β-sum returned from feature selection (fig.3). The highest rank was reached by $$$SER^{-1}_{disc\:4} (parameter^{day/\Delta day}_{tumour\: region})$$$, followed by $$$D^{-1:3}_{disc\: 4}$$$. Five MR-parameters required regional evaluation to be ranked high enough for display in fig.3. Twenty-four MR-parameter-region combinations were highly ranked on Δday-1:1; corresponding number for day-1/Δday-1:3/Δday3:8 was 4/11/3 (fig.3). No other time-point combinations yielded high ranks. This indicates the importance of considering both spatial and temporal tumor heterogeneity in response evaluations, and that very early evaluations should be considered.
Totally, 104 proteins correlated with tumor response (p<0.01), 68 and 28 were found in central or peripheral tumor only, and 66 could be categorized into radiation related biological processes.
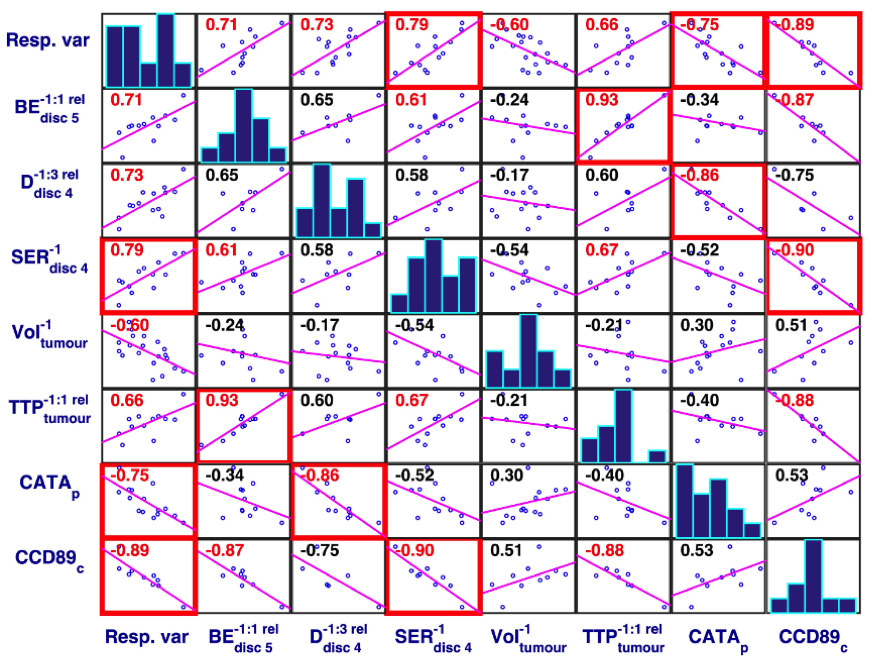
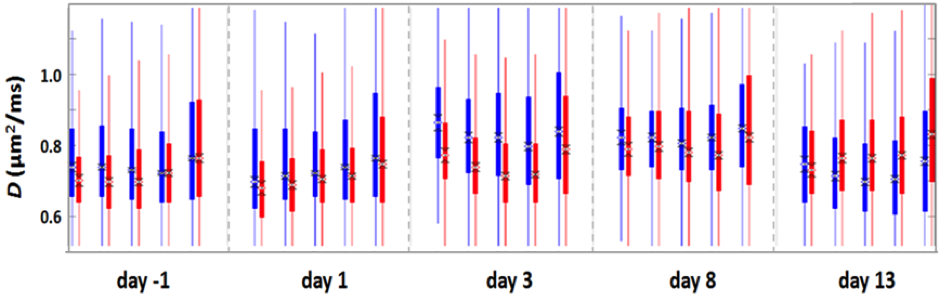
Several significant, strong correlations between high-ranked MR-parameters, response and protein levels were found (fig.4). For example, $$$D^{-1:3}_{disc\: 4}$$$ correlated with peripherally sampled CATA (Catalase, encoded by CAT), which is associated with oxidative stress, proliferation, cell cycle arrest, and apoptotic cell death. A line of evidence suggests that tissue water diffusivity, D, increases after successful therapy due to decreased cellular density, and thereby reduced membrane restrictions for diffusion. One hypothesis is thus that CATA is expressed in peripheral tumor due to successful therapy (apoptosis induced by beta-particle irradiation from 177Lu), and that this is reflected in increased peripheral diffusion (fig.5). $$$SER^{-1}_{disc\:4}$$$ and centrally sampled CCD89 protein (Coiled-Coil Domain Containing 89, encoded by CCDC89) were strongly correlated. CCD89 is associated with DNA damage & repair, proliferation, and cell cycle arrest, and SER reflects redistribution rate of contrast agent from extracellular extravascular space to the vascular lumen. The interpretation of this correlation is, however, not straightforward, since SER was measured peripherally (disc 4) whereas CCD89 was from central tumor.
Conclusion
mpMRI offers several potential biomarkers for assessment of response to 177Lu-octreotate therapy in siNET. Interesting examples are SER and D since they were strongly correlated with response, but also with expression levels of relevant proteins, which is important from a clinical perspective. However, maximal utilization of the MR-parameters probably requires regional and longitudinal evaluation, e.g. for increased sensitivity to response related effects. Further studies are needed in order to better understand the associations between MR-parameters and underlying biology.Acknowledgements
We are also grateful to the Proteomics Core Facility at Sahlgrenska Academy, Gothenburg University, who performed the analysis for protein quantification and Inga-Britt and Arne Lundbergs Research Foundations for the donation of the Orbitrap Fusion Tribrid MS instrument used in this analysis. This study was supported by grants from the Swedish Research Council, the Swedish Cancer Society, BioCARE – a National Strategic Research Program at the University of Gothenburg, the King Gustav V Jubilee Clinic Cancer Research Foundation, the Sahlgrenska University Hospital Research Funds, the Assar Gabrielsson Cancer Research Foundation, the Adlerbertska Research Fund, the Wilhelm and Martina Lundgren science trust fund and the Royal Society of Arts and Sciences in Gothenburg (KVVS).References
1. Yao JC, Hassan M, Phan A, et al. One hundred years after "carcinoid": epidemiology of and prognostic factors for neuroendocrine tumors in 35,825 cases in the United States. J Clin Oncol. 2008;26:3063-3072.
2. Kwekkeboom DJ, De Herder WW, Kam BL, et al. Treatment with the radiolabeled somatostatin analog [177 Lu-DOTA 0,Tyr3]octreotate: toxicity, efficacy, and survival. J Clin Oncol. 2008;26:2124-2130.
3. Sward C, Bernhardt P, Ahlman H, et al. [177Lu-DOTA 0-Tyr 3]-octreotate treatment in patients with disseminated gastroenteropancreatic neuroendocrine tumors: the value of measuring absorbed dose to the kidney. World journal of surgery. 2010;34:1368-1372.
4. Spetz J, Montelius M, Berger E, et al. 177Lu-octreotate induces tumor volume regression and suppresses invasive potential in small intestine neuroendocrine tumors. Manuscript
5. Ashburner M, Ball CA, Blake JA, et al. Gene ontology: tool for the unification of biology. The Gene Ontology Consortium. Nat Genet. 2000;25:25-29.
6. Montelius M, Ljungberg M, Horn M, et al. Tumour size measurement in a mouse model using high resolution MRI. BMC Med Imaging. 2012;12:12.
7. Tibshirani R. Regression shrinkage and selection via the lasso. Journal of the Royal Statistical Society. Series B (Methodological). 1996;267-288.
Figures