1117
Whole-Body Diffusion-Weighted Imaging at 1.5T for assessment of treatment response in non-Hodgkin lymphomaXiaoyi Wang1, Yanfeng Zhao1, Ning Wu1, Han Ouyang1, and Lizhi Xie2
1National Cancer Center/Cancer Hospital, Chinese Academy of Medical Sciences and Peking Union Medical College, Beijing, People's Republic of China, 2GE Healthcare, MR Research China, BeiJing, People's Republic of China
Synopsis
The diagnostic capability between WBDWI with contrast enhanced CT was compared in malignant lymphoma diagnosis. We found that WBDWI is a powerful tool on diagnosing non-Hodgkin(NHL) lymphoma by comparing with contrast enhanced CT. Chemotherapy causes rapid decrease of the restriction of water molecules diffusion movement, ADC-min could be valuable tools for treatment response evaluation of NHL. We recommended WBDWI examination for patients with NHL.
Purpose
To determine the feasibility of whole-body diffusion-weighted magnetic resonance imaging (WBDWI) for assessment of treatment response in aggressive non-Hodgkin lymphoma (NHL).Introduction
Up to now, several researches have demonstrated that WBDWI was a valuable tool used for comprehensive tumor assessments in various malignant diseases. The purpose of this study was to assess the pre- and post-treatment ADC changes on WBDWI, using contrast enhanced CT as reference standard.Method
Patients with NHL treated with standard chemotherapy underwent 1.5-T WBDWI and contrast enhanced CT scan before and after 2 cycles chemotherapy during treatment, using b-values of 0 and 800 s/mm2 from which the apparent diffusion coefficient (ADCmin) was calculated. Patient follow-up (more than 12 months) was the reference standard. Volume and ADCmin per lesion (lymph node and organ lesions) on baseline and early phase during chemotherapy were measured. The assessment was based on the malignant lymphoma treatment efficacy evaluation criteria. Using the receiver operating characteristic (ROC) curve evaluate ADC values pre- and post- chemotherapy, and the changes of ADC values (△ADC= ADCpost – ADCpre) to predict the efficacy at the end of the entire chemotherapy. Areas under the curve were compared by Hanley & McNeil. Categorical variables were tested with the Chi-square test or McNemar test.WBDWI and CT examination
WBDWI scanned in a 1.5T MR scanner (GE MR 360 Optix). A single short EPI sequence was used to acquire diffusion images with the following parameters: axial plane, 30 slices with 7 mm thickness and -1mm gap, FOV = 40 cm×40 cm, matrix = 96×128, TR/TE = 5100/81.9 ms , b value = 800 s/mm2, 4 averages. 3D-MIP and the black/white inversion post image processing technique were performed on ADW4.6 workstation. CT scanning was performed using a GE 64-slice spiral CT (GE Lightspeed VCT, Discovery CT 750 HD). Intravenous injection of non-ionic iodine contrast medium was using a high-pressure syringe, the dose was 90ml, the flow rate was 2.5ml/s, the slice thickness/spacing was 5/5mm.Results
34 NHL patients were enrolled in this study (22 male, 12 female; aged 19-77 years; total 556 lesions, including 473 lymph nodes invaded). According to pathological type, there were 26 cases of diffuse large B cell lymphoma (277 lymph nodes), 2 cases of B small lymphocytic lymphoma (87 lymph nodes), 2 cases of precursor T lymphoblastic lymphoma (76 lymph nodes), 2 cases of MALT (3 lymph nodes), 1 case of follicular lymphoma (30 lymph nodes), and 1 case of anaplastic large B cell lymphoma (only with extranodal invaded), respectively. 3 cases were in stage I, 11 cases were in stage Ⅱ, 12 cases were in stage Ⅲ, 8 cases were in stage Ⅳ, respectively. 21 cases both had pre- and post-treatment WBDWI. The pre-treatment ADCmin was 0.833±0.225×10⁻³mm2/s; the post-treatment ADCmin increased to 2.097±0.934×10⁻³mm2/s, there was statistically significant difference between pre- and post- treatment ADCmin (t=-24.553,P=0.000) (Figure.1). The pre-treatment ADCmin in responding lesions was significantly different from non-responding lesions (AZ=0.716, P = 0.000) in early phase (2 circle) chemotherapy, the lesion which pre-treatment ADCmin ≤0.715 × 10⁻³mm2/s, showed more progressive in early phase chemotherapy (Figure.2), but there was no predictive value for the end of entire chemotherapy (AZ=0.554, P = 0.161) (Figure.3). While the early phase post-treatment ADCmin and △ADC has predictive value for the end of entire chemotherapy, there was statistically significant difference between responding and non-responding lesions (AZ=0.792, P = 0.000; AZ=0.761, P = 0.000), the responding lesions show ADCmin >1.5×10⁻³mm2/s (sensitivity 77.9%, specificity 77.5%) or △ADC > 0.87×10⁻³mm2/s (sensitivity 64.7%, specificity 85.9%).Discussion and Conclusion
MRI is emerging as an efficient whole-body imaging modality combining sequences with adequate spatial and contrast resolution. DWI characterizes tissue by probing changes in random water molecule mobility related to differences in the tissue microstructure. Quantified by the ADC, allow viable tumors to be differentiated from necrosis and inflammation. Whole-body DWI with ADC mapping can show a persistent low ADC values of residual tumor after treatment and may help to assess the treatment response [1,2]. Responded well lesions showed a significantly higher post-treatment ADC and a higher ADC value changes (△ADC) compared with non-responding lesions. 1.5-T WBDWI with ADC quantification may enable early treatment assessment of aggressive NHL correctly and timely.Acknowledgements
No acknowledgement found.References
[1]De Paepe K, et al. Cancer Imaging, 2013, 13: 53-62.[2]Chieh Lin, et al. Invest Radiol. 2011 May; 46(5):341-9.
Figures
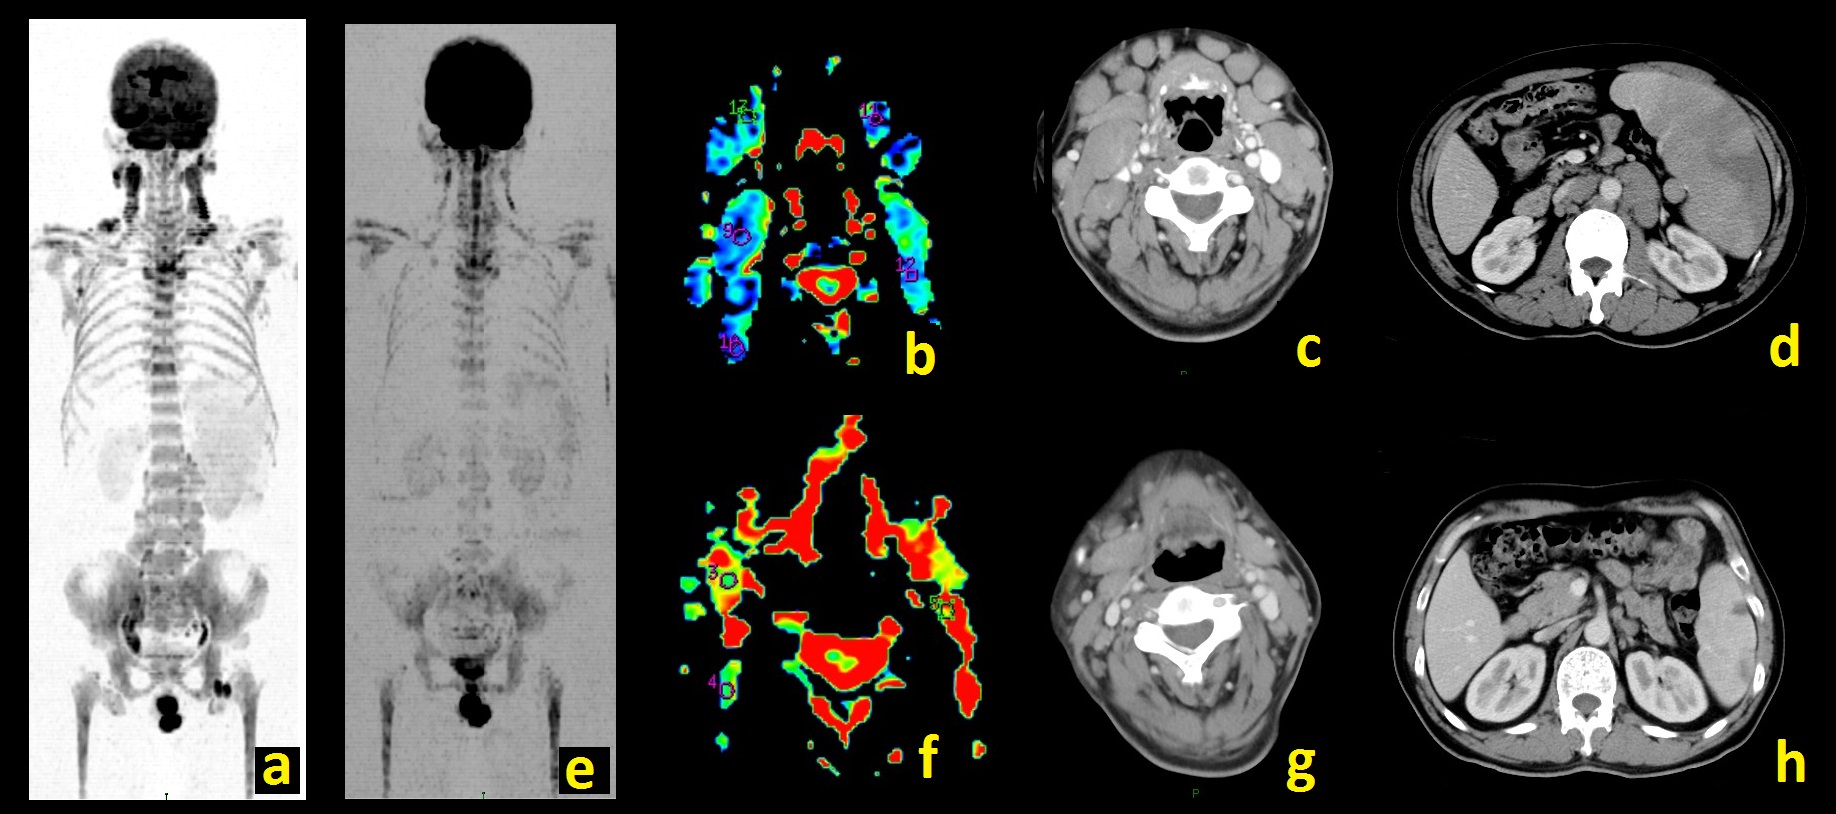
Figure.1 Male, 49yrs, Diffuse large
B-cell lymphoma. Figure (a, b, c and d) Before chemotherapy; (e, f, g and h)
After 2 cycles chemotherapy; (a, e) 3D-MIP of WBDWI; (b, f) ADC map; (c, g)
Neck CT scan; (d, h) Abdominal CT scan
WBDWI
and CT scan showed lymphadenopathy at neck, supraclavicular, axillary, mediastinal,
abdominal, retroperitoneal, pelvic and groin, and splenomegaly before
chemotherapy (a, b, c and d). All of the lymph nodes decreased or disappear,
and the spleen volume decreased after chemotherapy (e, f, g and h).
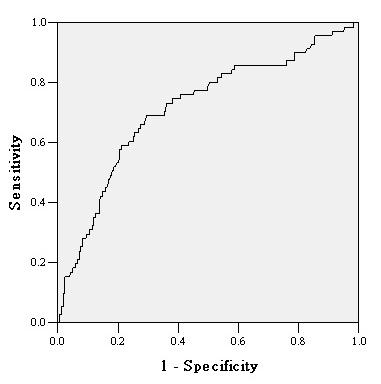
Figure.2 The predictive ability of pre-treatment
ADC for the early disease progression.
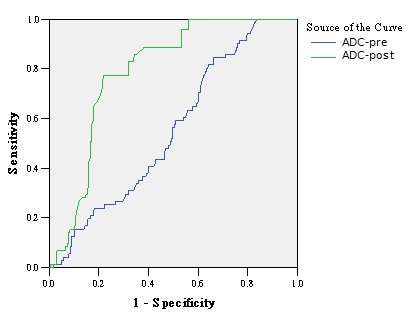
Figure. 3 The predictive ability of pre- and
post- treatment ADC (early phase after 2 cycle chemotherapy) for the end of entire chemotherapy.