1116
Assessing Response Heterogeneity following Radium 223 administration using Whole Body Diffusion Weighted MRI1Division of Radiotherapy and Imaging, The Institute of Cancer Research, London, United Kingdom, 2MRI Unit, The Royal Marsden NHS Foundation Trust, Sutton, United Kingdom, 3Urology Department, The Royal Marsden NHS Foundation Trust, Sutton, United Kingdom
Synopsis
Whole-Body Diffusion-Weighted-MRI is emerging as an imaging response biomarker in metastatic bone disease. Documentation of mixed therapeutic response is a key recommendation of the Prostate Cancer Working Group as recognition of coexistence of mixed response to therapy and clinical benefit. Radium-223 has shown efficacy in prostate cancer patients with symptomatic bone metastases. Monitoring Radium-223 therapy efficacy treatment is challenging, as Radium-223 administration can be associated with flare in pain, PSA and Bone Scan. These pilot data demonstrate that Radium-223 administration is associated with an increase in bone metastases ADC values together with a mixed response pattern.
Background
Bone metastases occur in more than 80% of patient with metastatic castration-resistant prostate cancer (mCRPC) and are associated with significant morbidity. Radium-223, an alpha-emitting radiopharmaceutical, has been shown to prolong overall survival (OS), delay symptomatic skeletal events, and improve quality of life in mCRPC patients with symptomatic bone metastases and no visceral metastases1. Monitoring Radium-223 therapeutic efficacy is challenging, as Radium-223 administration can be associated with flare in pain, PSA and Bone Scan; current data suggest that serum Alkaline phosphatase (ALP) is a more clinically relevant marker than PSA with rapid and sustained decrease in ALP being associated with increase in OS1. Whole Body Diffusion Weighted MRI (WBDW-MRI) is emerging as an imaging biomarker for evaluation of response in bone metastases, an area that lacks accurate imaging methods for therapeutic benefit assessments2,3. Documentation of mixed imaging response to treatment, “wherein one site responds favorably and another unfavorably” has been included amongst the key recommendations by the Prostate Cancer Working Group4 as recognition of mCRPC disease heterogeneity and of the coexistence of mixed response to therapy and clinical benefit.Purpose
In this pilot study we have explored a new WBDW-MRI analysis methodology that illustrates and quantifies intra- and inter-lesion response heterogeneity.Methods
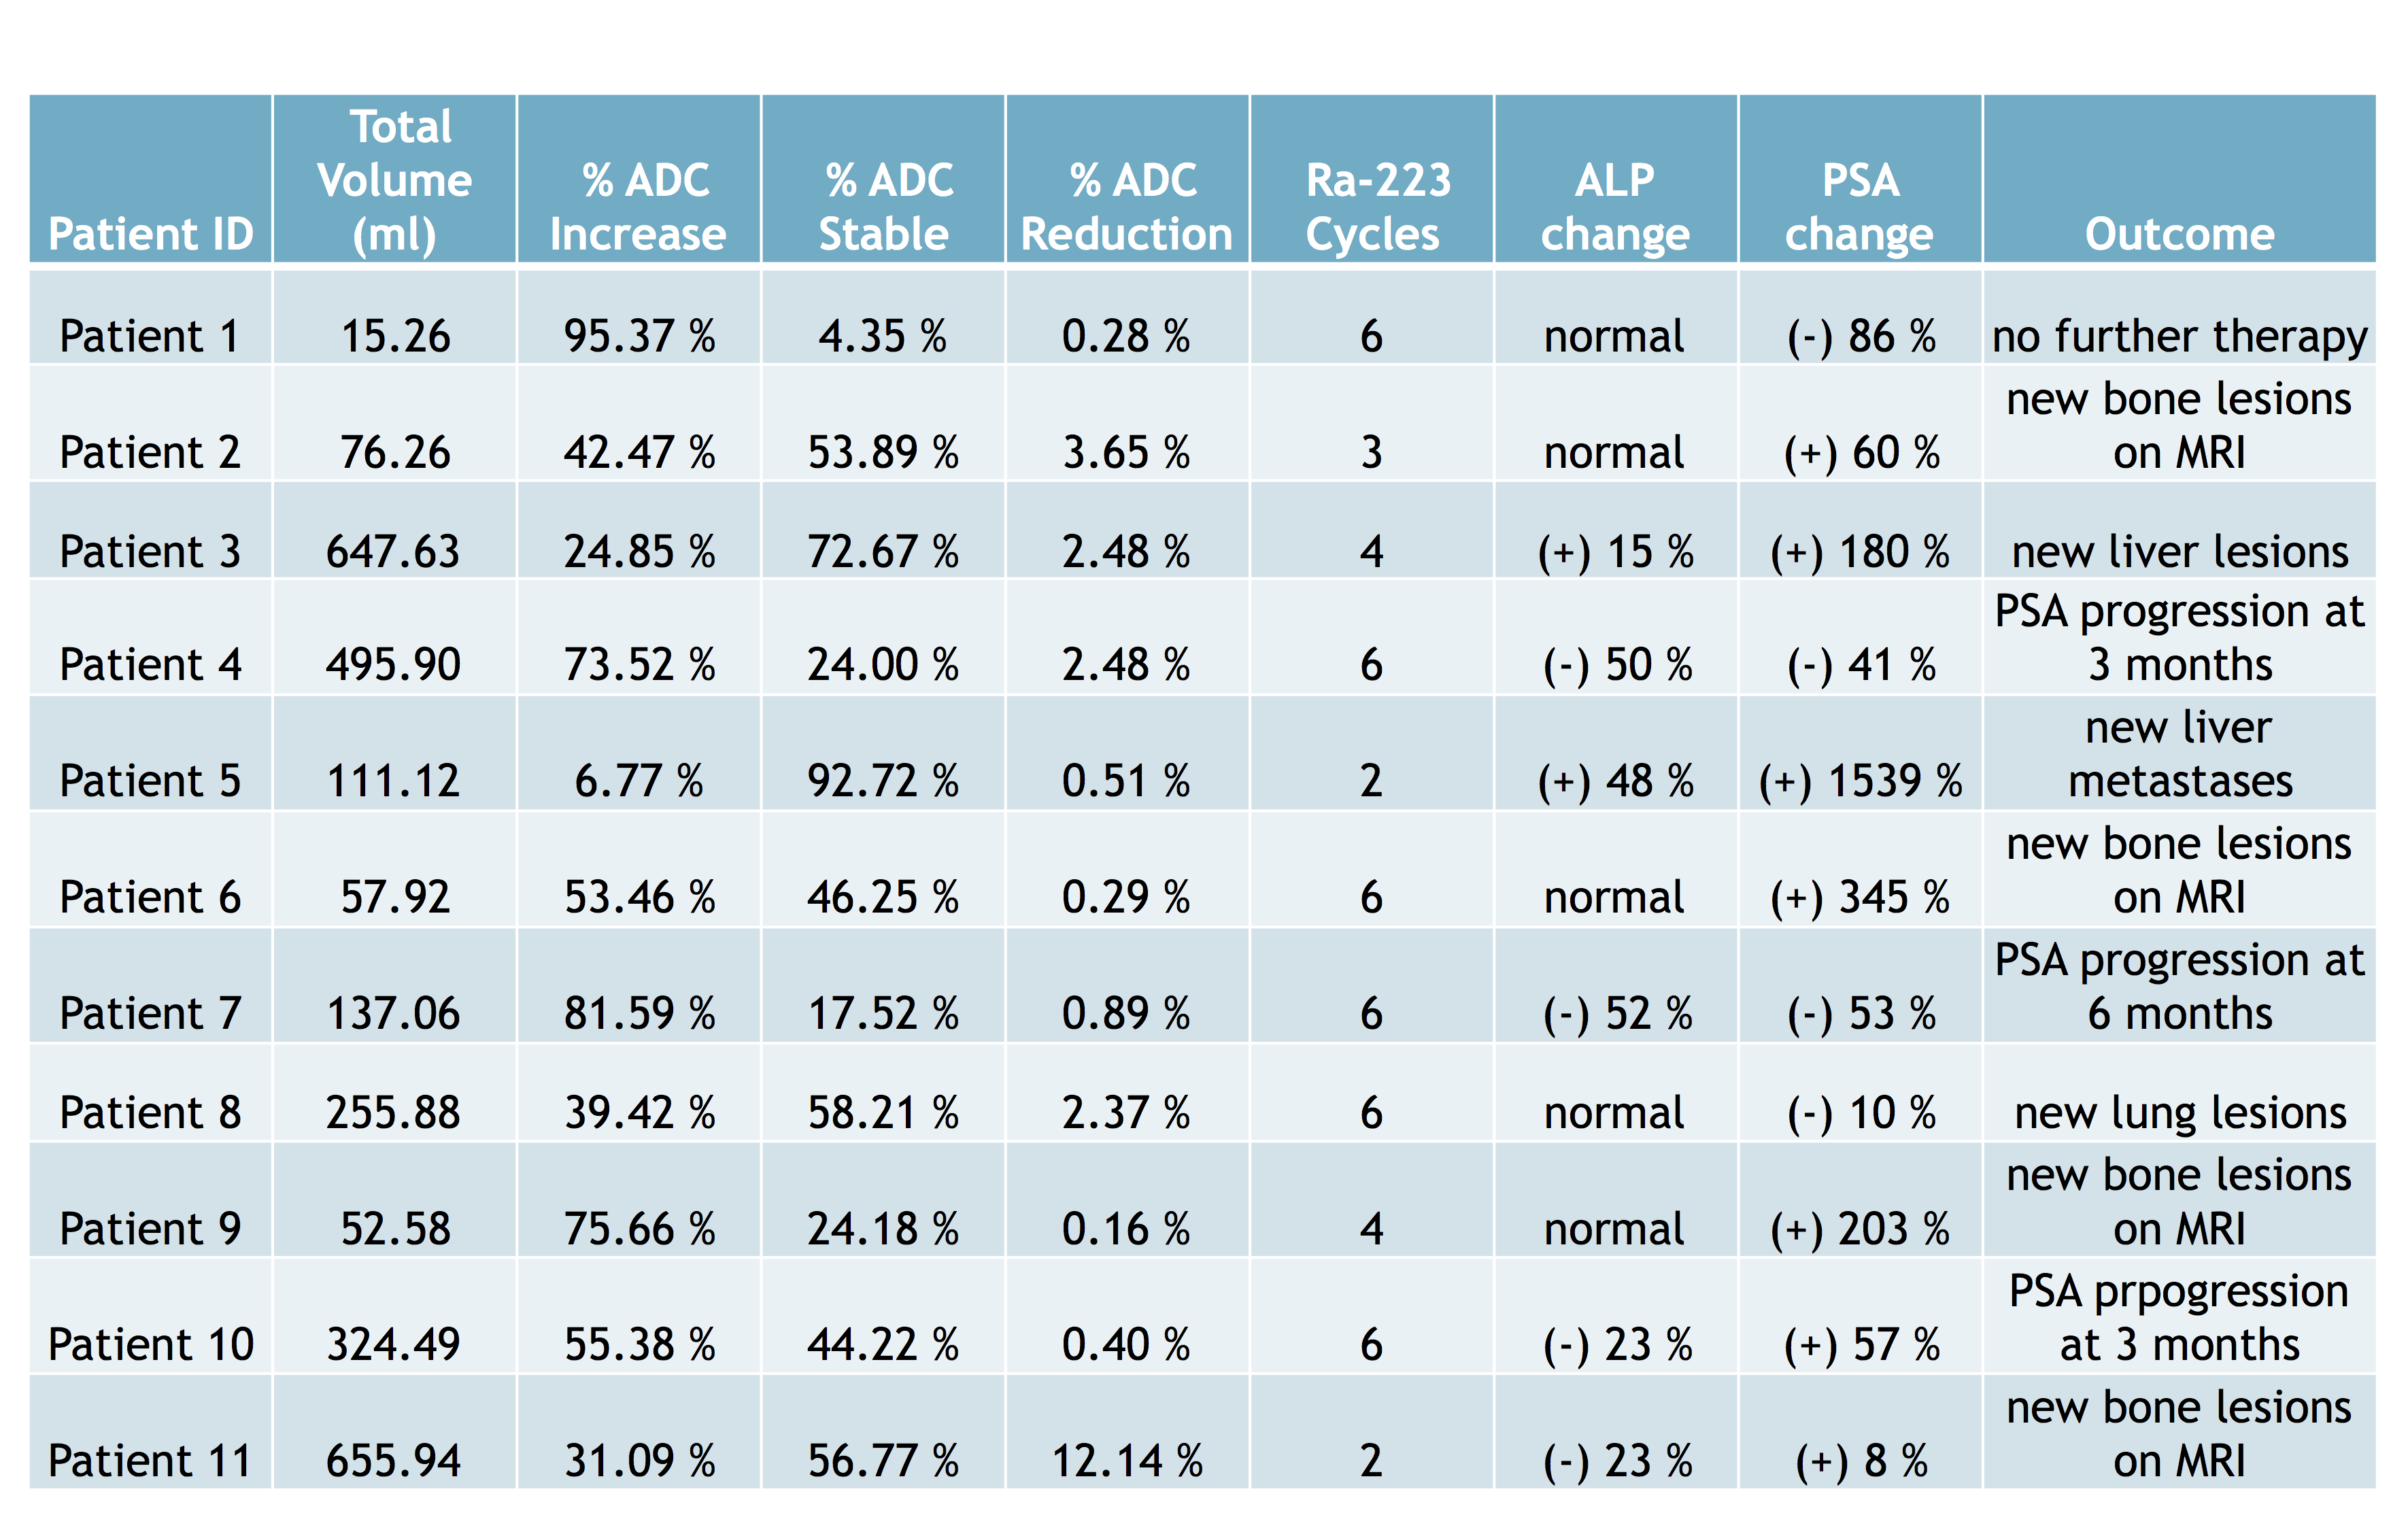
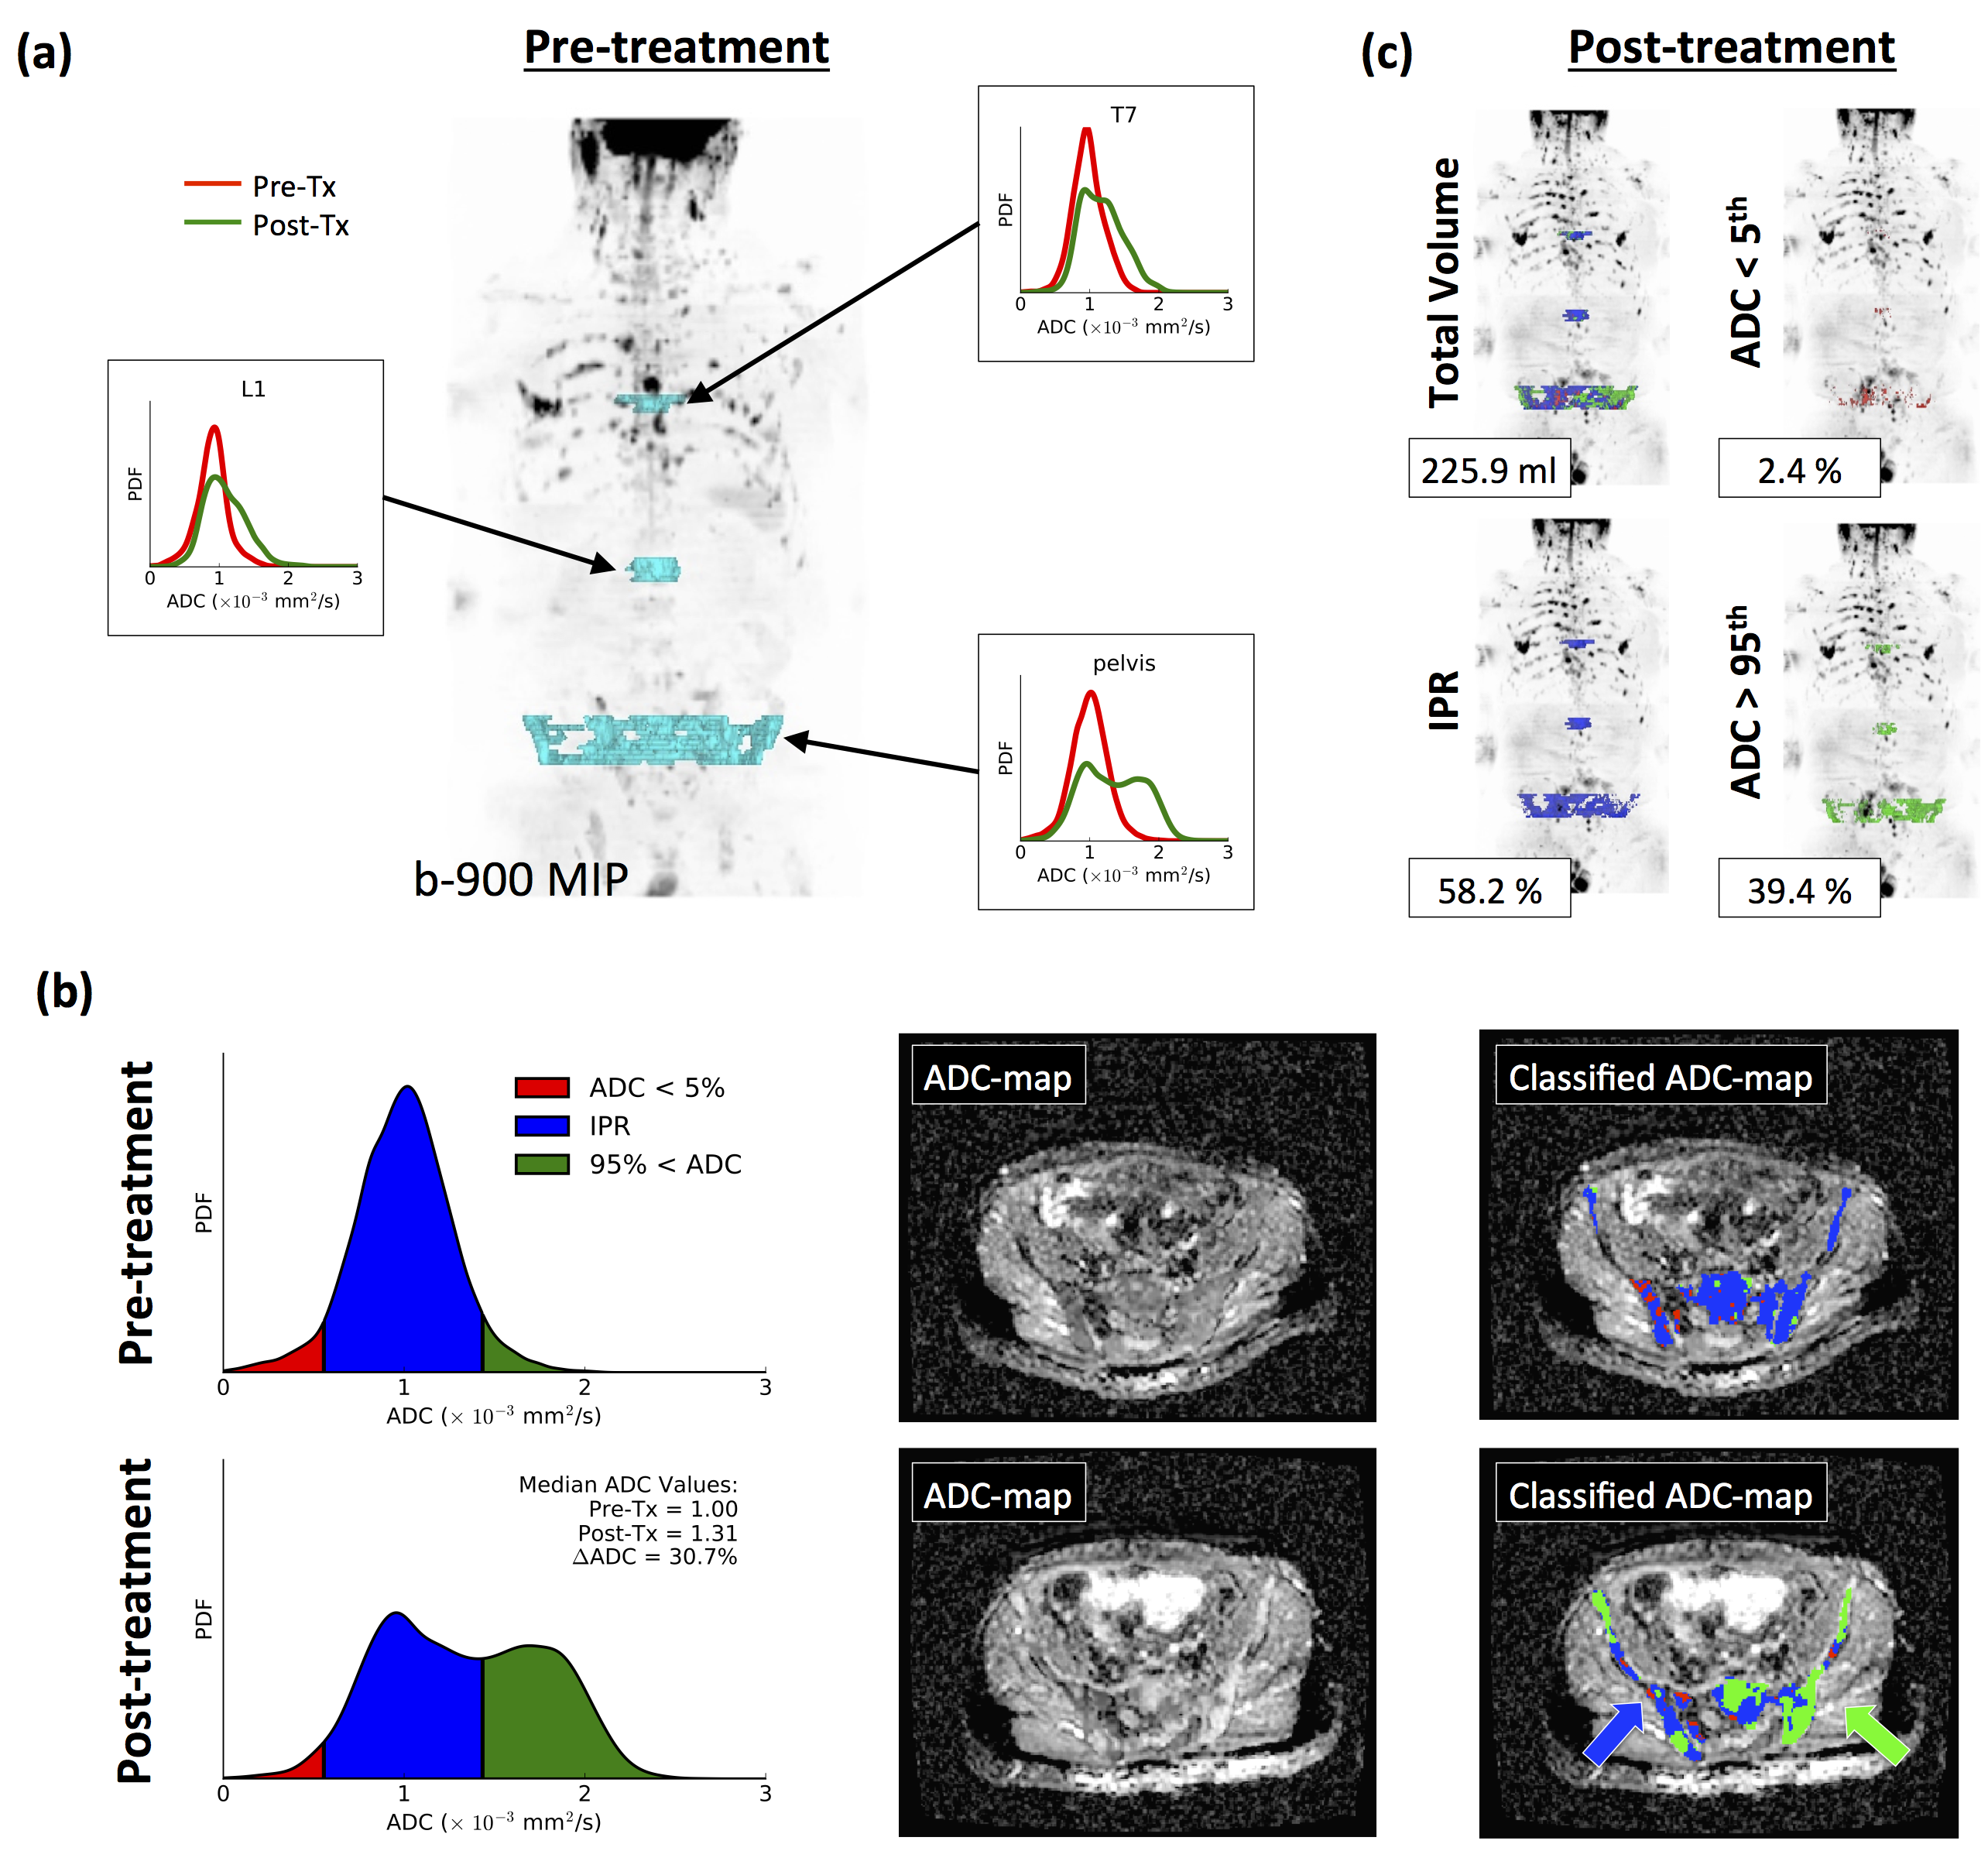
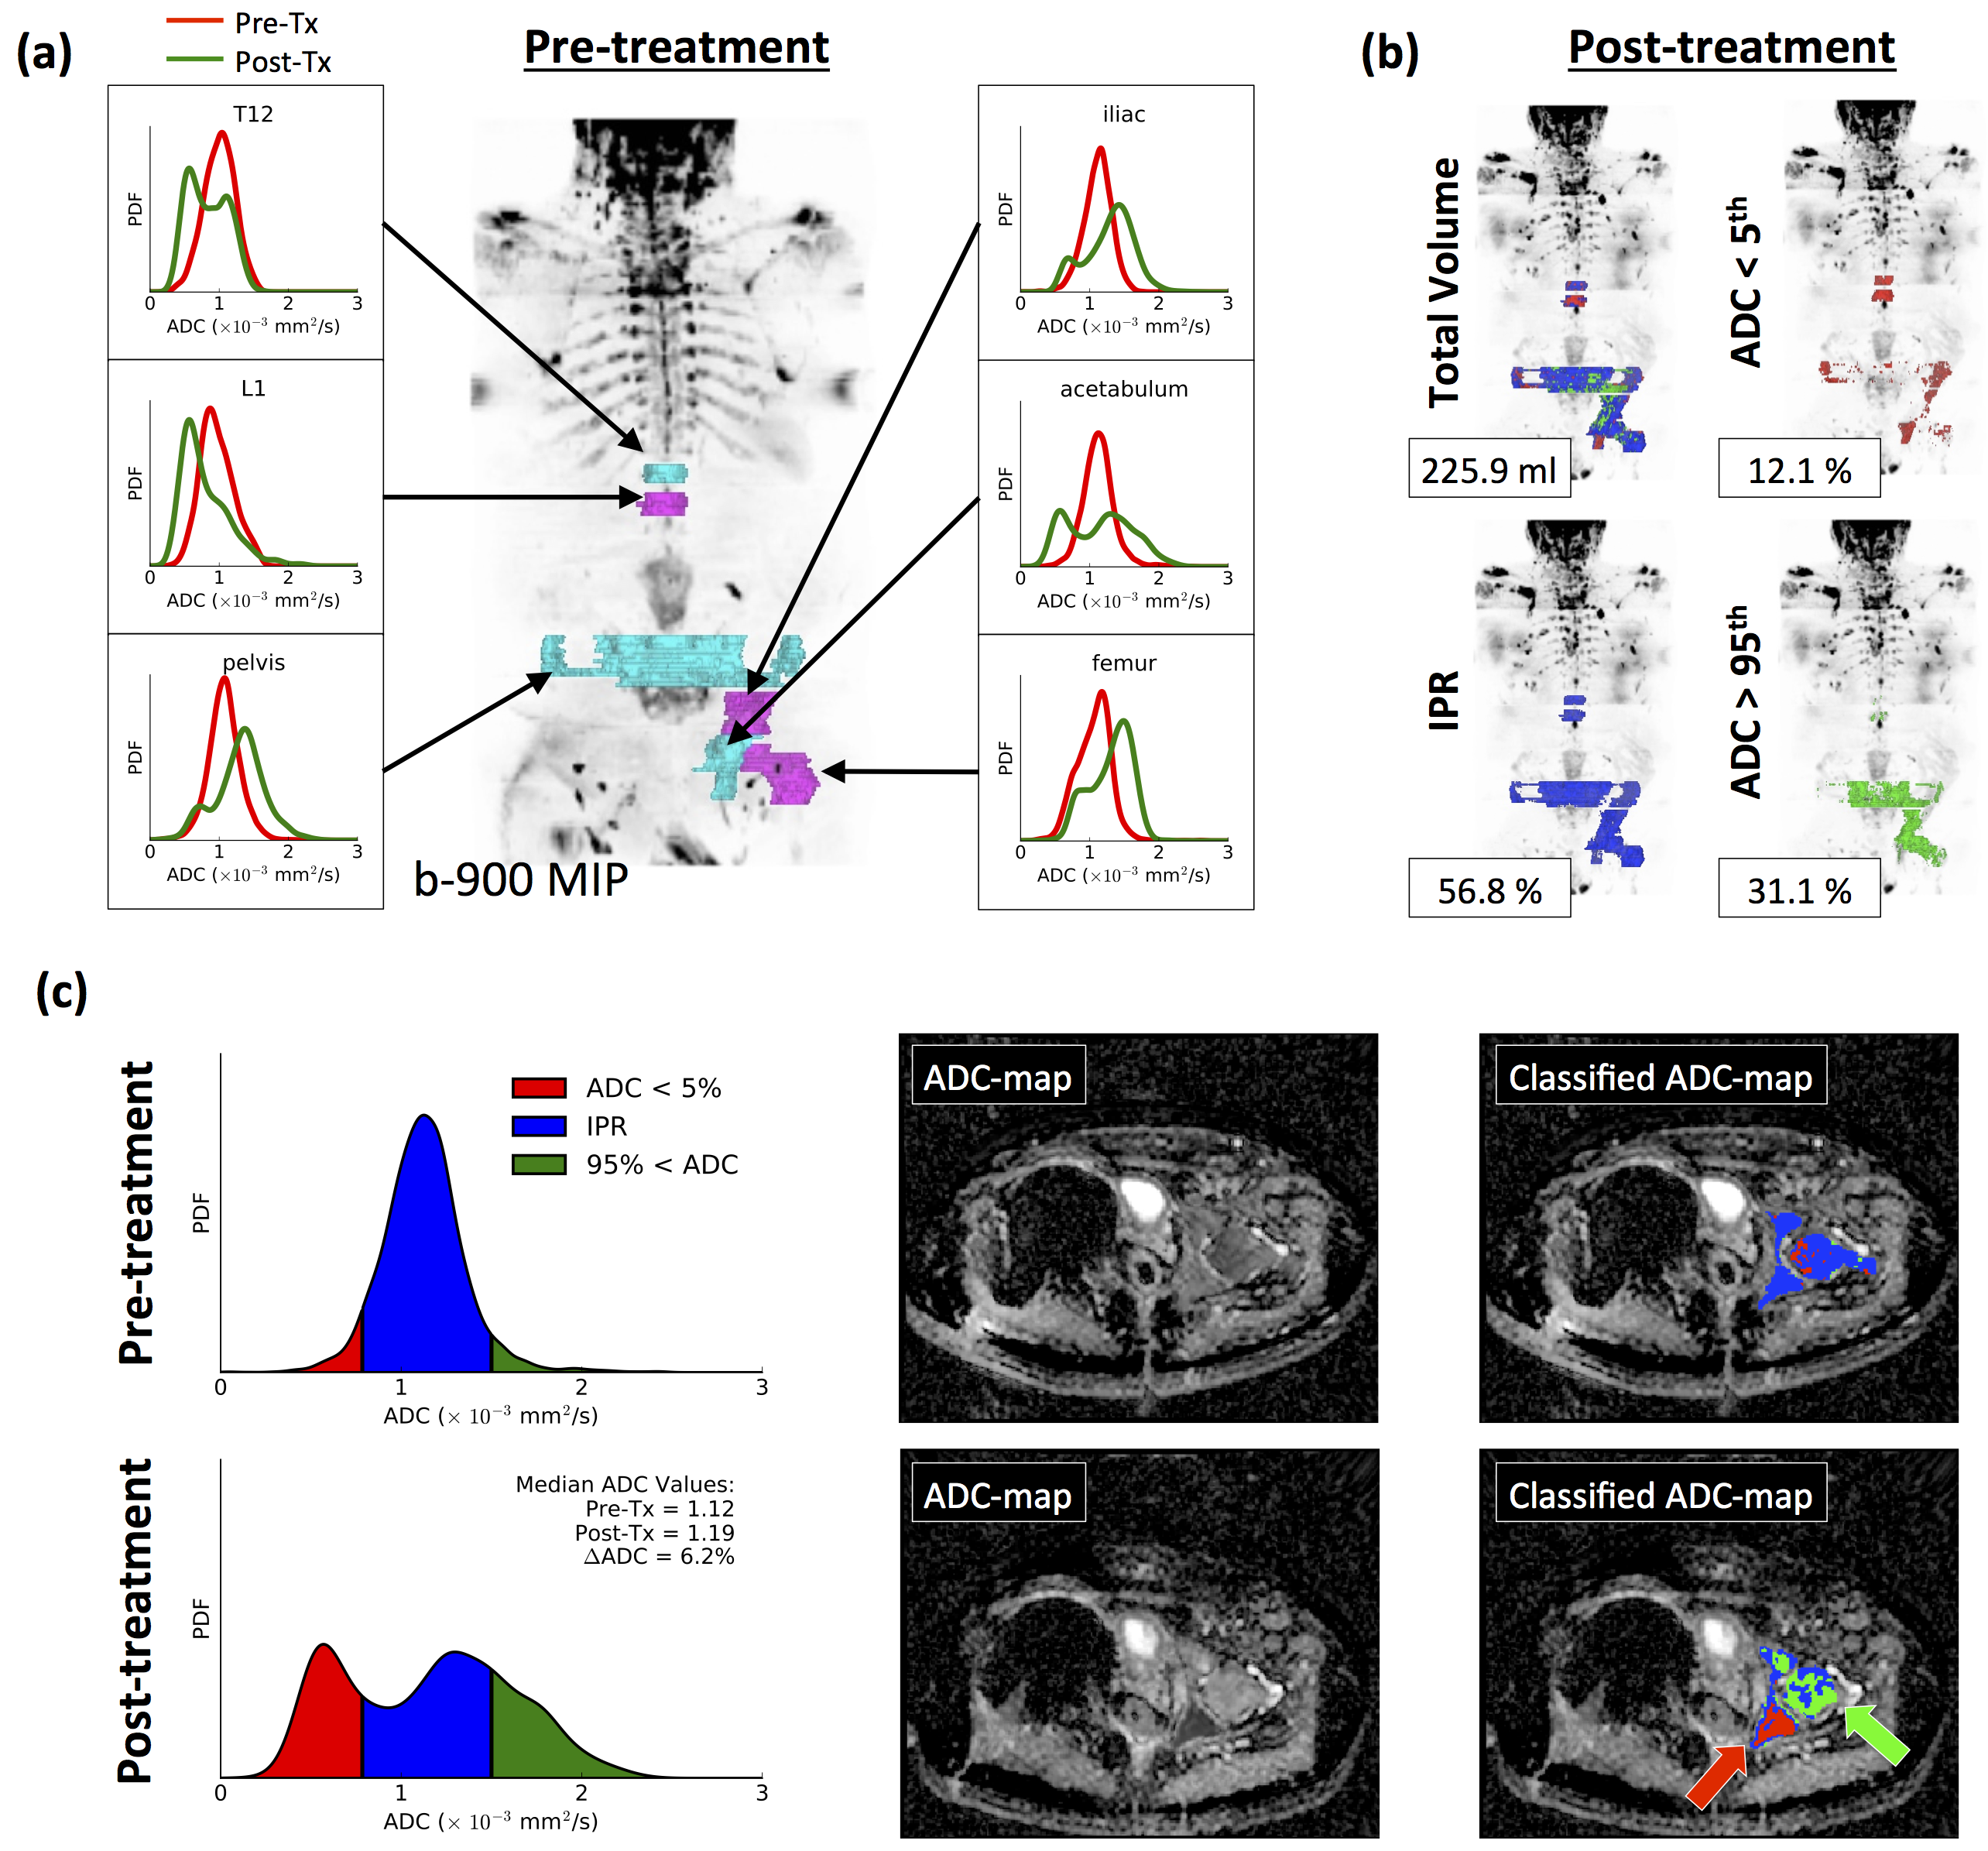
Eleven patients (Figure 1) who received Radium-223 as part of the patient’s access programme had baseline WBDW-MRI performed a maximum of 2 months after initiation of therapy, and then received a post-treatment, follow-up WB-DWI examination after administration of a minimum of 2 cycles of Radium. A radiologist with 8 years experience in reporting WBDW-MRI delineated areas of metastatic bone disease before and after treatment; metastases that were not present at baseline were not included in the analysis. For each lesion, the 5th and 95th percentiles of the pre-treatment distribution of Apparent Diffusion Coefficient (ADC) were calculated, providing classification thresholds for post-treatment ADC maps: ADC values above the pre-treatment 95th percentile were colour-coded green, those below the 5th percentile were coloured red and those within the inter-percentile range (IPR) were coloured blue. The proportion of pixels within each group, as a percentage of the total post-treatment delineated volume, was calculated (Figure 2), and compared to the pre-treatment distribution (no change would indicate 5% red, 90% blue and 5% green pixels). For each patient, PSA and ALP were recorded before and after treatment. The distribution of 5th and 95th percentiles for pre-treatment ADC measurements was also recorded for each tumour location to explore the potential for fixed reference ADC thresholds in future similar studies. Coexistence of the described categories in the same patient was classified as mixed behaviour: Any patient for whom at least one of the post-treatment ADC categories was present in 30-70% of voxels was considered to have mixed response.Results
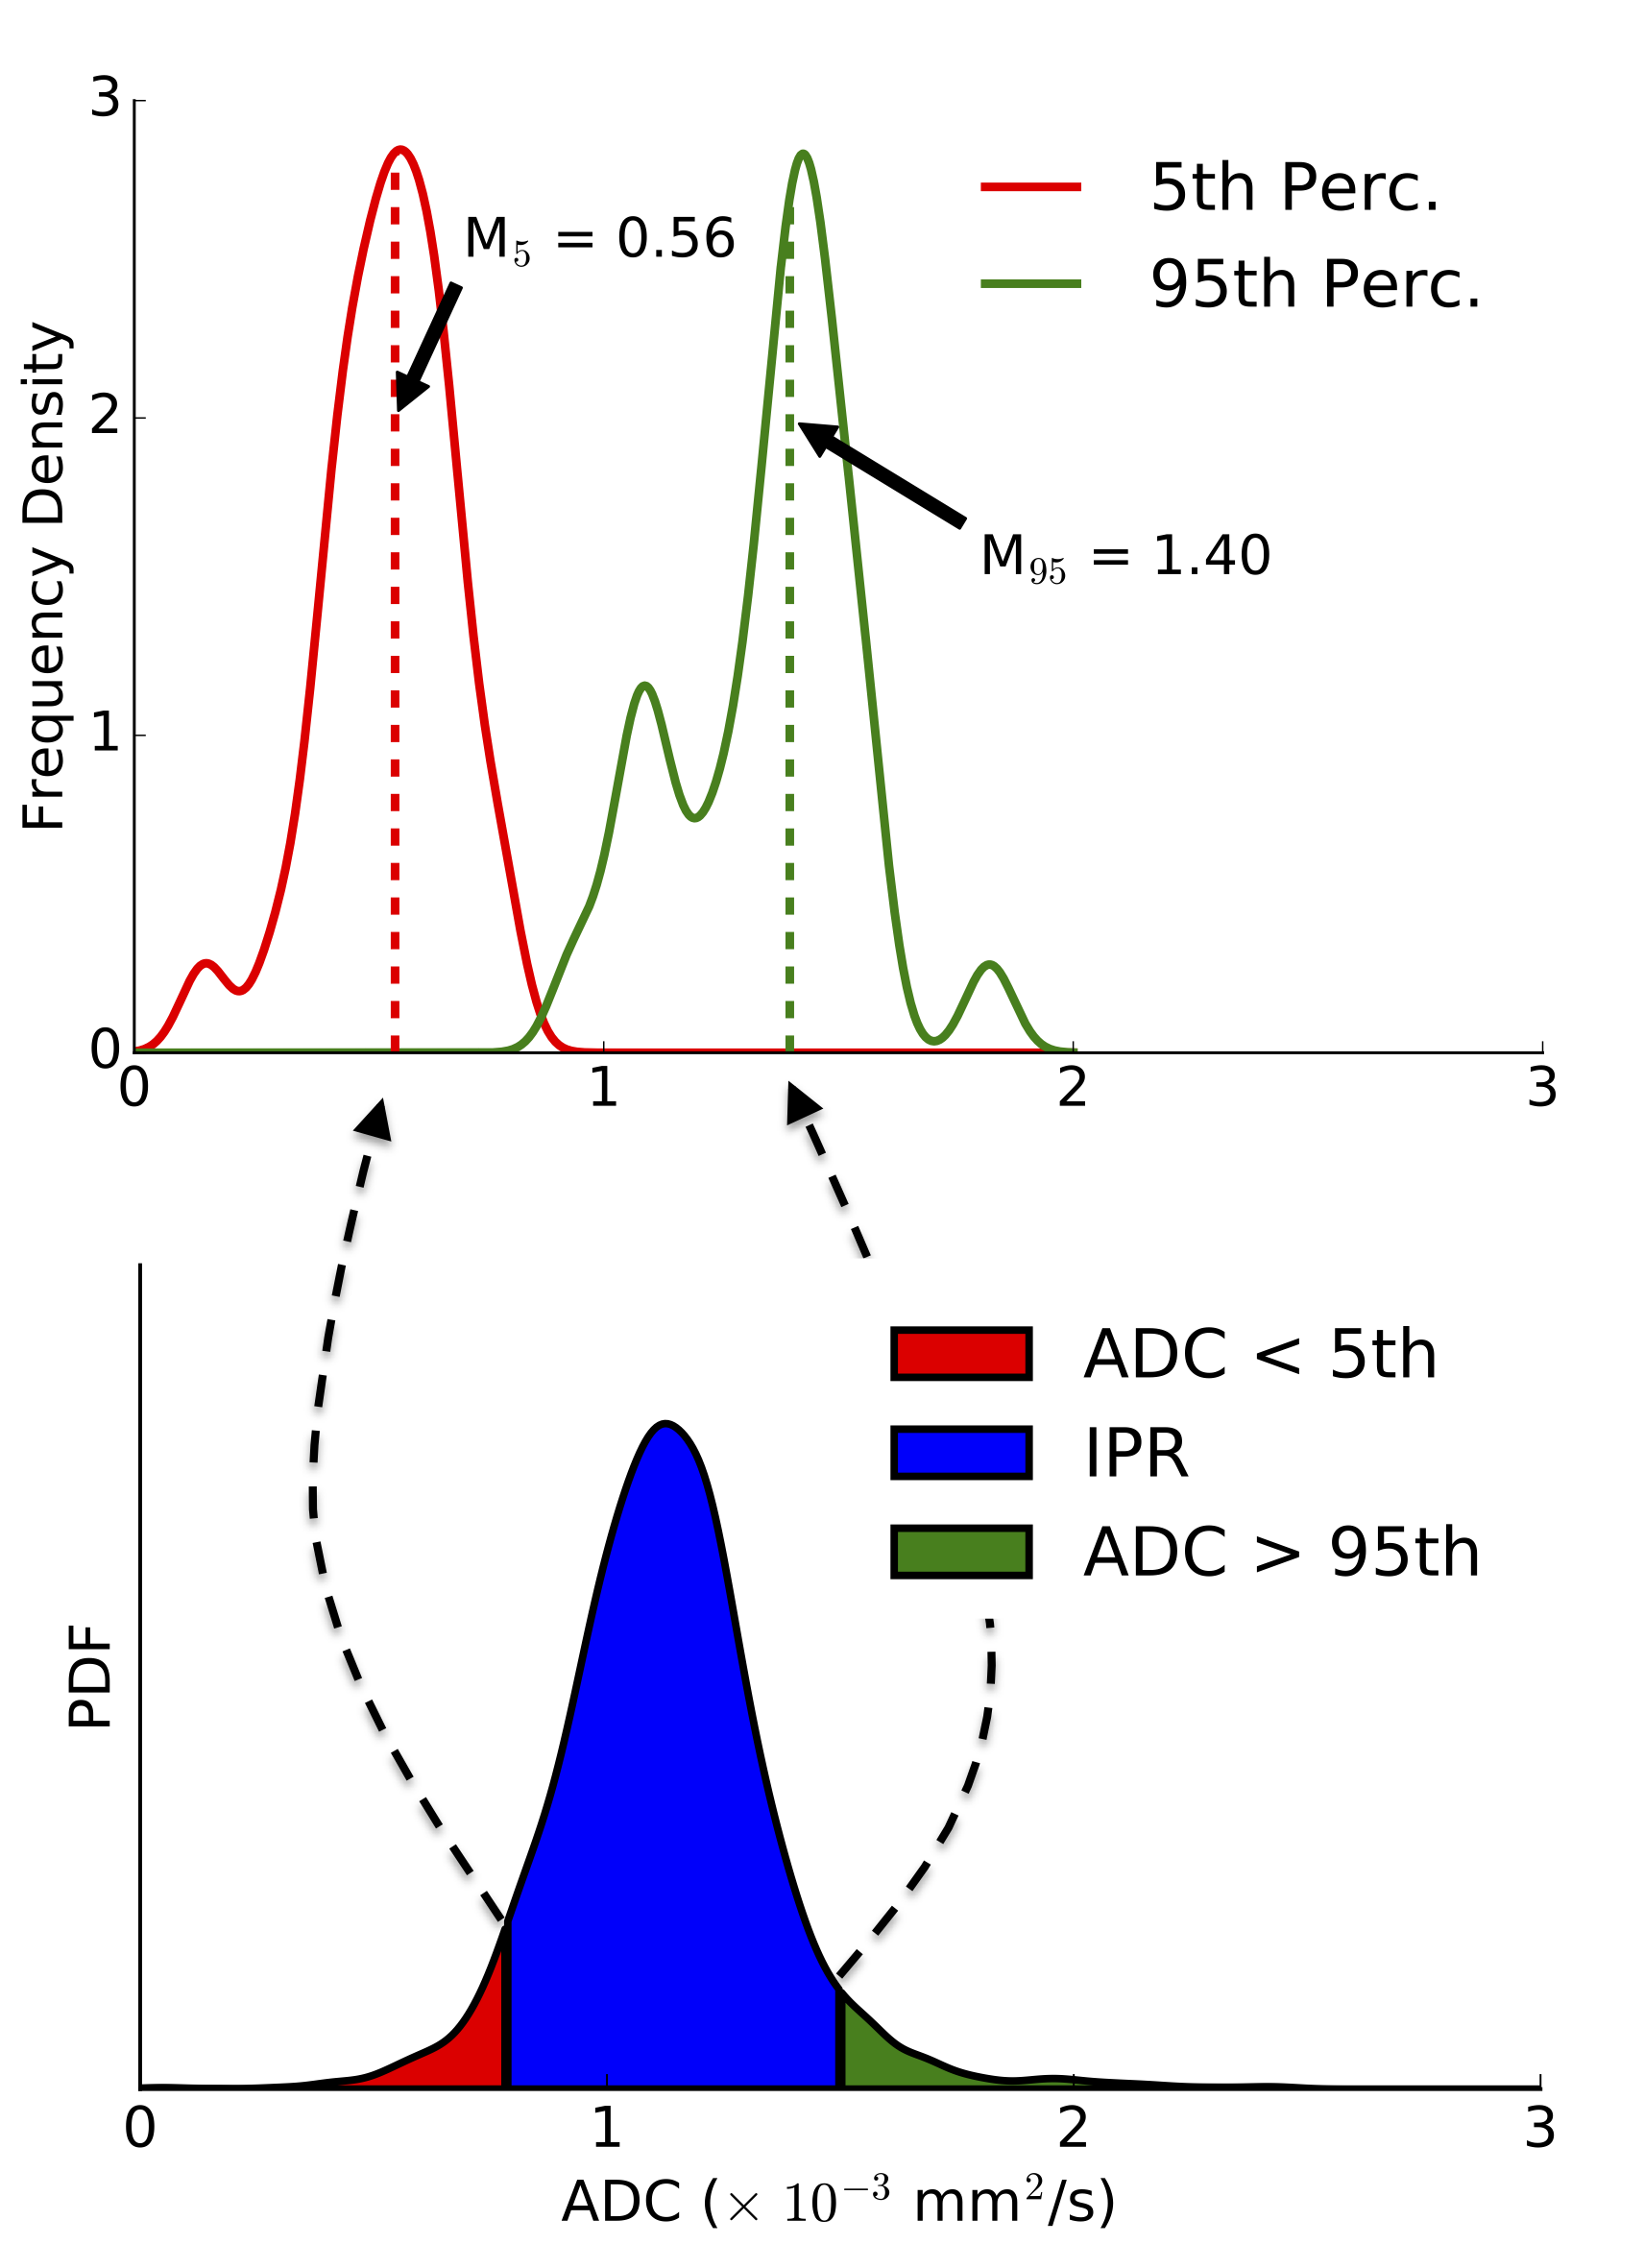
Figure 1 summarizes the overall ADC, ALP and PSA changes for each patient. We identified mixed behavior in post treatment ADC distribution in 5/11 patients. Furthermore 9/11 demonstrated a significant increase (> 30%) in the proportion of voxels classified with ADC higher than baseline; four of these patients showed a reduction in ALP values (suggestive of therapy response), whilst four of these patients showed a significant increase in PSA (> 50%) accompanied by new bone or visceral lesions. Figures 2 and 3 illustrate our methodology applied to two patients, both of whom were classified to have mixed response. These patients were classified by our methodology to have inter-lesion heterogeneity, but closer inspection of results also reveled significant levels of intra-lesion heterogeneity. Figure 4 illustrates the distribution of 5th and 95th percentiles for per-lesion pre-treatment ADC values in our population: The median of 5th and 95th percentile values was calculated to be 0.56 and 1.40 x 10⁻³ mm2/s respectively.Discussion
Our data require further exploration with regards to the merits of arbitrary thresholds versus population or individual lesion derived statistical inter-percentile changes and the correlation of these ADC thresholds with the clinical benefit. This in turn will need further validation in larger cohorts. These pilot data demonstrate that most Radium-223 administration is associated with an increase in ADC values in many of the treated bone lesions; also that mixed behavior with intra- and inter-lesion heterogeneity is a fairly common response pattern in patients treated with Radium-223. Detailed description of mixed response patterns could provide valuable information to clinicians for isolating areas of progression in patients who are no longer benefiting from mixed response to therapy. ThIs may also offer the opportunity of combination therapies, including both systemic and local treatment.
Acknowledgements
CRUK and EPSRC support to the Cancer Imaging Centre at ICR and RMH in association with MRC and Department of Health C1060/A10334, C1060/A16464 and NHS funding to the NIHR Biomedical Research Centre and the Clinical Research Facility in Imaging.References
1. Parker C. al. N Engl J Med 2013; 369: 213–223.
2. Blackledge M et al PLoS One. 2014 Apr 7;9(4):e91779
3. Padhani A. et al., Eur Urol. (2016), S0302-2838(16)30241-X
4. Scher HI et al. J Clin Oncol. 2016 Apr 20;34(12):1402-18.
Figures