1114
Supervised machine-learning enables segmentation and evaluation of heterogeneous post-treatment changes in multi-parametric MRI of soft-tissue sarcoma1Cancer Research UK Cancer Imaging Centre, The Institute of Cancer Research, London, United Kingdom, 2MRI Unit, The Royal Marsden NHS Foundation Trust, Sutton, United Kingdom, 3Department of Radiotherapy, The Royal Marsden NHS Foundation Trust, London, United Kingdom, 4Department of Surgery, The Royal Marsden NHS Foundation Trust, London, United Kingdom, 5Department of Histopathology, The Royal Marsden NHS Foundation Trust, London, United Kingdom
Synopsis
Multi-parametric MRI enables non-invasive response assessment in heterogeneous soft-tissue sarcomas, but evaluation of post-treatment changes in MRI parameters requires segmentation of cellular tumour-tissue, which might be expected to respond to treatment, from necrotic/cystic regions and fat. Six supervised Machine-Learning methods were explored using a randomized cross-validation approach, from which a candidate method (automatic Kernel Density Estimation) was selected owing to its high validation accuracy and automatic selection of hyper-parameters. The automatic-KDE method enabled evaluation of post-radiotherapy changes in volumes and ADCs of each tumour component, and provided visual depiction of heterogeneous changes in multi-parametric MR-images.
Background
Soft-tissue sarcomas are often highly heterogeneous tumours with variable components, including cellular tumour, fat, necrosis, and cystic change. Post-treatment changes often cannot be described by standard dimension-based imaging criteria, e.g. RECIST 1.1, as responding tumours may not change size after radiotherapy.1-3 Furthermore, accurate dimension-based response assessments are challenging in tumours containing mixed components, e.g. liposarcomas that may contain well-differentiated (fatty) and dedifferentiated (cellular) components. Multi-parametric MRI provides non-invasive methods for response assessment in non-resectable disease and in trials of non-surgical treatments, e.g. combined radiotherapy and systemic therapy. However, evaluation of average MRI parameters over the whole tumour volume may not reveal the full extent of heterogeneous post-treatment changes. Methods for monitoring and quantifying heterogeneous treatment response via multi-parametric MRI are therefore highly desirable.Purpose
To develop quantitative methods for evaluation of heterogeneous post-treatment changes in multi-parametric MRI of retroperitoneal sarcoma.Methods
Patients: 19 patients with retroperitoneal sarcoma were imaged before treatment, with written consent, as part of a prospective single-centre study. In 8 patients receiving pre-operative radiotherapy (50.4Gy in 28 fractions) another MR examination was performed 2-4 weeks after radiotherapy, before surgery; 11 patients were treated with surgery alone.
Imaging: Images were acquired using a 1.5T MR scanner (Aera, Siemens). Axial diffusion-weighted images (DWI, b-values=50,600,900 s/mm-2), Dixon-derived fat/water images, and T1-w images (17deg 3D FLASH) were acquired over the whole tumour volume. Maps of apparent diffusion coefficient (ADC) and fat-fraction (FF) were calculated from the DWI and Dixon images respectively. Four minutes after administration of Gd-based contrast agent (Dotarem, 0.2 ml/kg body-weight, 2 ml/sec), post-contrast T1-w images were acquired for estimation of enhancing fraction (EF=[Spost-Spre]/[Spost+Spre]).
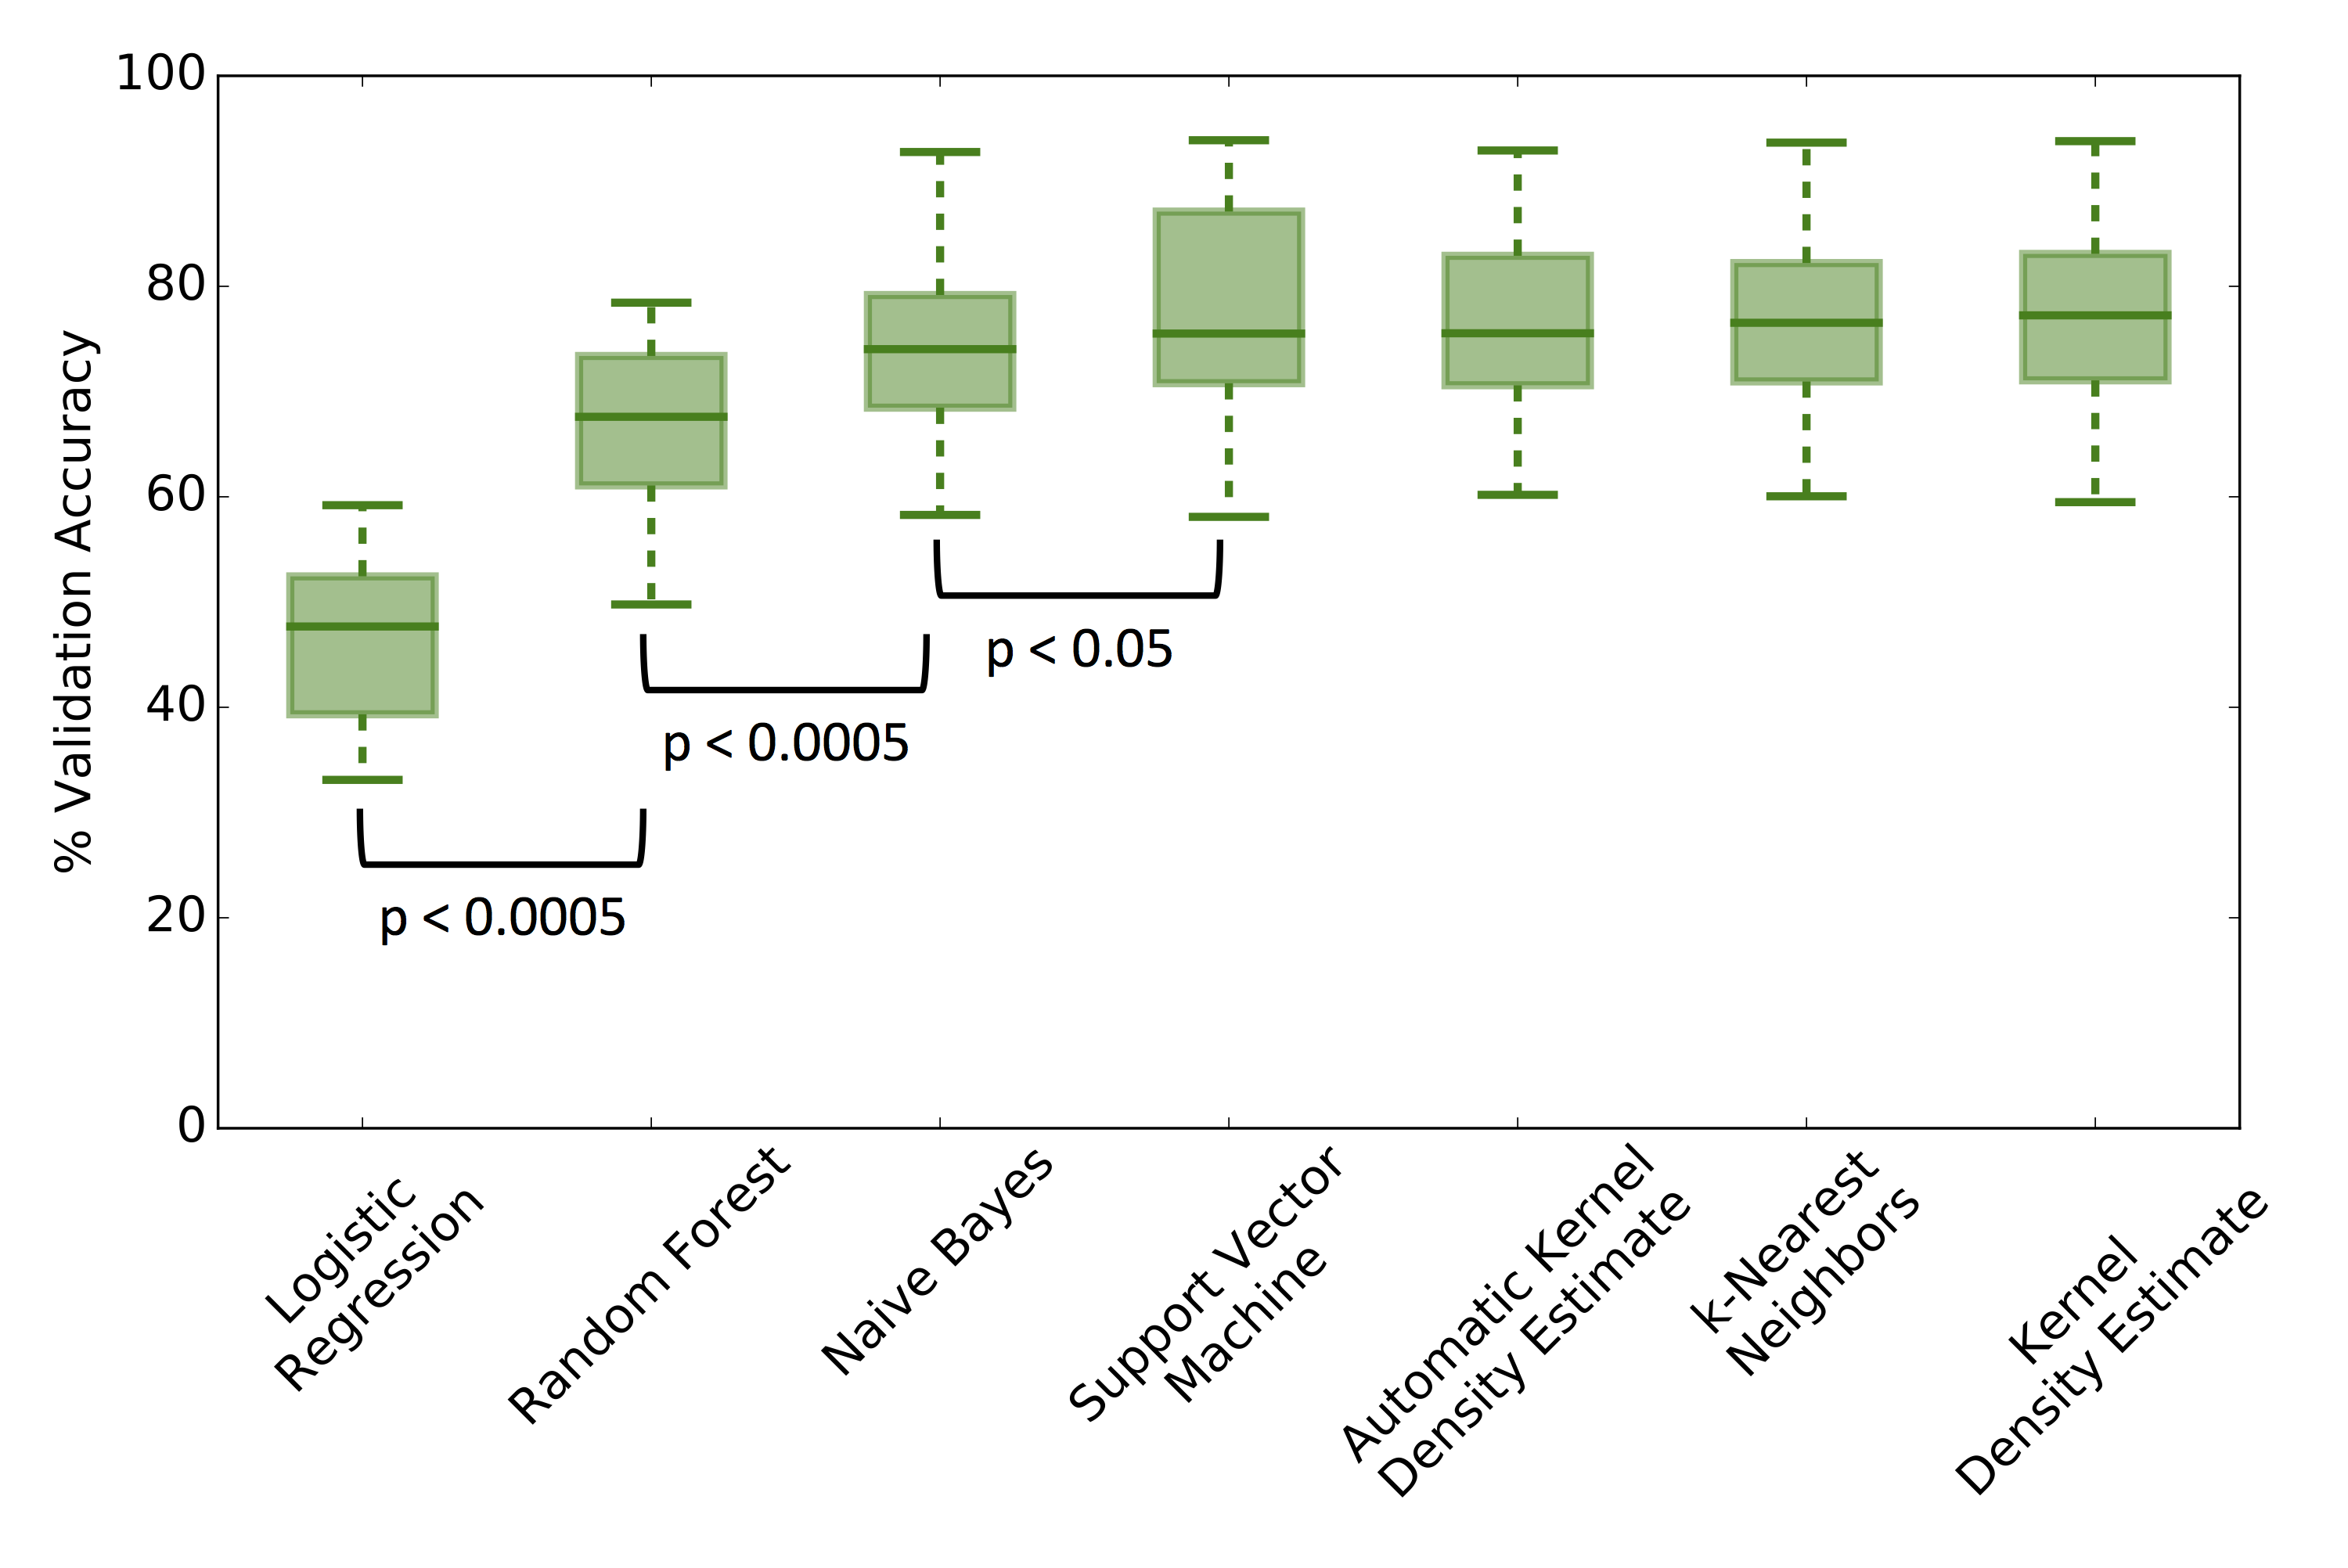
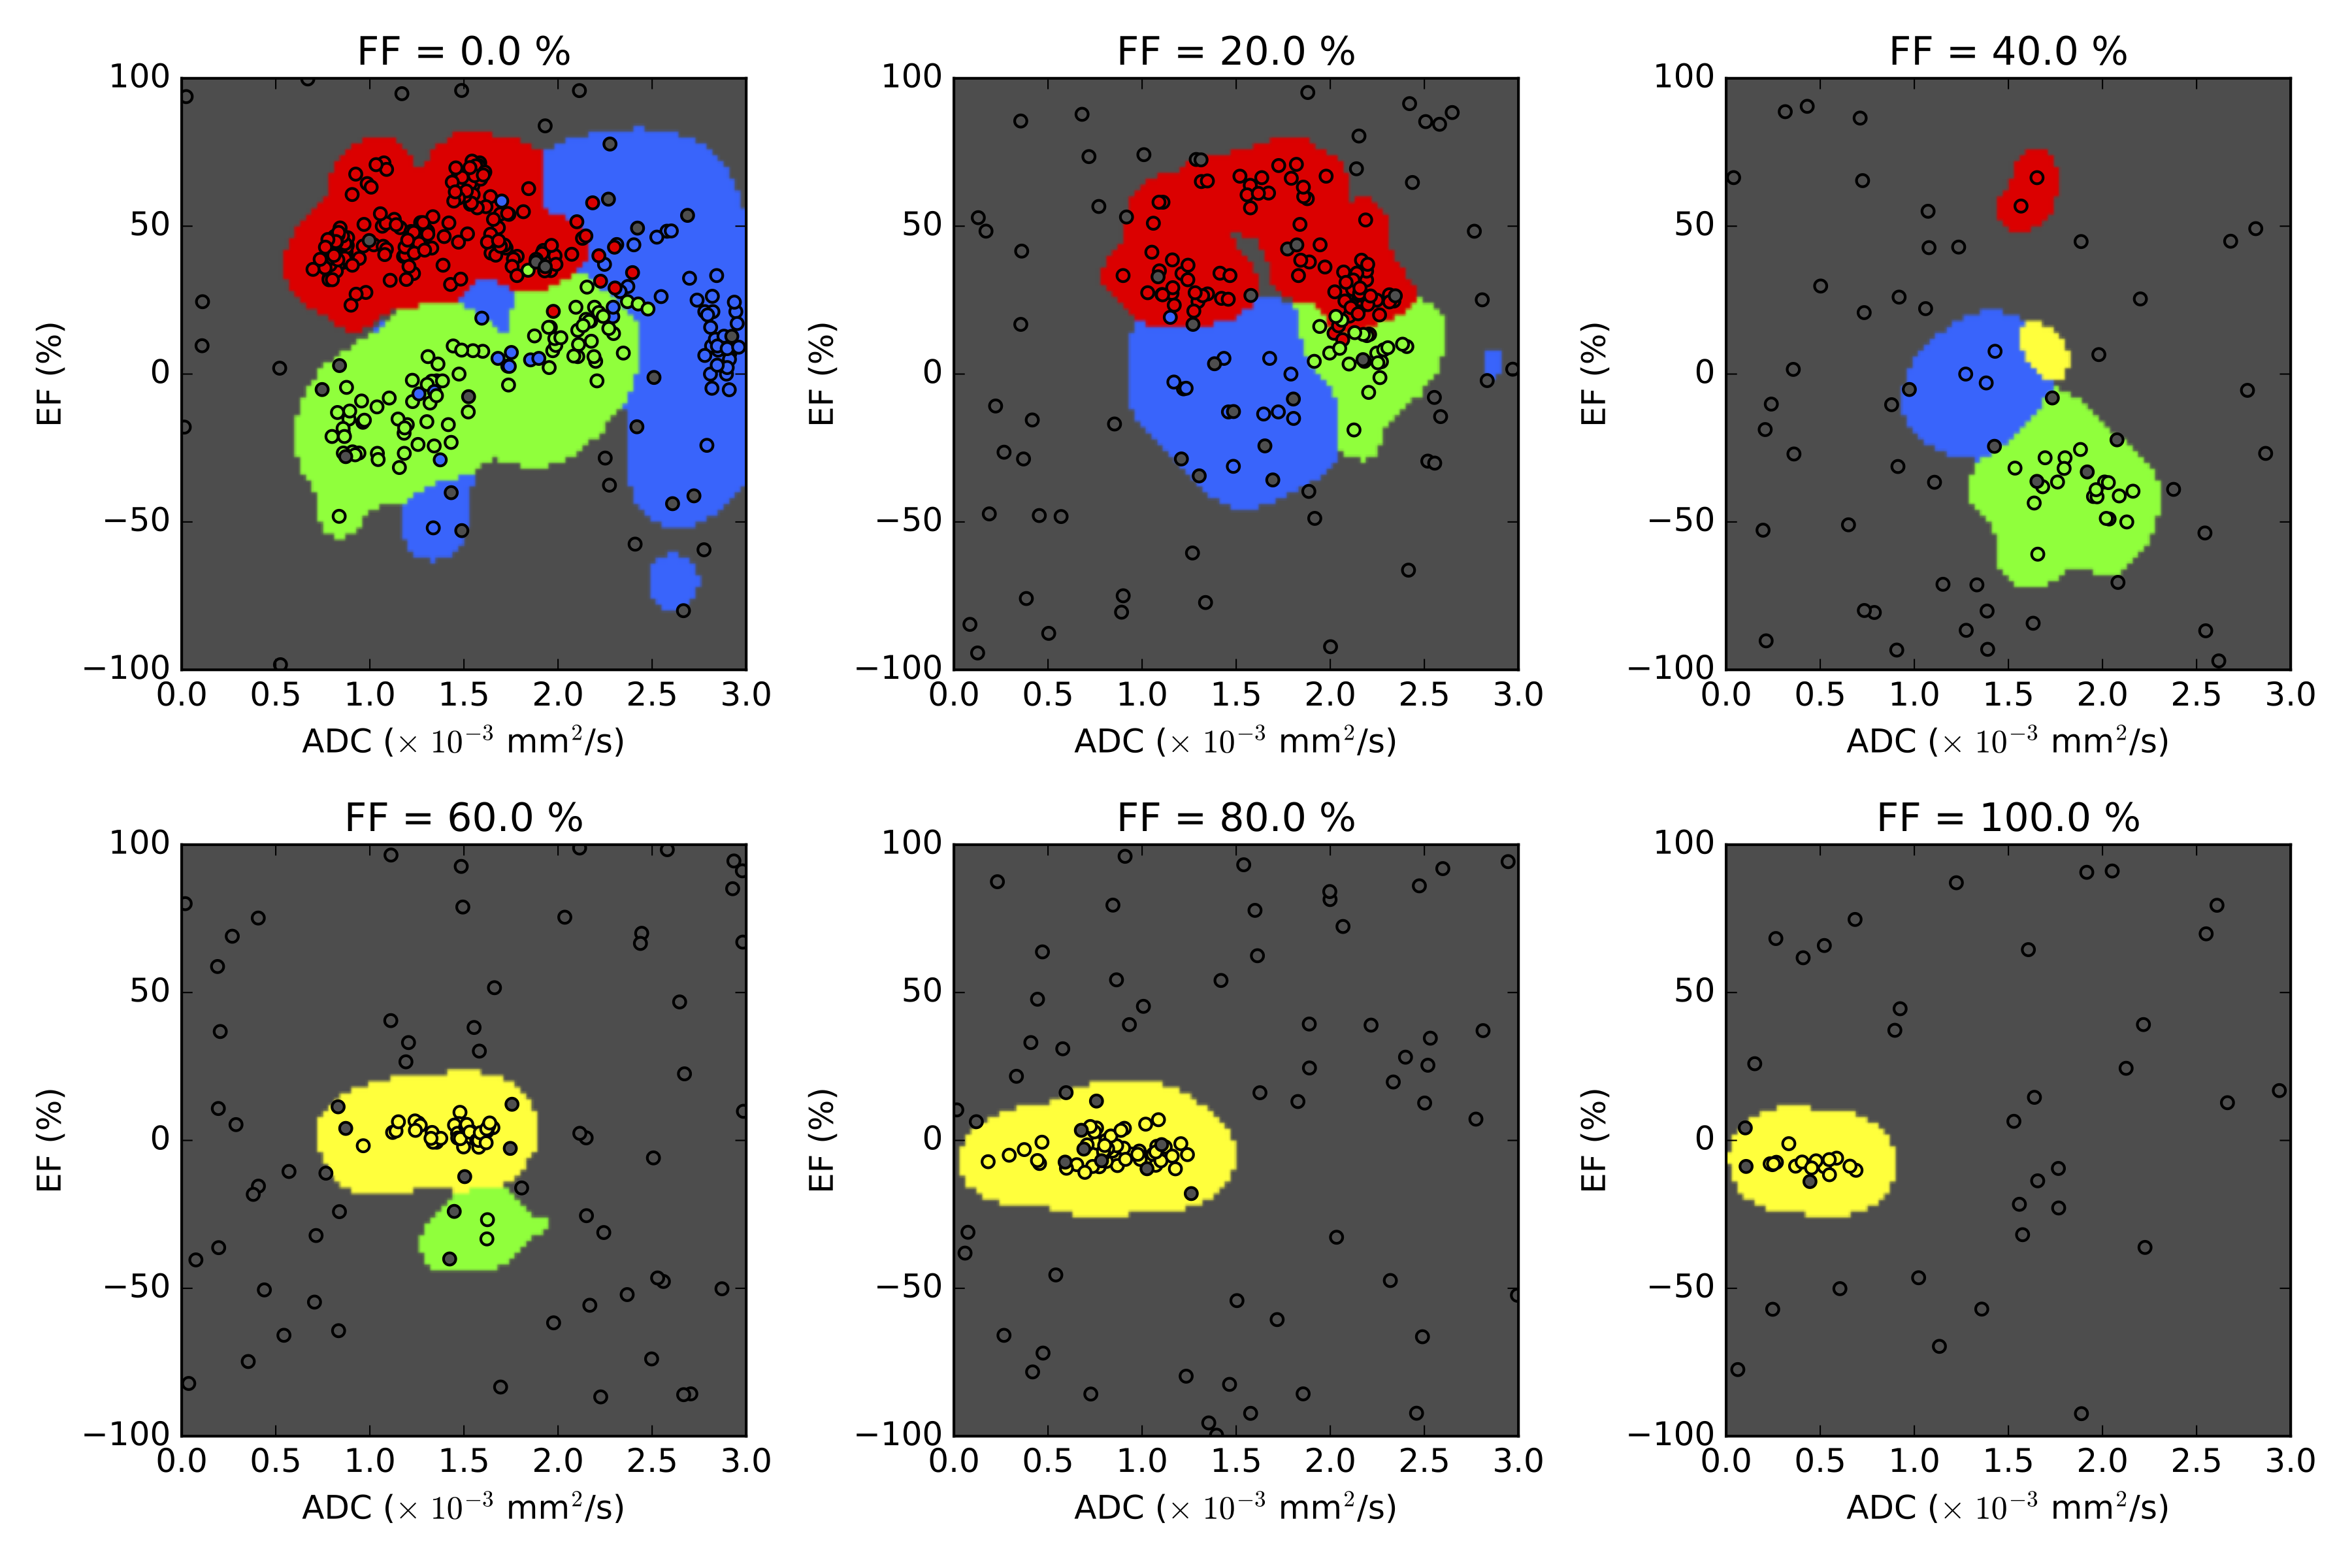
Analysis: Four tissue classes were defined, reflecting the aim of segmenting cellular tumour (classes 1 and 2), which might be expected to respond to treatment, from necrotic/cystic regions (class 3) and fat (class 4), which would not be expected to respond. The cellular tumour was further separated into enhancing (class 1) and non-enhancing (class 2), which may have different biological behaviours.3 Training data were defined by placing square ROIs (2 cm2) in regions that exemplified each class, at locations far from visible boundaries (Figure 1). Training ROIs were drawn by a clinical scientist and checked by a consultant radiologist. Between 1 and 4 ROIs were placed in each tumour depending on the classes present, providing a total of 33 ROIs. One tumour containing all four classes was reserved as a test-case; the 4 ROIs from this patient were not used in the training set. Six machine-learning (ML) techniques were evaluated in this preliminary supervised classification exercise (Scikit-Learn4): Logistic Regression (LR), Support Vector Machine (SVM, radial basis function), Random Forest (RF), k-Nearest Neighbour (kNN), Kernel Density Estimation (KDE) and Naïve-Bayes (NB). To ensure techniques were sensitive to novelties (pixels that do not represent any of the classes defined in this study), data for an additional 15 ROIs were synthesised by randomly sampling from a uniform distribution covering the intrinsic range of the parameters: EF∈[-100,100] (%), FF∈[0,100] (%), ADC∈[0,3] (10-3 s/mm2). A randomised cross-validation approach was employed to evaluate ML performance: Data from one ROI of each class was randomly selected without replacement to form a validation dataset. The ML method was then trained on the remaining ROIs and accuracy was evaluated on the validation set. This process was repeated 200 times to determine the accuracy distribution for a range of hyper-parameters; the optimal parameter gave the highest median validation accuracy. We also tested an automatic variant of the KDE method where bandwidths were selected using Silverman’s approximation5. Comparison between methods was achieved using a two-tailed Student’s t-test (p<0.05 for significance).
Results and Discussion
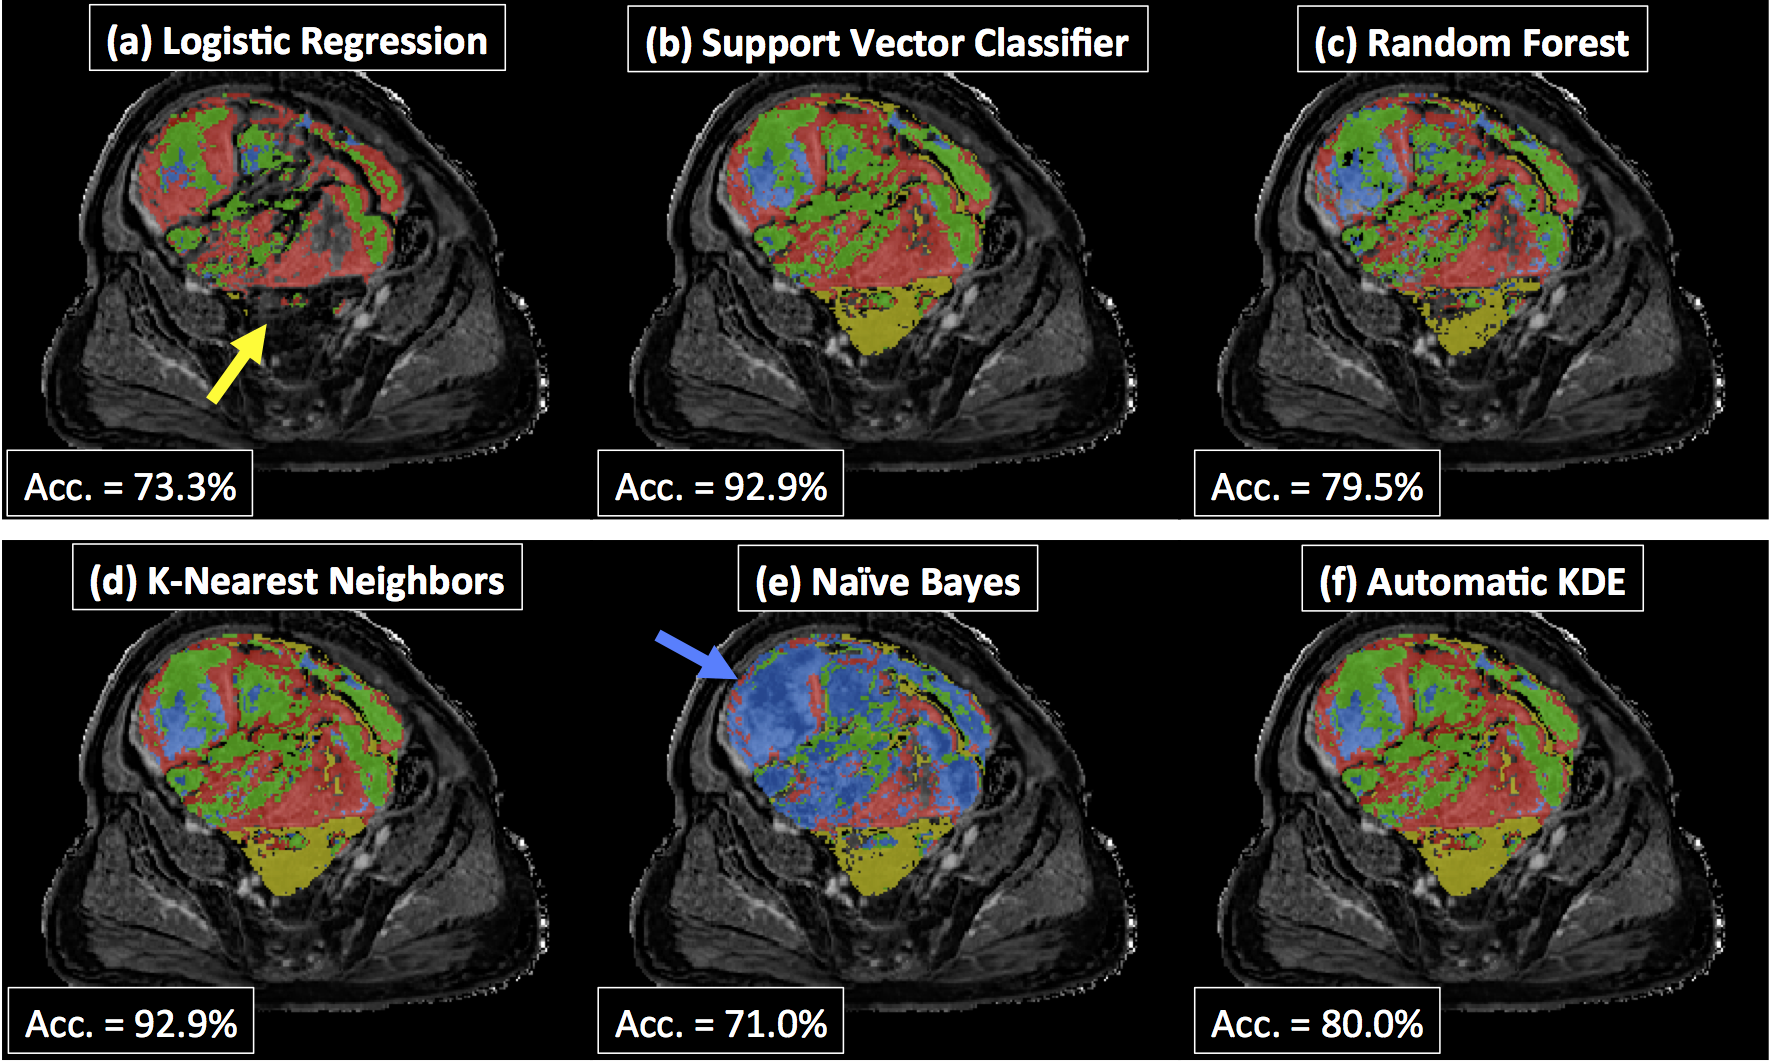
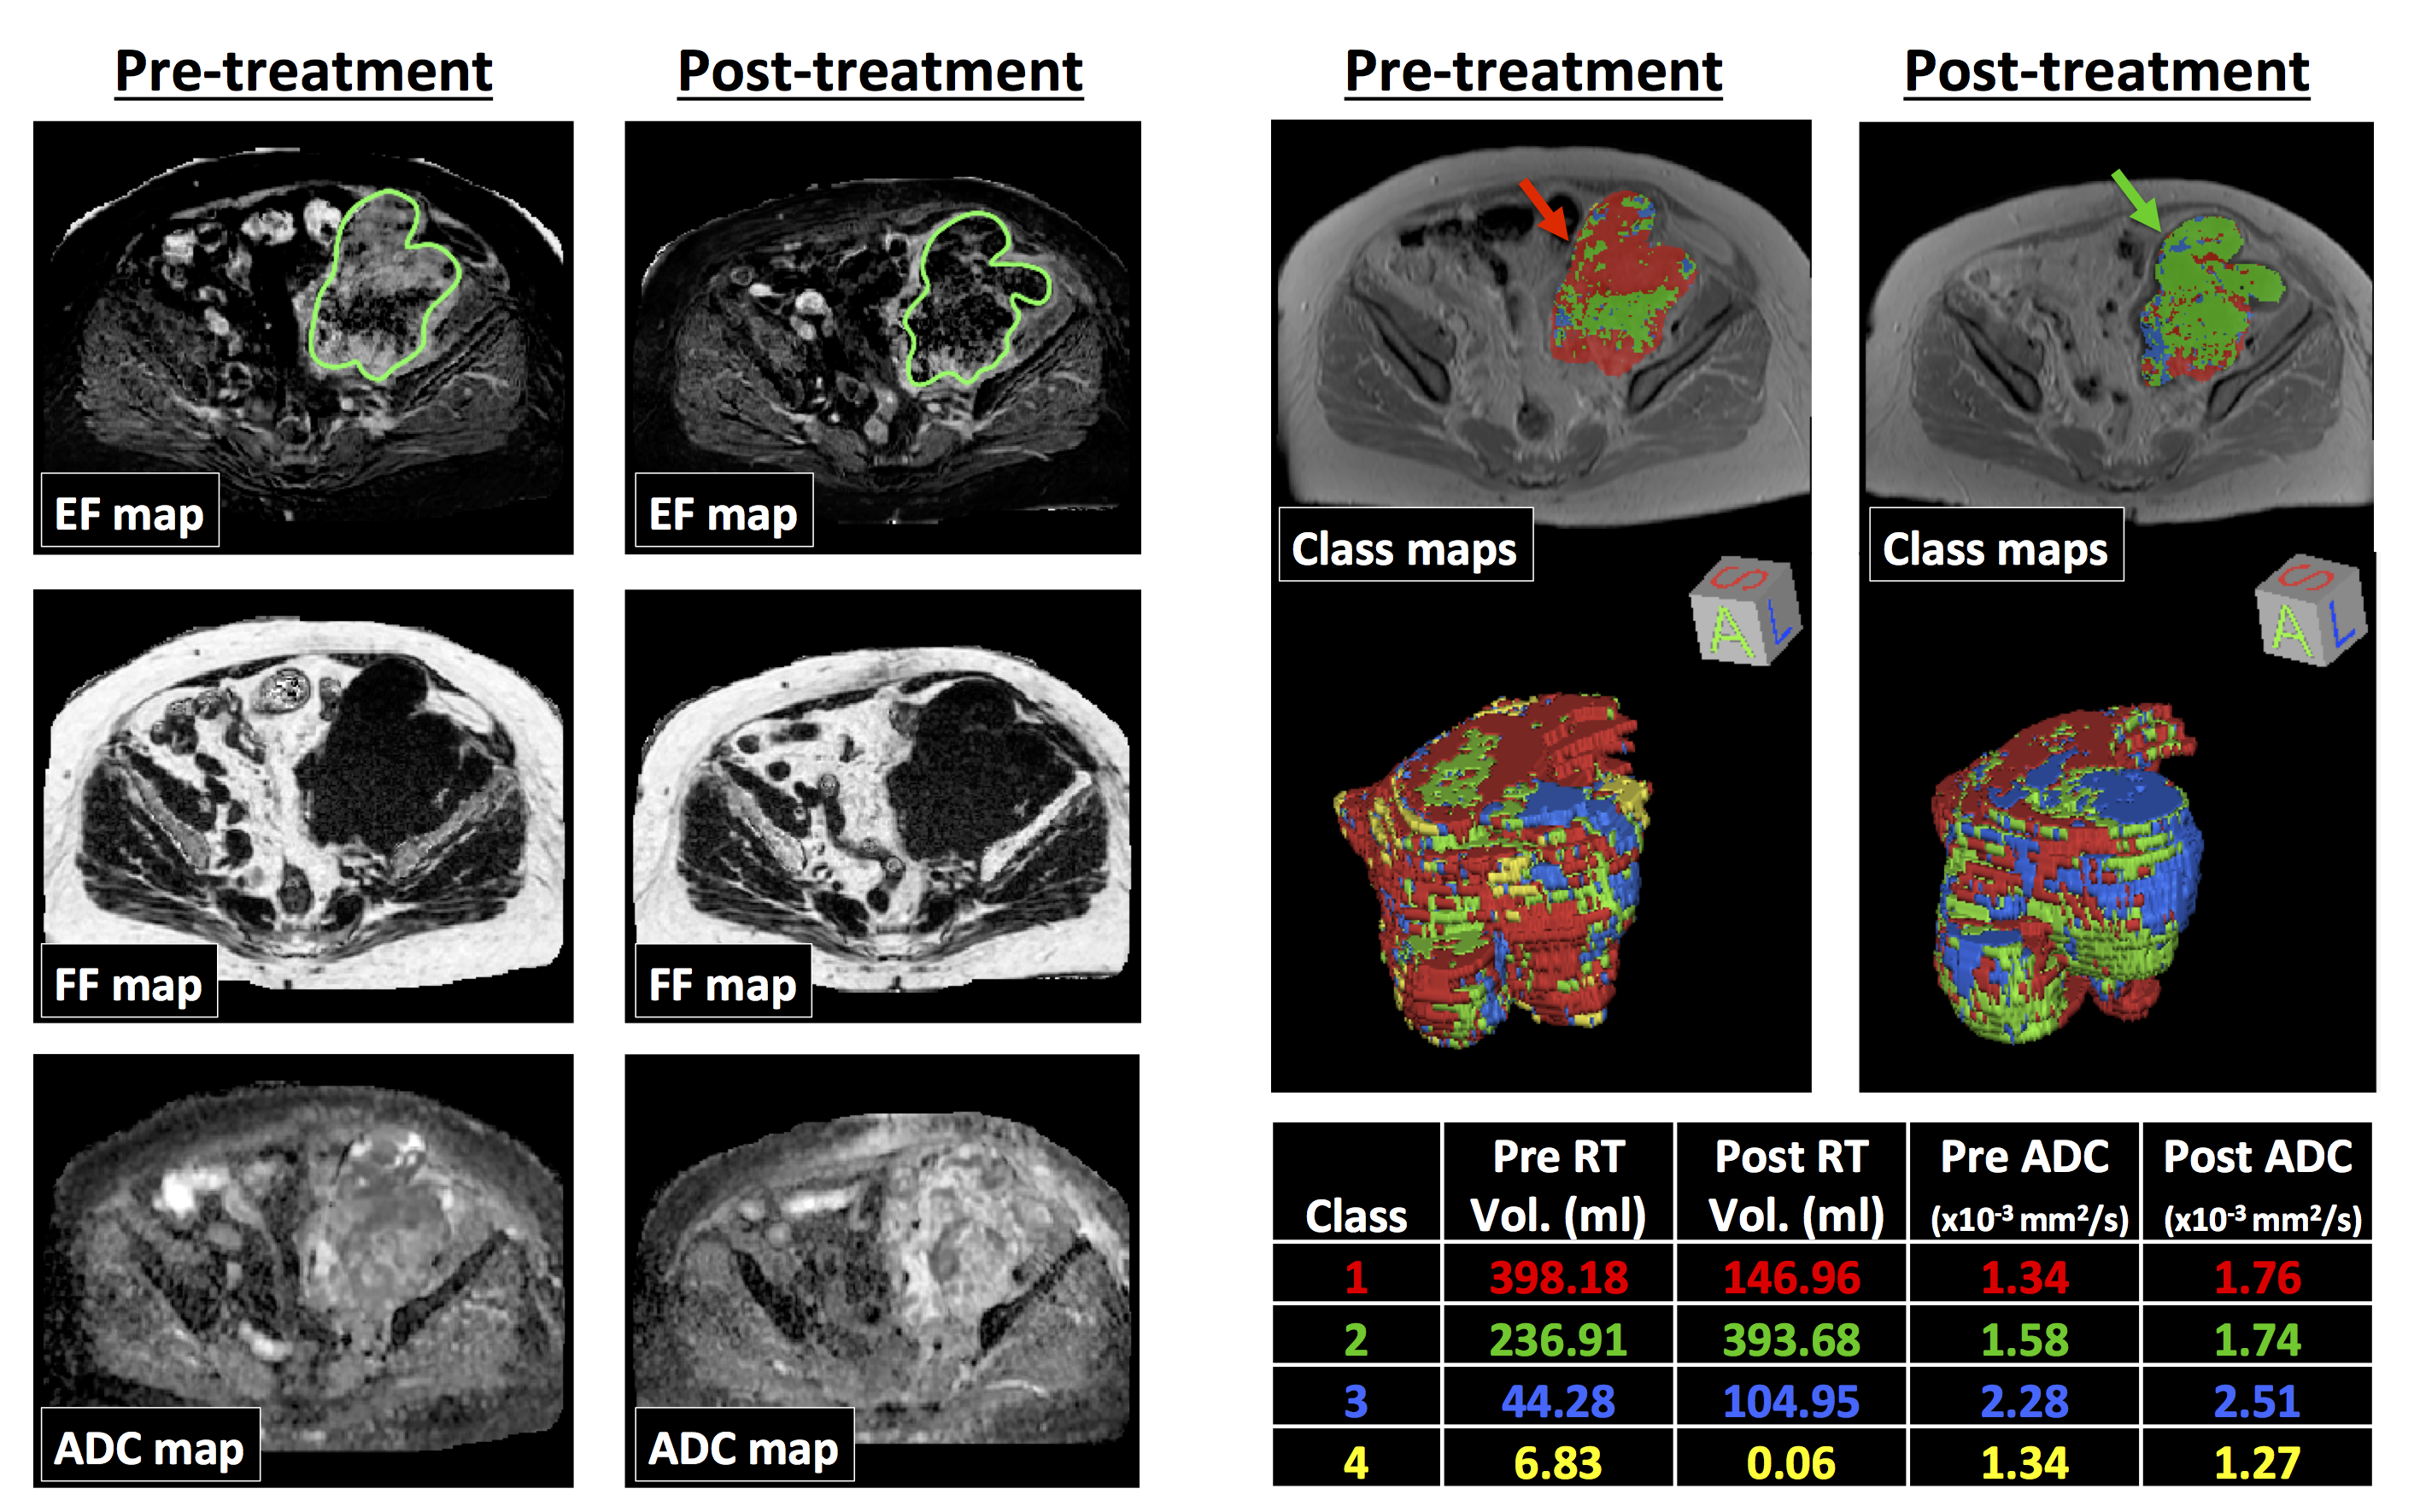
The validation accuracy with optimum hyper-parameters was equivalent for SVM (mean=76.8%, standard deviation=10.3), kNN (76.8,10.4), NB (74.2,10.3), KDE (77.2,10.6) and automatic KDE (76.3,9.8) methods (Figure 2). The performance of both RF (66.5, 8.5) and LR (46.4,8.7) classifiers was significantly poorer (p<0.0001). When evaluated on the test patient, both LR and NB approaches appeared to fail (Figure 3), which may be attributed to the complicated decision-space required for this machine-learning task (Figure 4). The automatic KDE was selected for further evaluation owing to the fact it scored as highly as the optimized methods but did not require definition of hyper-parameters, and tested in one patient to evaluate heterogeneous changes following radiotherapy (Figure 5); this example demonstrated a reduction in the volume of class 1, but an increase in volumes of classes 2 and 3 following treatment.Conclusion
Supervised machine-learning approaches to tissue classification in multi-parametric MR-imaging of soft-tissue sarcomas provide quantitative evaluation of heterogeneous tissue changes following radiotherapy.Acknowledgements
CRUK and EPSRC support to the Cancer Imaging Centre at ICR and RMH in association with MRC and Department of Health C1060/A10334, C1060/A16464 and NHS funding to the NIHR Biomedical Research Centre and the Clinical Research Facility in Imaging.References
1. Canter R et al. Ann Surg Oncol 2010;17:2578-2584.
2. Roberge D et al. Radiother Oncol 2010;97:404-407.
3. Messiou C et al. Eur J Cancer 2016;56:37-44.
4. Pedregosa F et al. JMLR 2011;12:2825-2830.
5. Silverman B. Chapman & Hall 1986; isbn:0412246201
Figures
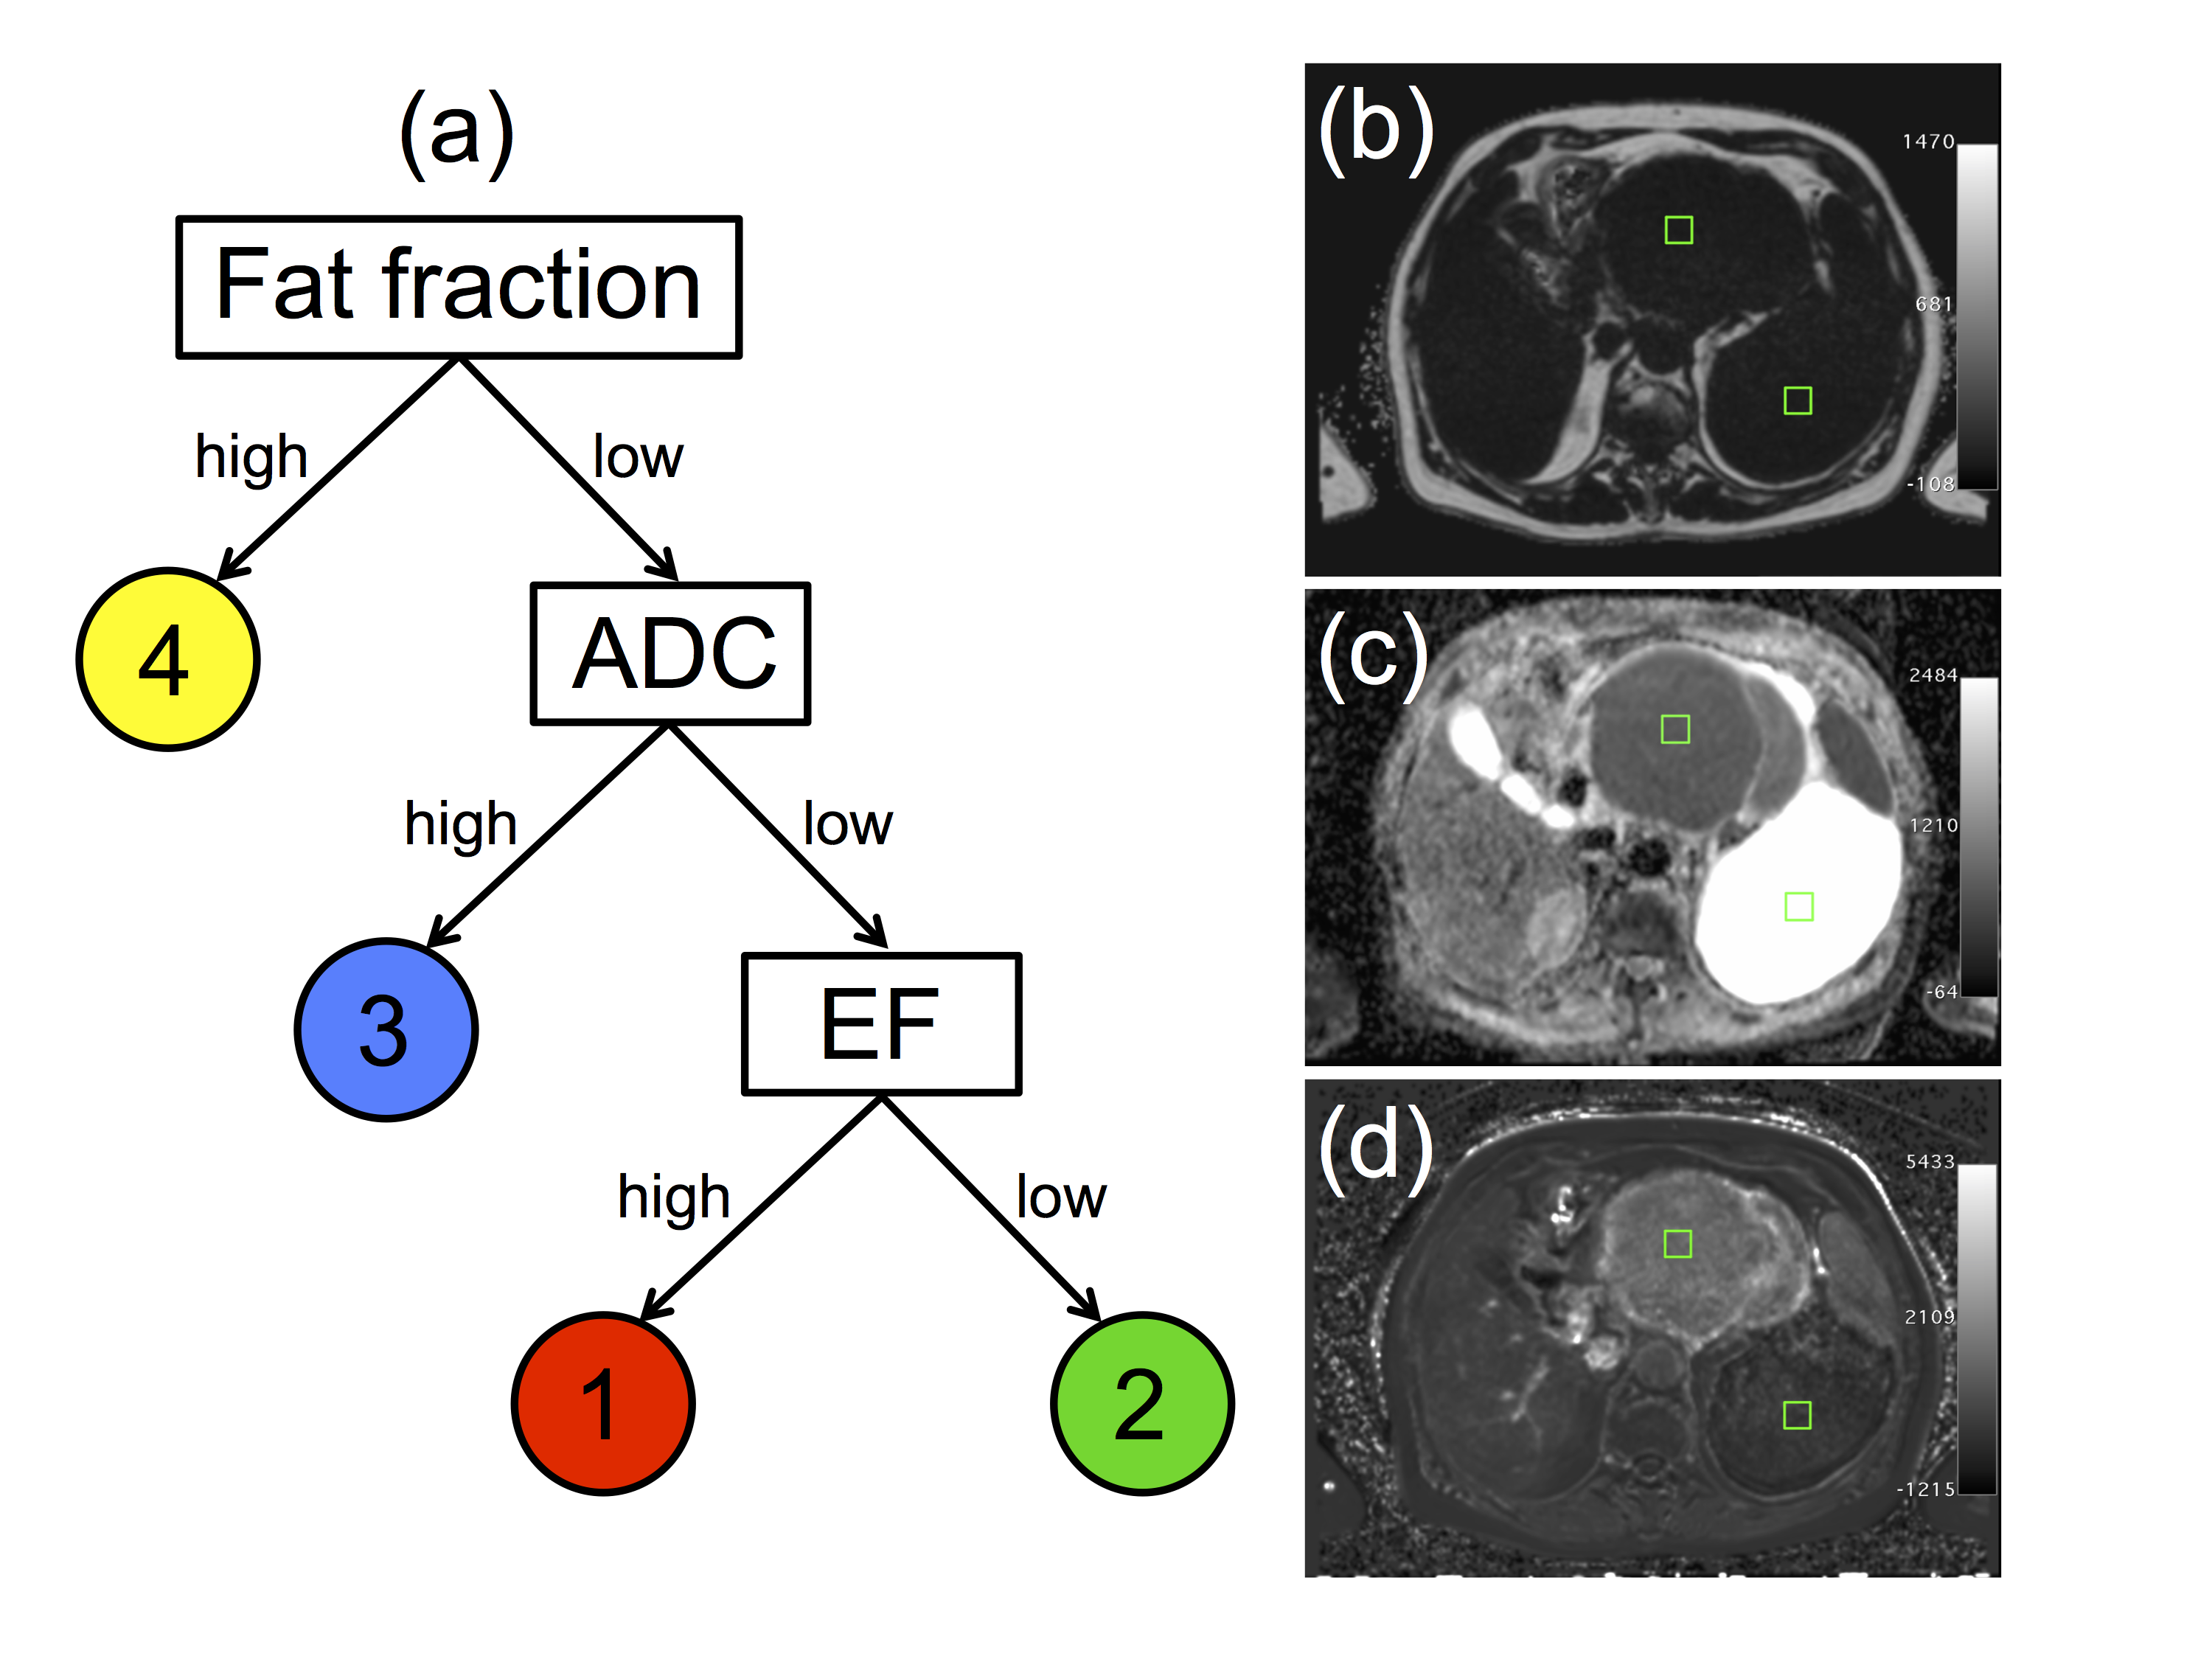
(a) Decision tree used to define classes 1 (water-based, low ADC, enhancing), 2 (water-based, low ADC, non-enhancing), 3 (water-based, high ADC), and 4 (fat). Classes 3 and 4 were not further divided as cystic/necrotic regions and fat do not enhance in post-Gd images. ADC is not evaluable in fat-suppressed DWI.
Right-hand side: images from one patient with a dedifferentiated liposarcoma showing examples of training ROIs positioned in regions corresponding to class 1 (anterior) and class 3 (posterior). Training ROIs (green squares, 2cm2) are shown on (b) fat fraction map, (c) ADC map, (d) enhancing fraction (EF) map.