1113
Radiomic Analysis Differentiates between True Progression and Pseudo-progression in Glioblastoma patients: A Large Scale Multi-institutional Study1Diagnostic Radiology, MD Anderson Cancer Center, Houston, TX, United States, 2Cancer Systems Imaging, MD Anderson Cancer Center, Houston, TX, United States, 3Neuro-Oncology, MD Anderson Cancer Center, Houston, TX, United States, 4Neuroradiology, Baylor College of Medicine, Houston, TX, United States, 5Neuroradiology, University of Southern California Keck Medical Center, Los Angeles, CA, United States, 6Neurosurgery, Baylor College of Medicine, Houston, TX, United States
Synopsis
The benign treatment-related imaging changes may pose a challenge in appropriate clinical decision making for the neuro-oncologists. The post-treatment changes are usually benign and differ largely in management approach from a progressive tumor. In this study, 304 glioblastoma patients were evaluated retrospectively to study the ability of radiomic analysis to distinguish the post-treatment changes from a truly progressive disease. 3D volumetrics using 3D Slicer 4.3.1 and texture analysis of the lesions were performed. On LOOCV, sensitivity and specificity of 97% and 72% were obtained respectively. We concluded that radiomics can differentiate between the progressive disease and pseudo-progression in glioblastoma patients.
PURPOSE
Treatment-related imaging changes can occur as a result of multiple factors such as surgery/treatment related inflammation, chemoradiation effects, and radiation necrosis1. These post-treatment changes are often difficult to distinguish from true progression of the tumor using conventional MRI1. Treatment-related changes or pseudoprogression (PsP) subsequently subside or stabilize without any further treatment, whereas progressive tumor requires a more aggressive approach in patient management. Pseudo-progression can mimic true progression radiographically and may potentially alter the physician’s judgement about the residual disease. Hence, it can predispose a patient to overtreatment or be categorized as a non-responder and exclude him from the clinical trials. Radiomic texture analysis results in the quantification of grey tone spatial variation thereby providing textural features that characterize the underlying structure of the object under investigation2. MR based texture analysis features have been previously described and have also been linked with tumor heterogeneity3. This study aims at assessing the potential of radiomics to discriminate PsP from progressive disease (PD) in glioblastoma (GBM) patients.METHODS AND MATERIALS
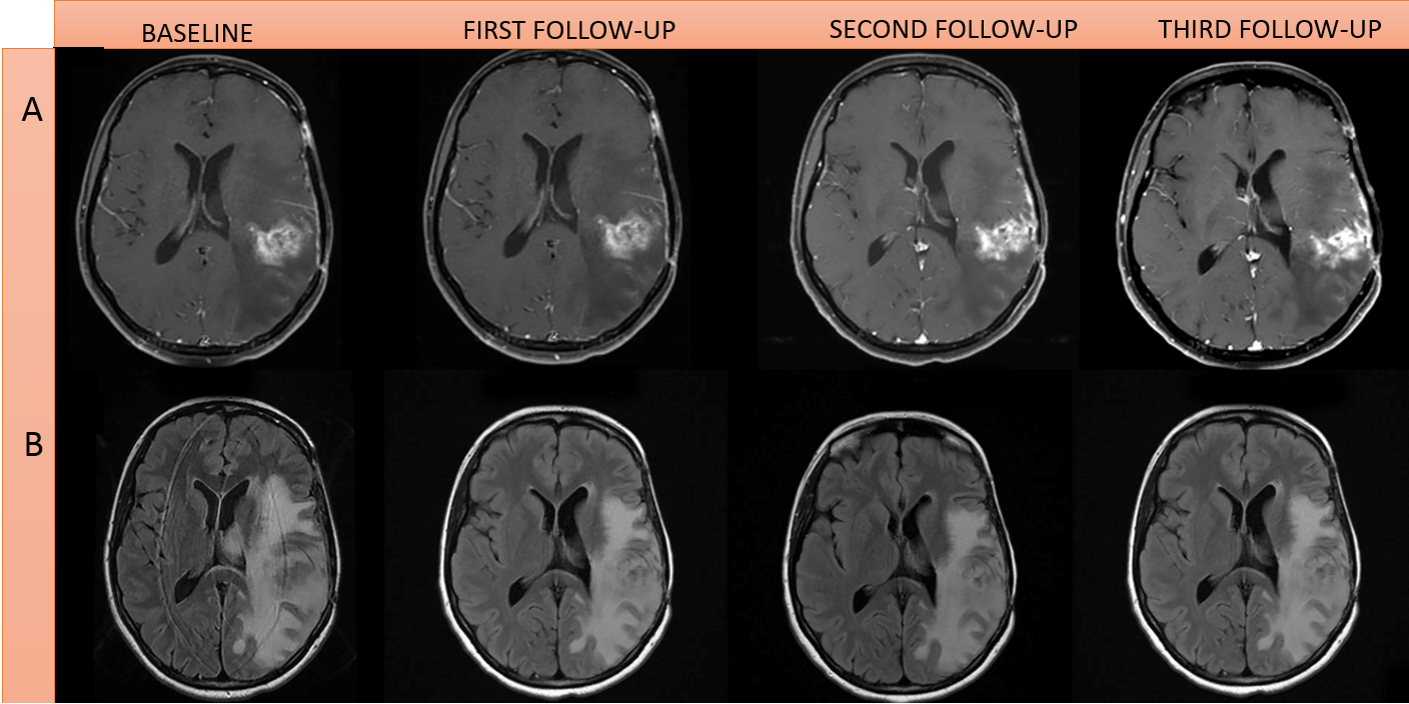
Patients: In this multi-Institutional IRB approved, HIPAA compliant study, we evaluated 304 GBM patients retrospectively. All patients showed radiographic worsening in MRI after radiation therapy, with or without clinical deterioration, and were evaluated for tumor progression or pseudoprogression. Of these 304 patients, 120 were females and 184 males. 149 patients had the histopathological evidence of PD or 27 of PsP. Remaining 128 patients were categorized into PD and PsP based on RANO criteria performed by a board-certified radiologist 9 (Figures 1, 2 & 3).
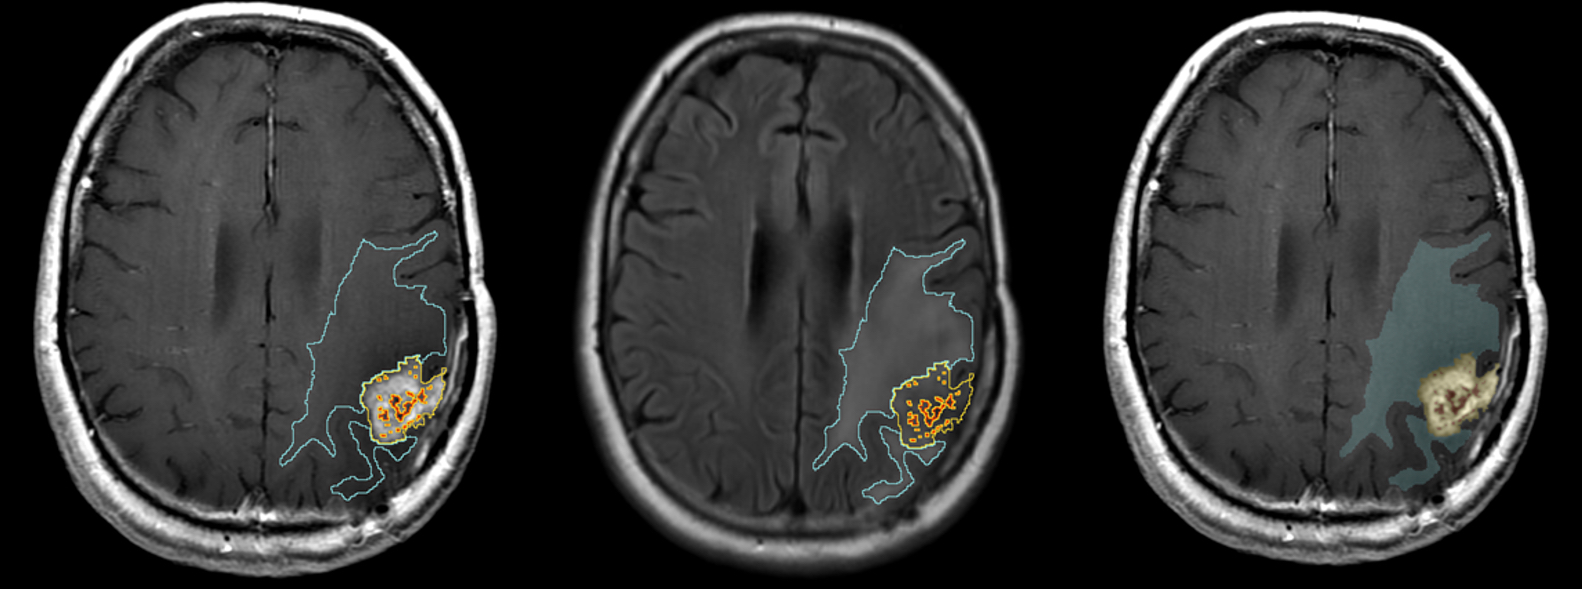
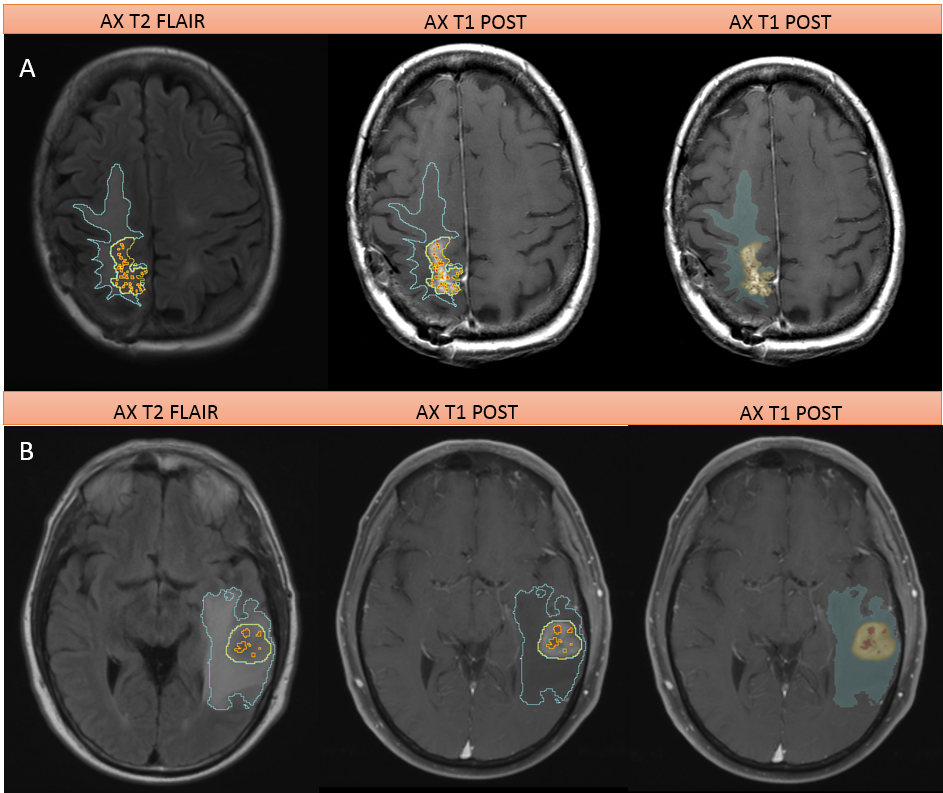
Image Acquisition and Radiomic Analysis: Conventional MR images (pre- and post-contrast T1-weighted and Fluid Liquid Attenuation Recovery (FLAIR)) were acquired using typical clinical acquisition parameters. Three tumor phenotypes (ROIs), namely edema/invasion, necrosis, and enhancing tumor, were delineated by an experienced radiologist using 3D slicer 4.3.1 (Figures 2 & 3). Segmentation details are described in Zinn et al.4. Voxels corresponding to hemorrhage were subtracted from the enhancing tumor. ROI data was then reduced to N grey levels (N=8, 16, 26, 32, 256 grey levels) via histogram equalization to ensure adequate counting statistics in subsequent co-occurrence matrices. Co-occurrence matrices were calculated for four directions (0°, 45°, 90°, and 135°) and 20 second-order texture features were calculated2,5,6. Finally, to avoid any rotational bias three rotation invariant measures (i.e. average, range, and variance) of each texture texture feature were calculated across the 4 distinct directions. Accounting for the different grey levels, rotation invariant measures, different phenotypes, and MR sequences, a total of 1800 radiomic texture features were obtained for each patient.
Statistical Analysis: An advanced feature selection method based on Minimum Redundancy Maximum Relevance (MRMR) was used to analyze the feature set and extract core features. Selected features were used to build a Support Vector Machine (SVM) model for prediction of PD versus PsP status. To evaluate the robustness of the estimates made with the SVM models, leave-one-out cross-validation (LOOCV) and a 70-30% split was performed on the patient set.
RESULTS
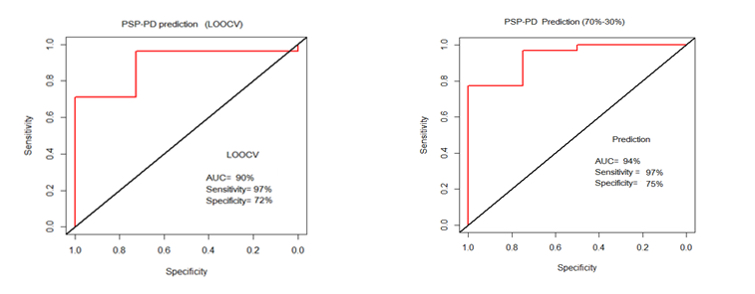
Using the MRMR feature selection method, we could identify 100 significant features that were further used to build a SVM model. On Leave One Out Cross-Validation (LOOCV), the area under curve (AUC) was 90%, with a sensitivity and specificity of 97% and 72% respectively (Figure 4). Using 70% of the patient data for training and 30% for validation an AUC of 94% was achieved, with sensitivity of 97% and specificity of 75%. Five texture features i.e. energy, cluster shade, sum average, maximum probability and cluster prominence were found to be most predictive of nature of disease progressionDISCUSSION
Appropriate determination of response to treatment is an important step in tumor management, with implications that determine future treatment options. Therefore, the proposed tool has the potential to advance clinical management strategies. Apart from its non-invasive nature, our methodology doesn’t require additional images and acts as a complementary tool for the clinicians.CONCLUSION
3D radiomic texture features of conventional MRI were successfully used to discriminate pseudoprogression from true progression in a large cohort of glioblastoma patients.Acknowledgements
John S. Dunn Sr. Distinguished Chair in Diagnostic Imaging Fund
MD Anderson Cancer Center startup funding
Radiological Society of North America Scholar Grant (RSCH11506)
MD Anderson’s Cancer Center Support Grant (CA016672)
References
1. Hygino da Cruz LC Jr, Rodriguez I, Domingues RC, et al., Pseudoprogression and pseudoresponse: imaging challenges in the assessment of posttreatment glioma. AJNR Am J Neuroradiol, 2011;32(11):1978-85.
2. Haralick RM, Statistical and structural approaches to texture. Proceedings of the IEEE, 1979;67(5):786-804.
3. Molina D, Perez-Beteta J, Luque B, et al., Tumour heterogeneity in glioblastoma assessed by MRI texture analysis: a potential marker of survival. Br J Radiol, 2016; 20160242.
4. Zinn PO, Mahajan B, Sathyan P, et al., Radiogenomic mapping of edema/cellular invasion MRI-phenotypes in glioblastoma multiforme. PLoS One, 2011;6(10):e25451.
5. Soh L and Tsatsoulis C, Texture Analysis of DAR Sea Ice Imagery Using Gray Level Co-Occurrence Matrices, IEEE Trans. Geosci. Remote Sensing, 1999;37:780-795.
6. Clausi DA, An analysis of co-occurrence texture statistics as a function of grey level quantization. Can. J. Remote Sensing, 2002;28:45-62.
Figures