1112
Eigentumors of dynamic contrast-enhanced MR images of the breast for prediction of treatment failure1Image Sciences Institute, University Medical Center Utrecht, Utrecht, Netherlands, 2Netherlands Cancer Institute - Antoni van Leeuwenhoek Hospital, Amsterdam, Netherlands
Synopsis
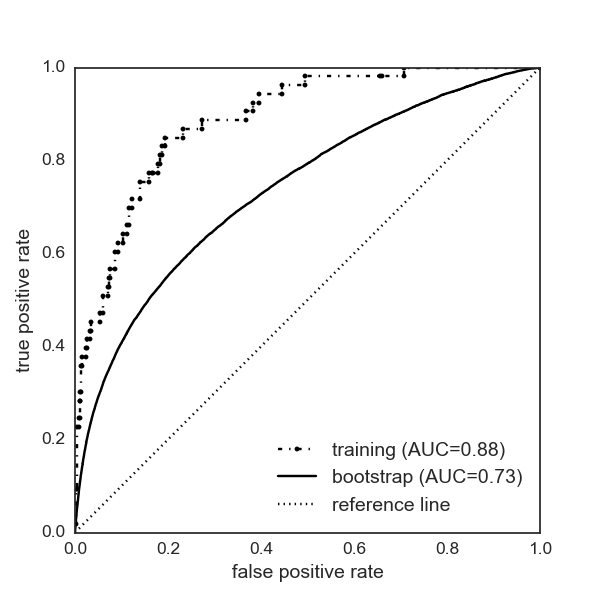
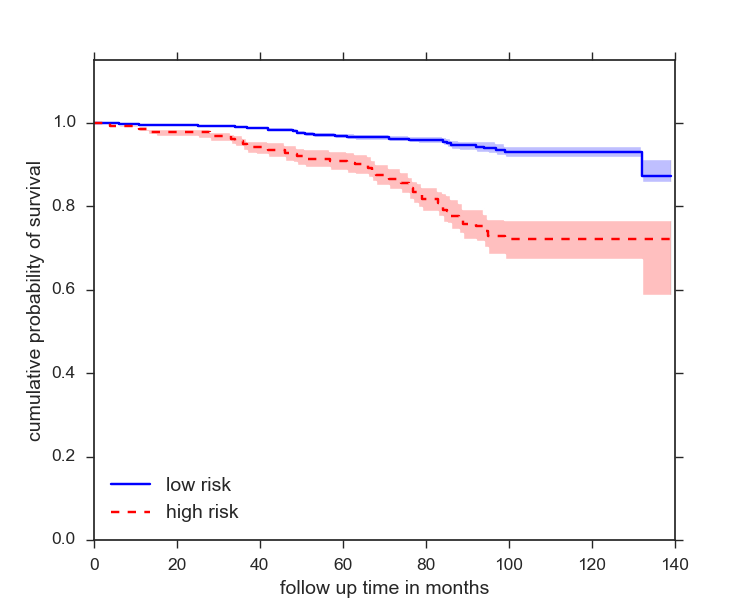
A method is proposed for predicting long-term treatment failure using “eigentumors”: principal components computed from volumes surrounding breast tumors in contrast-enhanced images. The dataset contains pre-treatment scans of 563 consecutively included patients with early-stage breast cancer with median follow-up of 86 months. Principal components of washin and washout in box-shaped regions surrounding the tumors were computed, and LASSO and logistic regression were used to construct a model for predicting the probability of treatment failure. ROC analysis yields a bootstrapped performance of 0.73, and bootstrapped Kaplan-Meier survival curves based on the model’s outcome show significant separation (χ=32.89, P < 0.0001).
Purpose
Assessing prognosis of patients with breast cancer is important for selecting an appropriate treatment plan, in particular for patients diagnosed with breast cancer in an early stage. A useful extension is to predict the probability of treatment failure. We hypothesize that principal component analysis (PCA) of a box-shaped volume of interest around breast tumors during contrast uptake yields eigentumors, which are correlated with treatment failure. The aim of this retrospective study was to identify a set of eigentumors and to construct a model to discriminate between patients at low risk and those at high risk of treatment failure at long-term follow-up.Methods
The dataset consisted of 1.5 T pre-treatment dynamic contrast-enhanced (DCE) MR images of consecutively included patients diagnosed with early-stage breast cancer. These patients were eligible for breast conserving therapy and were subsequently treated according to the national health guidelines. The outcome under investigation was overall survival (OS). Here, events included death from breast cancer as well as death from other causes1.
Bounding boxes were placed around the tumors. The washin and washout intensities were computed for the voxels inside these bounding boxes. These volumes were then rescaled to uniform sizes and formatted into feature vectors containing the washin and washout intensities. Principal components were computed, and, from the components containing 90% of the data’s variance, candidate components (i.e., candidate eigentumors) for predicting treatment failure at 140 months follow-up were selected by a least absolute shrinkage selection operator (LASSO). The selected components were used for a logistic regression model to predict the probability of an OS event. Performances were evaluated with receiver operating characteristic (ROC) analysis by determining area under the curve (AUC) values. Internal cross-validation was performed by bootstrapping with 1000 cycles and sample size equal to the total number of cases in the dataset. Kaplan-Meier survival curves were computed over the bootstrap cycles. The median and 95% confidence interval curves were determined and the log-rank test statistic was used to determine whether the groups as separated by the prediction model differed significantly.
Results
A total of 563 patients were included. The age at diagnosis ranged from 26 to 84 years, with median age of 57. Tumor diameters ranged between 5 and 90 mm. The median follow-up time was 86 months, and a total of 53 OS events were recorded.
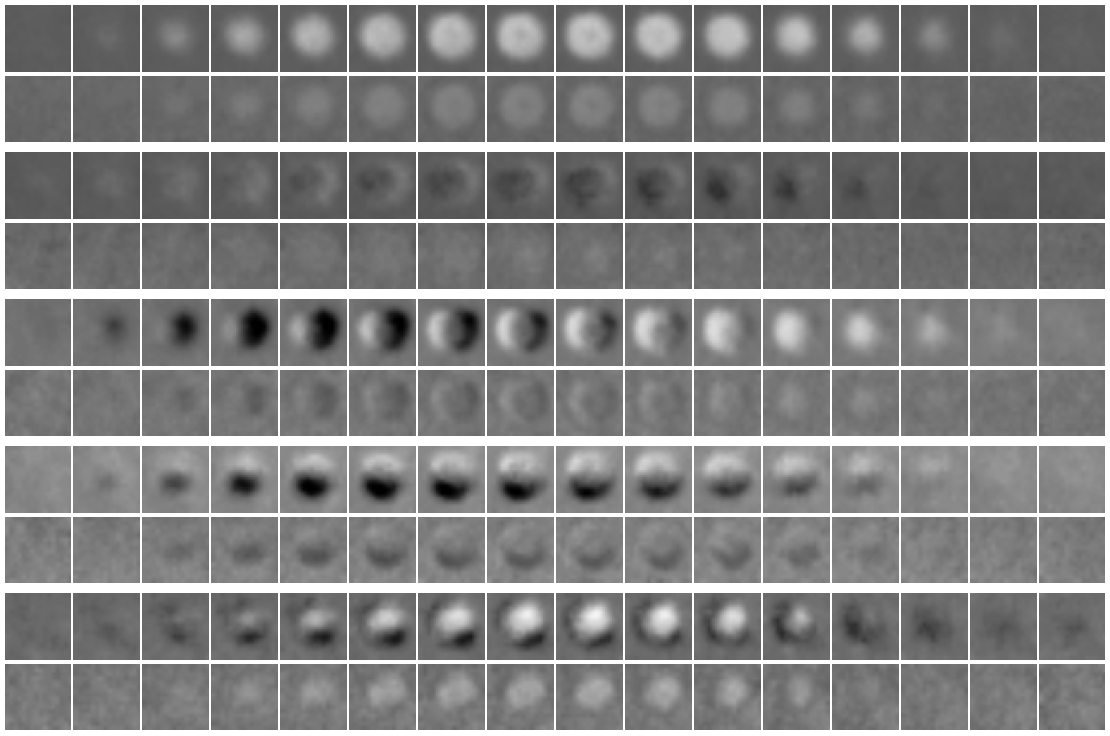
Ninety percent of the variance in the tumor data was explained by 322 principal components. From these components, 28 were selected by the LASSO for prediction of treatment failure (Figure 1). ROC analysis yielded training and bootstrapped AUC values of 0.88 and 0.73 respectively (Figure 2). Stratification of the cases by the model’s bootstrapped outcomes (survival of the patient, “yes” or “no”) showed significantly separation in the Kaplan-Meier survival curves (median values: χ=32.89, P < 0.0001) (Figure 3).
Discussion
Imaging
features in DCE-MRI images are commonly used for assessing whether a tumor is
benign or malignant2,
but general relations between imaging features and prognosis or survival still
need to be determined more clearly. Our approach to finding relevant imaging
features is to calculate the principal components of the volumes containing and
surrounding breast tumors. This allows us to reduce the dimensionality of the data while
maintaining most of the variance and the information. The method presented here
uses both characteristics of contrast uptake, from the washin and washout
images, as well as characteristics of tumor morphology, by considering the
voxels of a volume surrounding the tumor together. Thus, the method may be
capable of determining relevant imaging features which would be difficult to
extract by eye. For this retrospective proof-of-concept study, bootstrapping
was used as method of internal cross-validation to estimate the performance of
the model on unseen data. Further validation of the model is desired,
preferably on an independent test set.Conclusion
Eigentumors –principal components derived from pre-treatment DCE-MRI washin and washout images of breast tumors– show potential for use in prediction of treatment failure at long-term follow-up.Acknowledgements
This work is part of the research program IMDI with project number 104003019, which is (partly) financed by the Netherlands Organisation for Scientific Research (NWO).References
1. Hudis CA, Barlow WE, Costantino JP, Gray RJ, Pritchard KI, Chapman JAW, Sparano JA, Hunsberger S, Enos RA, Gelber RD, and Zujewski JA, Proposal for standardized definitions for efficacy end points in adjuvant breast cancer trials: The STEEP system. J Clin Oncol. 2007; 25(15): 2127-2132.
2. Morris EA, Comstock CE, Lee CH, ACR BI-RADS® Magnetic Resonance Imaging. ACR BI-RADS® Atlas, Breast Imaging Reporting and Data System, 2013. American College of Radiology: Reston, Virginia.
Figures