1111
Asynchronous Local Analysis of simultaneous BOLD ASL Multislice Acquisition (ALABAMA): Toward Whole-Brain Noninvasive Estimation of Resting-State Neuronal-Vascular Coupling1Radiology, Children's Hospital of Pittsburgh of UPMC, Pittsburgh, PA, United States
Synopsis
A method (ALABAMA) for regional estimation of the coupling between R2* fluctuations and log signal intensity (S0) (related to R2*-CBF coupling via a calibration factor) during the resting state is proposed. The method incorporates pseudo-continuous ASL (pCASL) labeling together with simultaneous multi-slice (SMS) and double-echo EPI acquisition for fast temporal resolution. The sequence yields robust positive ΔR2*-Δln S0 correlations in most resting-state networks, which may then be used to estimate resting-state neuronal-vascular coupling (NVC) with an additional calibration scan. However, negative correlations were found in posterior DMN and central executive network (CEN) regions, possibly reflective of altered flow-metabolism relationships.
Purpose
The overall goal of this work is a non-invasive technique for regional estimation of neuronal-vascular coupling (NVC) over the whole brain during the resting state, feasible for pediatric populations. The first step towards this goal is robust estimation of the relationship between R2* fluctuations and CBF fluctuations, using pseudo-continuous ASL (pCASL) labeling and simultaneous multislice (SMS) double-echo acquisition (ALABAMA). The combination of pCASL with SMS results in much improved CNR for CBF estimation1. We combine this approach with a dual-echo EPI acquisition for the simultaneous estimation of BOLD contrast.Methods
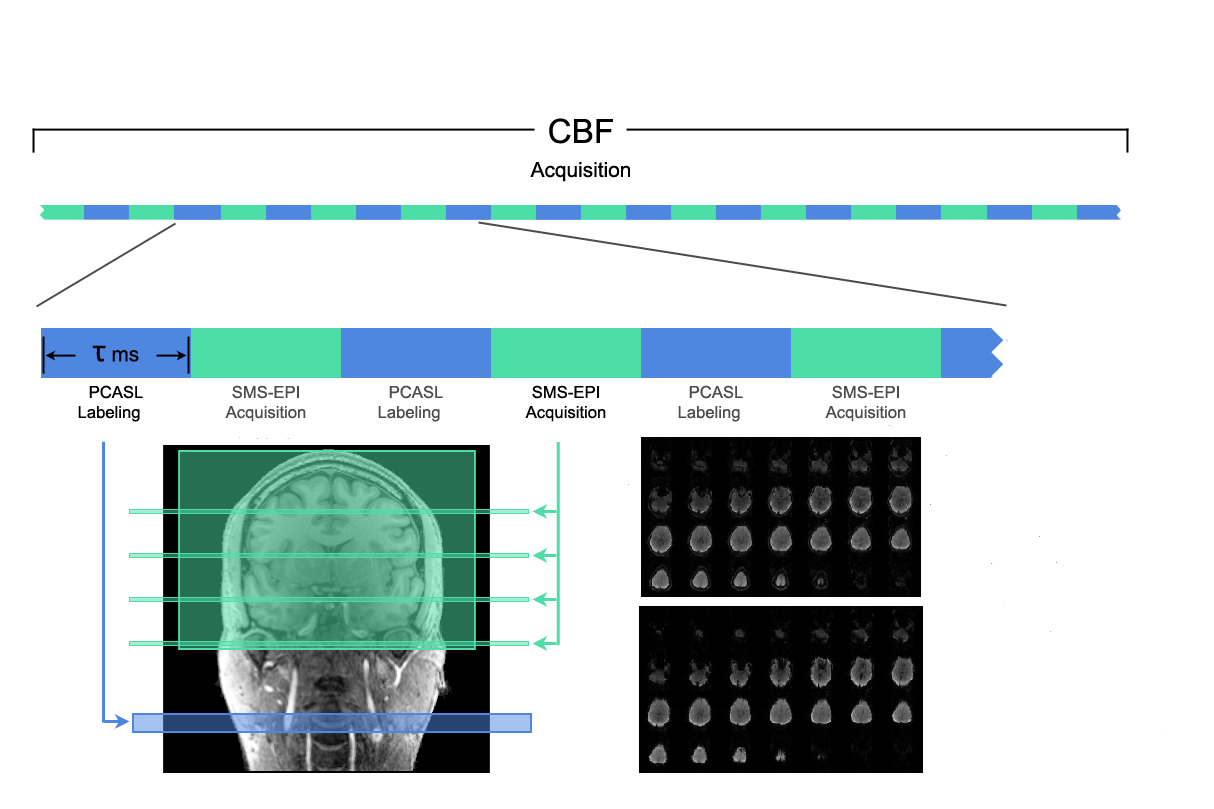
The ALABAMA sequence was implemented on a Siemens Skyra 3T scanner. The sequence consists of pCASL labeling, followed by SMS acquisition of two frames of double-echo data acquired in close temporal proximity (Figure 1). In order to increase the number of labeled frames acquired, there are no alternate control acquisitions, and only a very short post-inversion delay (PID), as estimation of absolute CBF is not required. The TR is made short enough so that spins labeled one TR ago have sufficient time (1.5 – 2 s) to traverse into the tissue compartment for the current acquisition.
The sequence was implemented on a 16-year girl and an adult male. Scan parameters were: label duration = 500 ms, PID = 50 ms, TR = 1400 ms, TE1/TE2 = 12/33 ms, flip angle = 60 degrees, SMS factor = 4X, voxel size = 5 mm isotropic, matrix = 48 X 48, four scan runs of approximately 4 minutes each. The datasets were spatially normalized into MNI space and the timeseries for each run were extracted from each of the 90 cortical regions in the automated anatomic labeling (AAL) parcellation2. The timeseries were band-pass filtered with 0.002 Hz < f < 0.08 Hz and quadratically corrected for scanner drift.
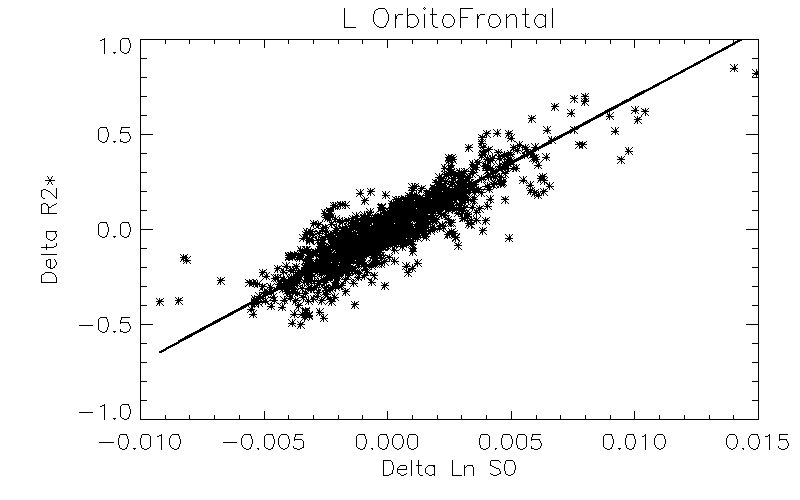
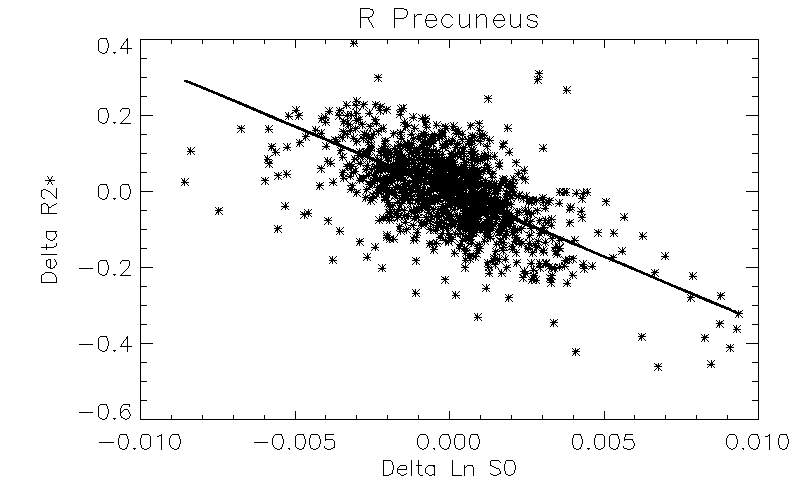
We estimate the coupling of ΔR2* to Δlog (unattenuated) signal intensity S0, as this is proportional to R2*-CBF coupling via a calibration factor. To avoid possible bias, the Deming regression procedure is used on ΔR2* and Δ ln S0 estimated from alternate datasets (e.g. R2* is estimated from the first dataset after the labeling, while ln S0 is estimated from the second dataset, and vice versa).
Results
We present results from the 16-year-old girl; results from the adult subject were quite similar (data not shown). The long-echo log signal from the first and second acquisition after labeling were highly correlated (R = 0.95) with a slope very near unity (1.01), justifying the use of both acquisitions in the analysis.
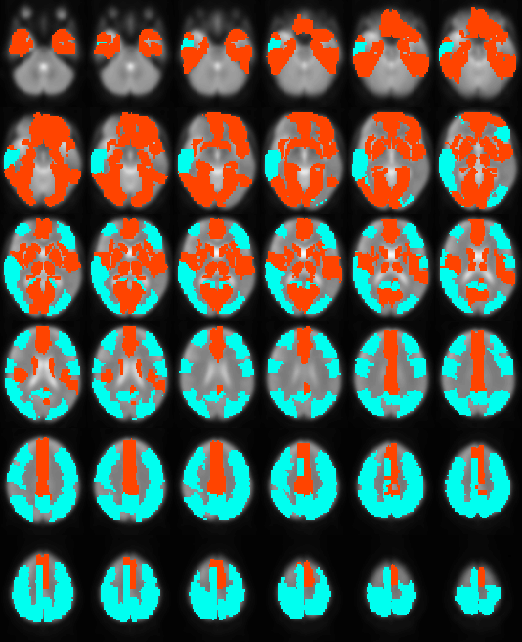
Robust positive correlations of ΔR2* with Δln S0 co-localized to known resting-state networks (Figure 2) including: (1) portions of the default mode network (DMN) including the anterior cingulate and medial temporal lobe (hippocampus), (2) salience network (prefrontal/insular regions), (3) primary visual regions and (4) subcortical regions (basal ganglia and thalamus). The magnitudes of these effects are comparable to what would be expected given a ± 30% fluctuation in CBF and a ± 1% fluctuation in BOLD signal (Figure 3). In contrast, we noted that regions of the posterior DMN (precuneus) and regions of the central executive network (CEN) displayed robust negative correlations of ΔR2* with Δln S0 (Figures 2, 4).
Discussion
Our results here suggest the ALABAMA approach may be a feasible method for whole-brain rs-NVC estimation, when combined with an alternate label-control acquisition for estimation of absolute pCASL signal change, and a non-invasive multi-gradient echo scan for calibration using R2’ estimation, as proposed previously3. Performance should improve by optimizing sequence parameters such as labeling duration, number of acquired frames after labeling, and SMS factor; and improved model estimation, possibly enabling estimation at the voxelwise level. Previously proposed methods using pulsed ASL (pASL) for combined BOLD-CBF acquisition typically do not cover the entire brain and have a significantly longer TR.
Positive ΔR2*-Δln S0 correlations were found in the anterior portions of the DMN and other networks including the visual system and salience network (insular), previously shown to have relatively high functional connectivity and regional blood flow4. The negative correlations found in posterior DMN and CEN regions could reflect altered resting-state flow-metabolism relationships5, inhibitory neuronal activity6, or varying metabolic demand7, 8.
Conclusion
A method for whole-brain estimation of flow-R2* coupling
is proposed (ALABAMA) which can be used for non-invasive estimation of
resting-state NVC over the whole brain in pediatric populations. Results suggest robust estimation of this
parameter is possible within a clinically feasible scan time. We found robust ΔR2*-Δln
S0 positive correlations in the anterior DMN, the primary visual
system, the salience network and subcortical regions.Acknowledgements
No acknowledgement found.References
1. Li X, Wang D, Auerbach EJ, Moeller S, Ugurbil K, Metzger GJ. Theoretical and experimental evaluation of multi-band EPI for high-resolution whole brain pCASL Imaging. NeuroImage. 2015;106:170-81.
2. Tzourio-Mazoyer N, Landeau B, Papathanassiou D, Crivello F, Etard O, Delcroix N, et al. Automated anatomical labeling of activations in SPM using a macroscopic anatomical parcellation of the MNI MRI single-subject brain. NeuroImage. 2002;15(1):273-89.
3. Blockley NP, Griffeth VE, Simon AB, Dubowitz DJ, Buxton RB. Calibrating the BOLD response without administering gases: comparison of hypercapnia calibration with calibration using an asymmetric spin echo. NeuroImage. 2015;104:423-9.
4. Liang X, Zou Q, He Y, Yang Y. Coupling of functional connectivity and regional cerebral blood flow reveals a physiological basis for network hubs of the human brain. Proceedings of the National Academy of Sciences of the United States of America. 2013;110(5):1929-34.
5. Mayhew SD, Mullinger KJ, Bagshaw AP, Bowtell R, Francis ST. Investigating intrinsic connectivity networks using simultaneous BOLD and CBF measurements. NeuroImage. 2014;99:111-21.
6. Enager P, Piilgaard H, Offenhauser N, Kocharyan A, Fernandes P, Hamel E, et al. Pathway-Specific Variations in Neurovascular and Neurometabolic Coupling in Rat Primary Somatosensory Cortex. Journal of Cerebral Blood Flow & Metabolism. 2009;29(5):976-86.
7. Lauritzen M, Mathiesen C, Schaefer K, Thomsen KJ. Neuronal inhibition and excitation, and the dichotomic control of brain hemodynamic and oxygen responses. NeuroImage. 2012;62(2):1040-50.
8. Vaishnavi SN, Vlassenko AG, Rundle MM, Snyder AZ, Mintun MA, Raichle ME. Regional aerobic glycolysis in the human brain. Proceedings of the National Academy of Sciences. 2010;107(41):17757-62.
Figures