1110
Optimal quantitative mapping of Cerabral Metabolic Rate of Oxygen (CMRO2) by combining quantitative susceptibility mapping (QSM)-based method and quantitative BOLD (qBOLD)1Cornell University, Ithaca, NY, United States, 2Weill Cornell Medical College, New York, NY, United States
Synopsis
Current two CMRO2 mapping methods, QSM-based method and qBOLD, suffer from the issues in their own model assumptions, such as blood flow challenge and linear relationship assumption between cerebral blood volume (CBV) and flow (CBF) in QSM-based method and the high sensitivity to noise and recent one-compartment assumption in qBOLD. We combined these two models with regularization based on that vein blood volume fraction and vein oxygenation are shared, which removes the challenge and linear assumption in QSM method and alleviates the high noise sensitivity and one-compartment assumption issue in qBOLD. The proposed model provided more uniform OEF and CMRO2.
Purpose
Cerebral metabolic rate of oxygen (CMRO2) and oxygen extraction fraction (OEF) maps are valuable for evaluating neurologic disorders such as ischemic stroke1. To estimate these maps, QSM-based method7, 8and qBOLD4 has considered tissue oxygenation contribution to phase and magnitude signal, respectively. Each method has different weakness due to its own biophysics model assumptions. QSM-based method uses blood flow challenge such as caffeine-challenge, not practical for clinical purposes. Empirical linear relationship between CBV and CBF was derived from whole brain linear regression in PET, might not hold for individual voxels. qBOLD deals with the optimization of multiple unknowns, at least five4, which leads to very high sensitive to noise. It recently assumes one-compartment model, which cannot be applied to white matter. To avoid these ambiguous assumptions and obtain robust map to noise, we combined these two models. We can discard the CBV-CBF linear assumption by setting vein volume fraction as a parameter, and vascular challenge by addressing more data points from qBOLD. In addition, we can mitigate the issue of one-compartment with weighing on QSM method, and the high noise sensitive by parameter regularization.Theory and Methods
CMRO2 and OEF can be expressed.
$$CMRO2 = CBF×OEF×CaO_2$$ $$OEF=1-\frac{Y}{SaO_2}$$ where $$$CaO_2$$$ is arterial oxygen concentration (7.377 μmol/ml), $$$SaO_2$$$ is arterial oxygen saturation (0.98), and $$$Y$$$ is oxygenation in vein.
QSM-based CMRO2 had two unknowns in previous studies7,8, $$$Y$$$ and non-blood susceptibility ($$$\chi_{nb}$$$), assuming vein blood volume fraction ($$$v$$$) is constant. In this study, we removed the assumption and treated $$$v$$$ as a fitting parameter. The magnitude part of qBOLD has four unknowns, signal intensity at TE=0 ($$$S_0$$$), cellular contribution to signal decay ($$$R_2$$$), $$$v$$$ and $$$Y$$$. As the two models share $$$v$$$ and $$$Y$$$, we combined them and solve the following optimization.
$$minimize_{v,Y,\chi_{nb},S_0,R_2}\left\{||F_{QSM}(v,Y,\chi_{nb})-QSM||^2_2+\lambda_1\left[|||S|-F_{qBOLD}(S_0,R_2,v,Y)||_F^2+\lambda_2||\triangledown Y||_2^2\right]\right\}$$ Where $$$||\cdot||_F$$$ is Frobenius norm, $$$\lambda_1$$$ is relative weight between two models, and $$$\lambda_2$$$ is a regularization factor on $$$Y$$$ smoothness.
1) First term-QSM-based method8.
$$F_{QSM}(v,Y,\chi_{nb})=\left[\frac{\chi_{ba}}{\alpha}+\psi_{Hb}×\Delta\chi_{Hb}×\left(-Y+SaO_2-\frac{1+SaO_2}{\alpha}\right)\right]×v+\left(1-\frac{v}{\alpha}\right)×\chi_{nb}$$
where $$$\chi_{ba}$$$ is purely oxygenated blood susceptibility, $$$\psi_{Hb}$$$ is hemoglobin volume franction, $$$\Delta\chi_{Hb}$$$ is susceptibility difference between deoxy- and oxy-hemoglobin, and $$$\alpha$$$ is vein volume fraction (0.77)
2) Second term-Magnitude part of qBOLD model4.
$$F_{qBOLD}(S_0,R_2,v,Y) = S_0×e^{-R_2×TE}×F_{BOLD}(v,Y,TE)×G(TE)$$
where $$$F_{BOLD}$$$ and $$$G$$$ are extracvascular and macroscopic contributions to the GRE signal decay respectively.
3) Optimization
The five unknowns, $$$v,Y,\chi_{nb},S_0,R_2$$$, were scaled with initial guess as $$$x'=\frac{x-avg(x_0)}{max(x_0)-min(x_0)}$$$. The lower and upper bound then was set to -5 and 5. For initial guesses, $$$Y$$$ was estimated from Straight Sinus vein (0.65). $$$v$$$ was set by the linear relationship between CBV and CBF2. $$$\chi_{nb}$$$ is estimated via $$$F_{QSM}$$$ with the $$$Y$$$ and $$$v$$$ initials. The $$$S_0$$$ and $$$R_2$$$ initials were obtained by mono-exponential fitting with the consideration of $$$G$$$6 in $$$F_{qBOLD}$$$. For tuning parameters, $$$\lambda_2$$$ was first chosen without the QSM term. The maximum value was selected before qBOLD term increases dramatically (1.8×10⁵). With the $$$\lambda_2$$$ value, $$$\lambda_1$$$ was set to 5.7×10⁻⁸ for visible QSM contribution. The limited-memory Broyden-Fletcher-Goldfarb-Shanno-Bound (L-BFGS-B) algorithm was used for the constrained optimization, and performed on 2D slice for speed.
4) Validation
We compared our QSM+qBOLD model with the sole QSM-based method8 and qBOLD. MRI was performed on a healthy volunteer after hyperventilation using a 3T scanner and a protocol consisting of a 3D ASL and a 3D spoiled Gradient Echo (SPGR) sequence8. The 3D ASL parameters were: 22cm FOV, 3 mm isotropic resolution, 1500 ms labeling period, 1525 ms post-label delay. The 3D SPGR sequence parameters were: identical coverage as the ASL scan, 0.52 mm in-plane resolution, 2mm slice thickness, 7 echoes, 4.3 ms first TE, 56.6 ms TR. QSM generated by morphology enable dipole inversion5. All images were co-registered to QSM. T1 weighted images were used to ROI segmentation.
Result
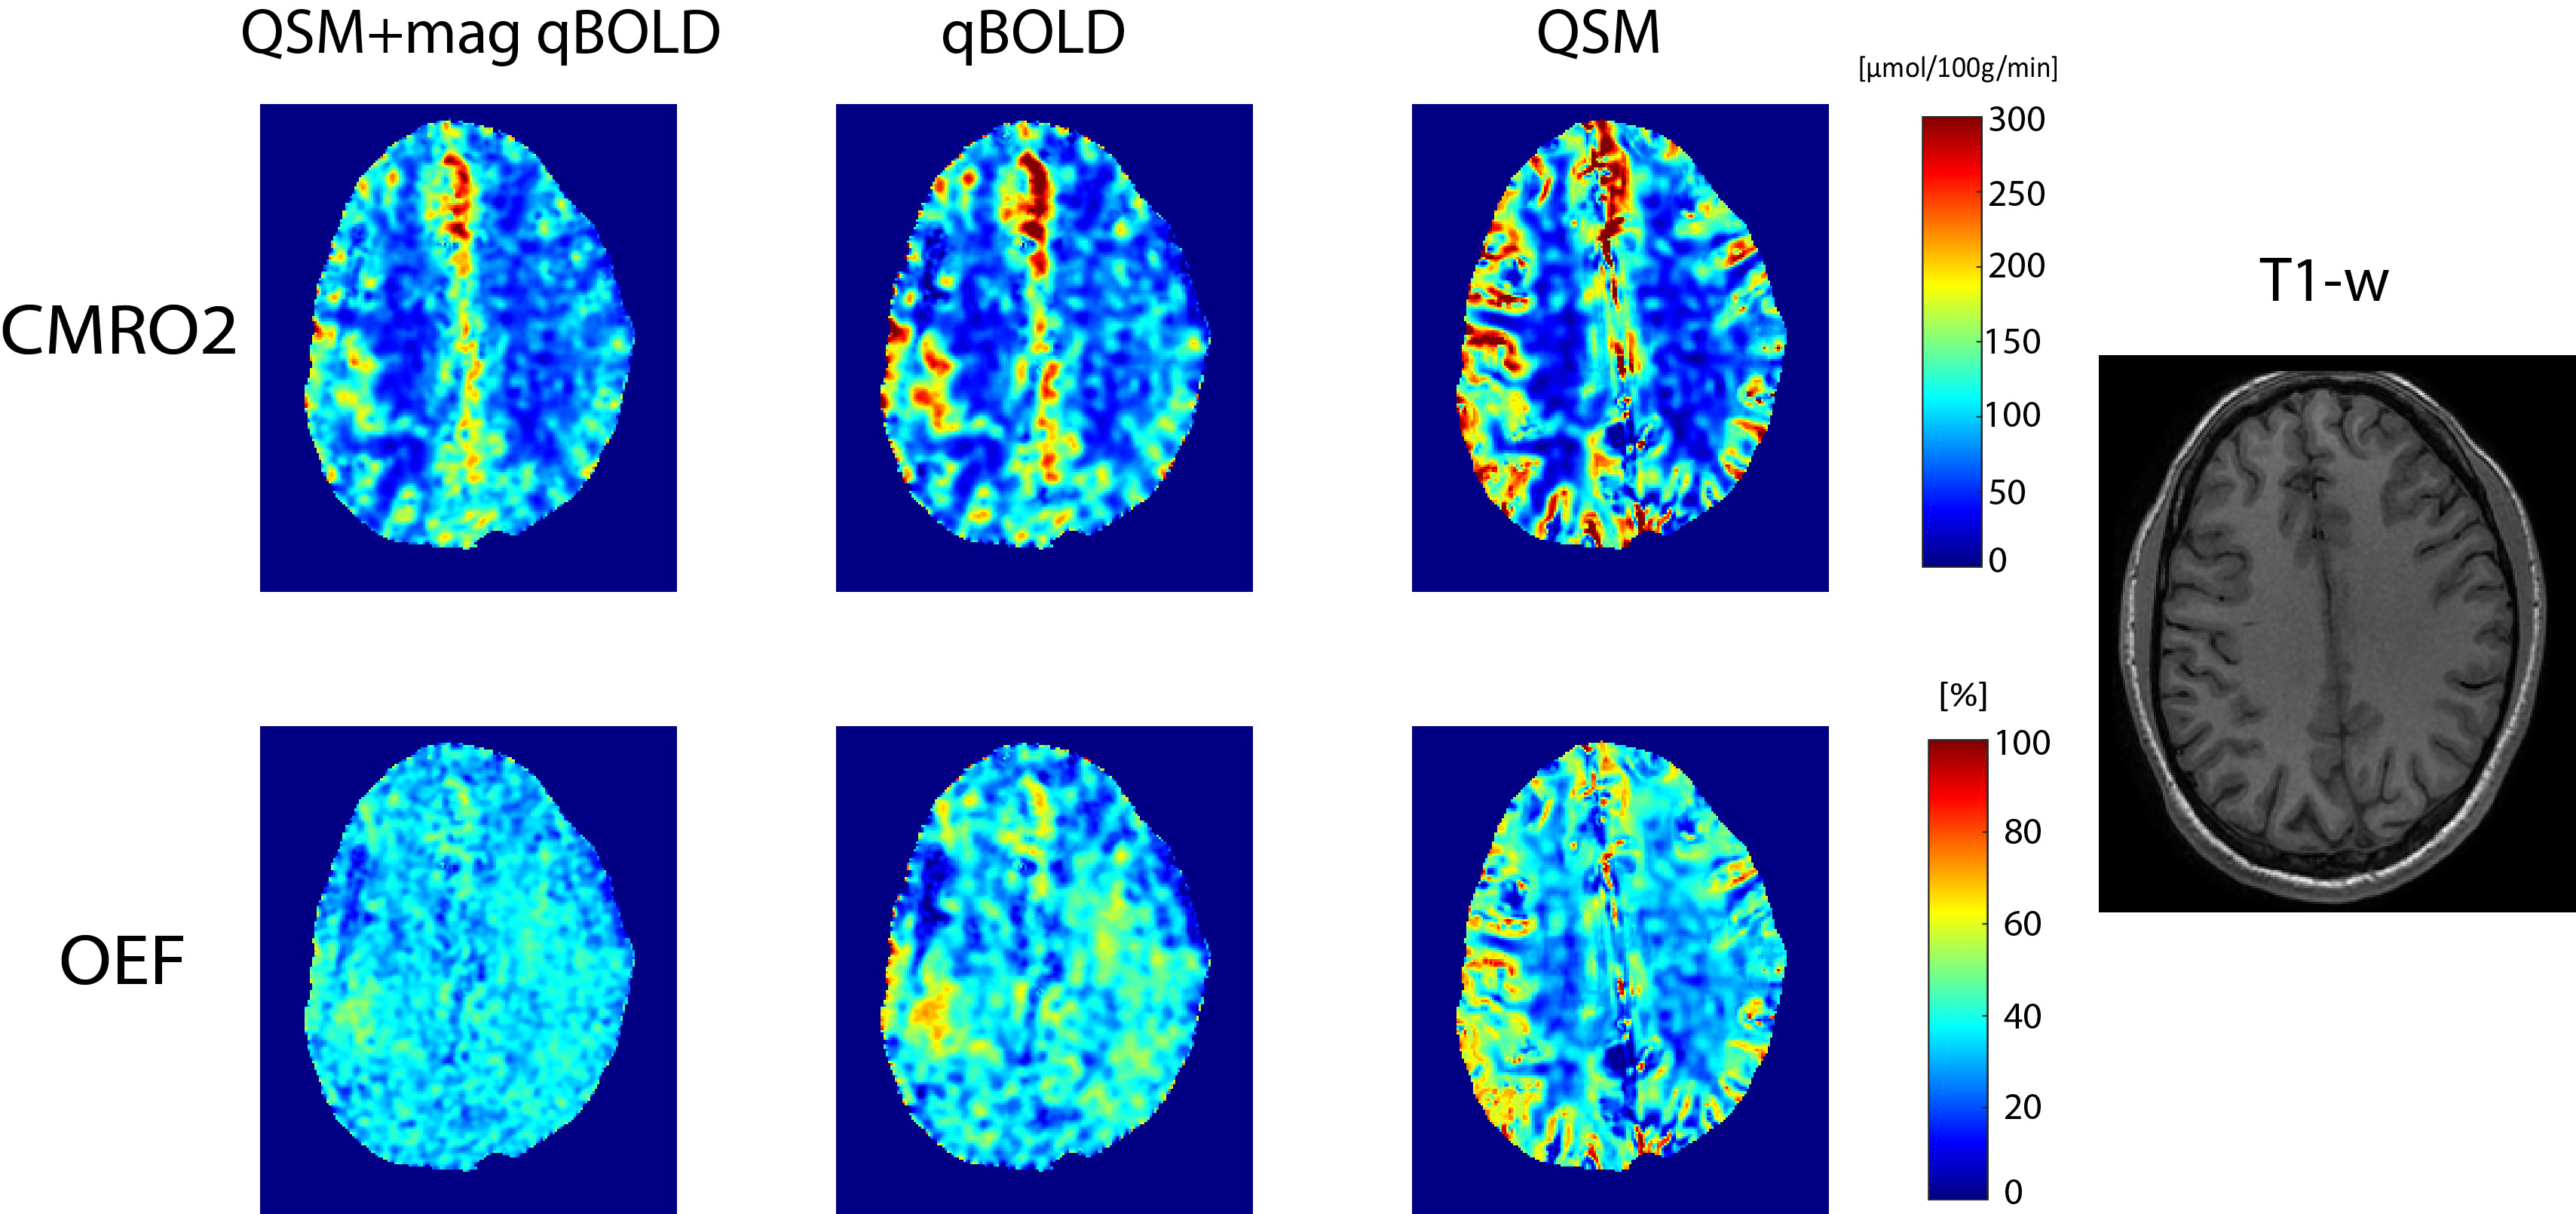
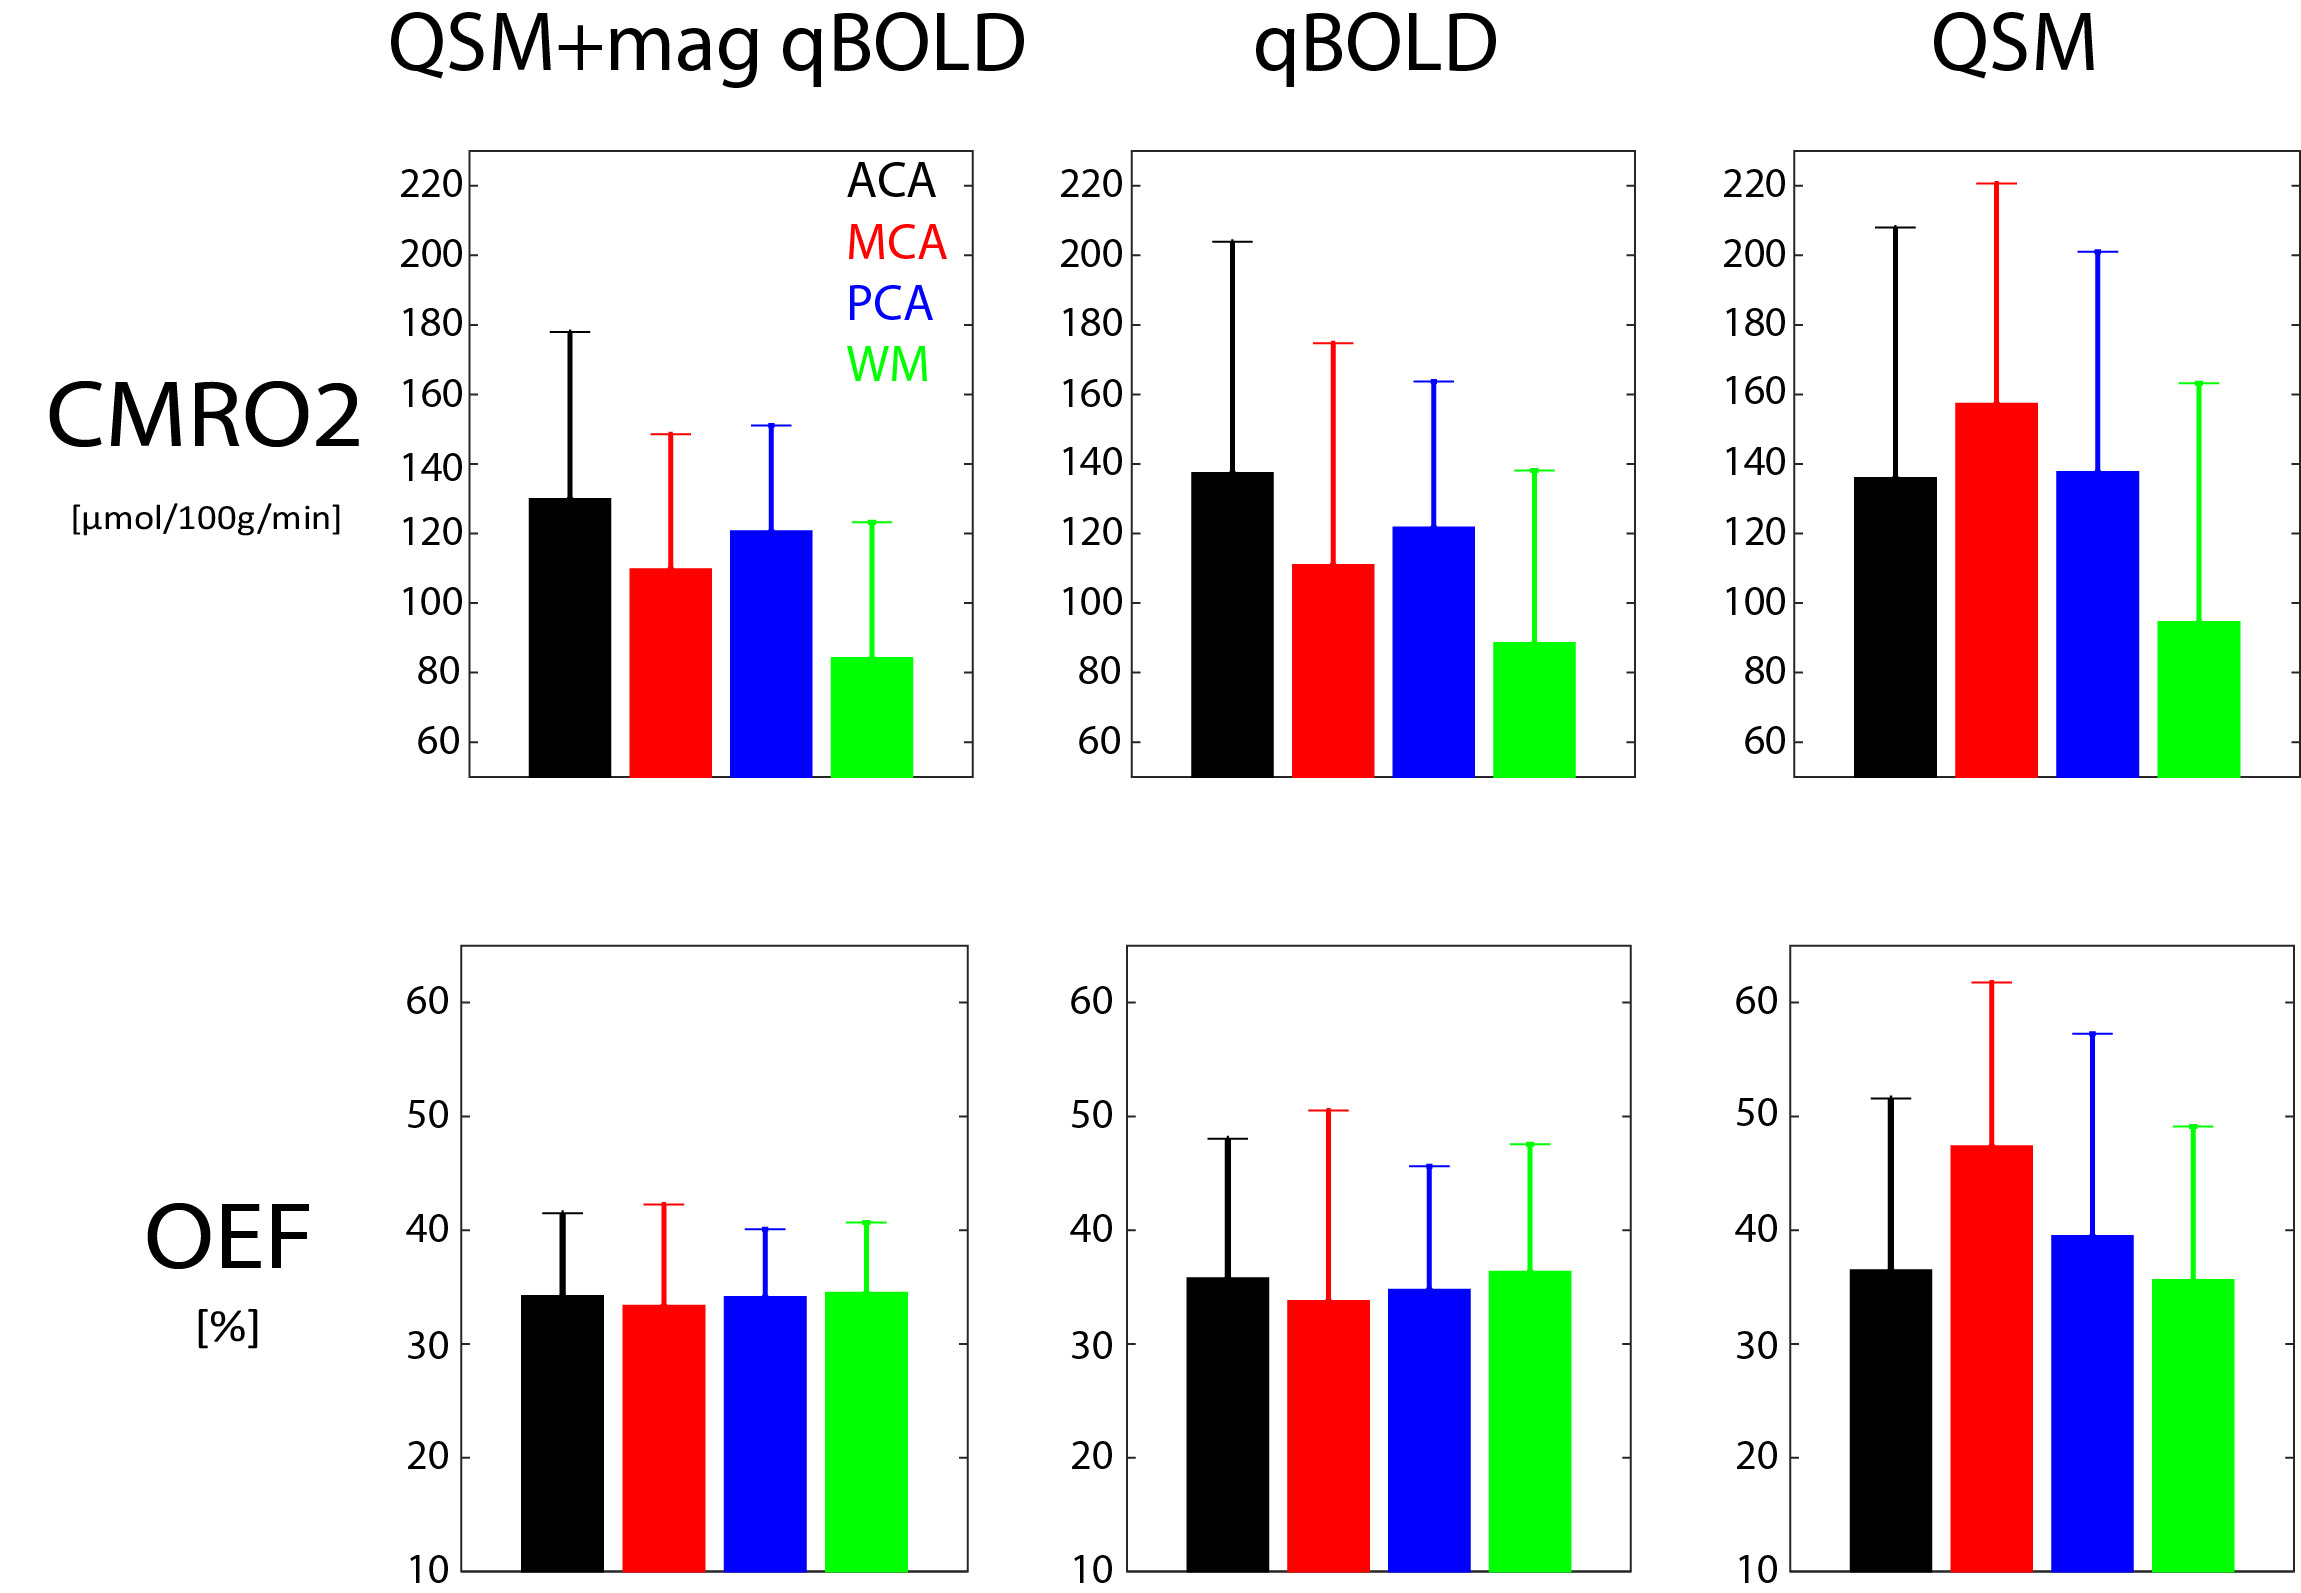
Fig.1 shows the CMRO2 and OEF comparison of our model with qBOLD and QSM-based method. Fig. 2 shows its ROI analysis. Our QSM+qBOLD model shows more uniform OEF with less gray and white matter contrast and CMRO2 has less extreme values, compared to the other two models.Discussion
Our results demonstrate the feasibility of comprehensive CMRO2 mapping method based on QSM-based method and qBOLD by providing a comparable result with sole methods. ROI analysis did not show significantly different CMRO2 and OEF values among three methods. Furthermore, the proposed method showed uniform OEF and CMRO2 map without extreme values, which agrees with other independent CMRO2 estimation methods such as PET3.Conclusion
The proposed comprehensive CMRO2 model can resolve issues in two current CMRO2 mapping methods, e.g. vascular challenge and CBV-CBF assumption in QSM-based method and the sensitivity to noise and one-compartment assumption in qBOLD.Acknowledgements
NIH grants R01 NS072370, R01 NS090464, and R01 NS095562References
1. J-C Baron, 'Mapping the Ischaemic Penumbra with Pet: Implications for Acute Stroke Treatment', Cerebrovascular diseases, 9 (1999), 193-201.
2. K. L. Leenders, D. Perani, A. A. Lammertsma, J. D. Heather, P. Buckingham, M. J. Healy, J. M. Gibbs, R. J. Wise, J. Hatazawa, S. Herold, and et al., 'Cerebral Blood Flow, Blood Volume and Oxygen Utilization. Normal Values and Effect of Age', Brain, 113 ( Pt 1) (1990), 27-47.
3. M. A. Mintun, M. E. Raichle, W. R. Martin, and P. Herscovitch, 'Brain Oxygen Utilization Measured with O-15 Radiotracers and Positron Emission Tomography', J Nucl Med, 25 (1984), 177-87.
4. Xialing Ulrich, and Dmitriy A Yablonskiy, 'Separation of Cellular and Bold Contributions to T2* Signal Relaxation', Magnetic resonance in medicine, 75 (2016), 606-15.
5. Y. Wang, and T. Liu, 'Quantitative Susceptibility Mapping (Qsm): Decoding Mri Data for a Tissue Magnetic Biomarker', Magn Reson Med, 73 (2015), 82-101.
6. Dmitriy A Yablonskiy, Alexander L Sukstanskii, Jie Luo, and Xiaoqi Wang, 'Voxel Spread Function Method for Correction of Magnetic Field Inhomogeneity Effects in Quantitative Gradient-Echo-Based Mri', Magnetic resonance in medicine, 70 (2013), 1283-92.
7. Jingwei Zhang, Tian Liu, Ajay Gupta, Pascal Spincemaille, Thanh D Nguyen, and Yi Wang, 'Quantitative Mapping of Cerebral Metabolic Rate of Oxygen (Cmro2) Using Quantitative Susceptibility Mapping (Qsm)', Magnetic resonance in medicine, 74 (2015), 945-52.
8. Jingwei Zhang, Dong Zhou, Thanh D Nguyen, Pascal Spincemaille, Ajay Gupta, and Yi Wang, 'Cerebral Metabolic Rate of Oxygen (Cmro2) Mapping with Hyperventilation Challenge Using Quantitative Susceptibility Mapping (Qsm)', Magnetic resonance in medicine (2016).
Figures