1107
Differentiating subtypes of multiple sclerosis lesions using sodium MR imaging1New York University School of Medicine, New York, NY, United States
Synopsis
Although conventional 1H MRI is commonly used for diagnosis and monitoring disease progression in multiple sclerosis (MS), it is not specific to pathology and cell vitality, and is limited in differentiating underlying pathology in MS lesions . In this study, using sodium (23Na) MRI, we demonstrated several subtypes of MS lesions with different sodium concentration changes, which may represent various stages of demyelination and axonal injury. Such information that is not available on conventional imaging may have value in characterize early versus chronic inactive lesions in MS.
Introduction
Multiple Sclerosis (MS) is considered an inflammatory demyelinating disease and also a heterogeneous disease 1. Recent biochemical studies 2-4 suggest a crucial role of ion channel (i.e., Na+, K+, Ca2+) imbalance and/or dysfunction of axonal Na+/K+ ATPase (NKA), a pump for exchange of axoplasmic Na+ for extracellular K+, in disease development and progression of MS. Such critical information, however, is not available in conventional 1H MRI. Recent advances in sodium 23Na MRI have shown great potential in improving sensitivity and specificity of in vivo quantification of brain sodium concentration. This study is to assess whether we can better characterize and differentiate MS lesions based on their sodium concentrations using 23Na MRI.Methods
The sodium 23Na MRI were performed at 3T in eight patients with definite MS and in 7 normal control (NC) subjects. For sodium MRI, we used the twisted projection imaging (TPI) sequence5. The acquisition parameters include FOV=220x220mm2, matrix size=64, 3D isotropic, TE/TR=0.3/100ms, flip angle=90°, averages=4, and TA=6:36min. The 23Na MRI was performed using a custom-built dual-tuned (1H-23Na) 8-channel transmit/receive head array coil. Both the sequence and coil are designed to increase SNR for sodium imaging. Additionally, 1H MRI was performed before or after 23Na MRI and included conventional FLAIR, T2- and T1-weigted imaging. Total sodium concentration (TSC) map was generated using a linear calibration defined at an internal marker of the vitreous fluid (145mM) after the correction for B1+/- inhomogeneity on the sodium image intensity. Since most MS lesions were within the periventricular regions, the mean TSC values of periventricular white matter (WM) in healthy controls and normal appearing white matter (NAWM) in patients were also measured.Results
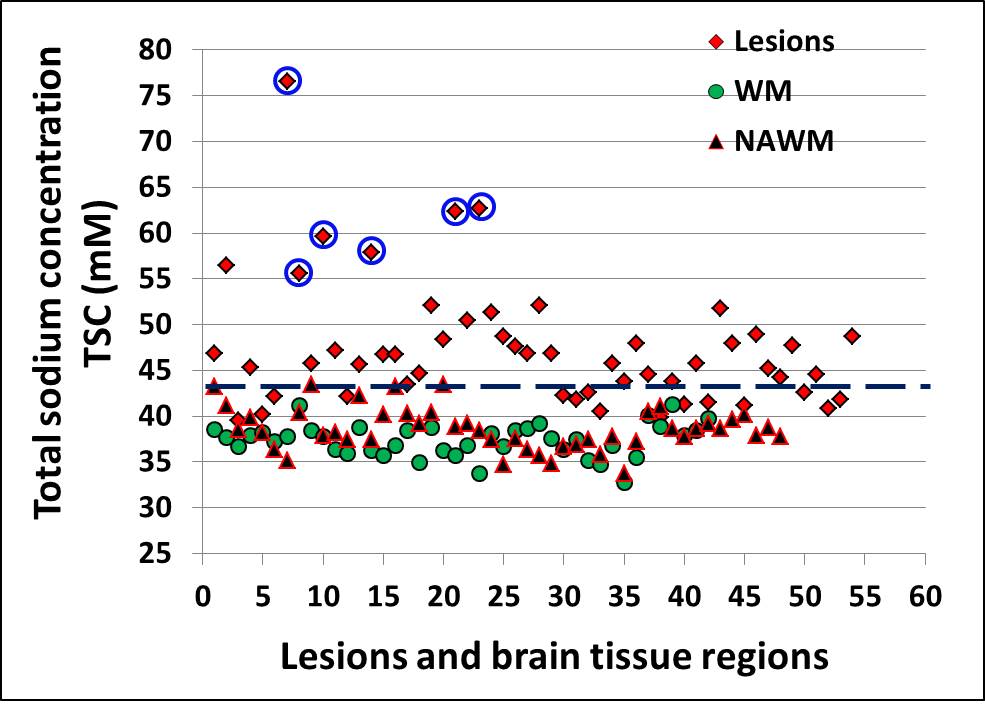
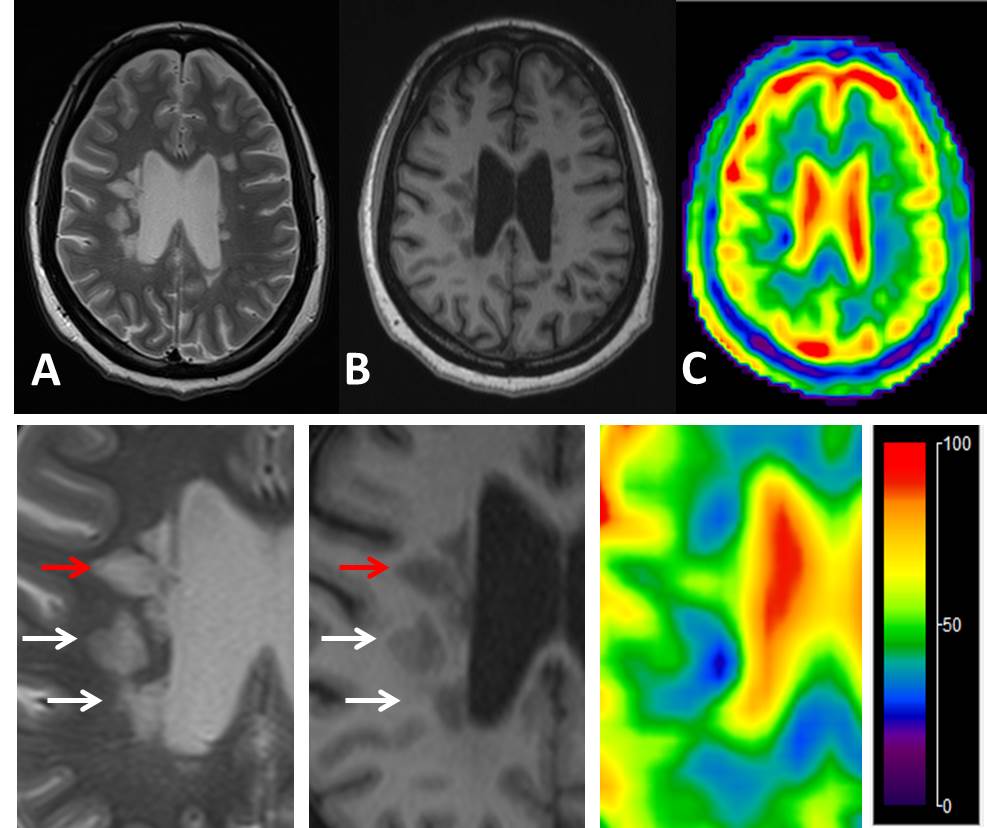
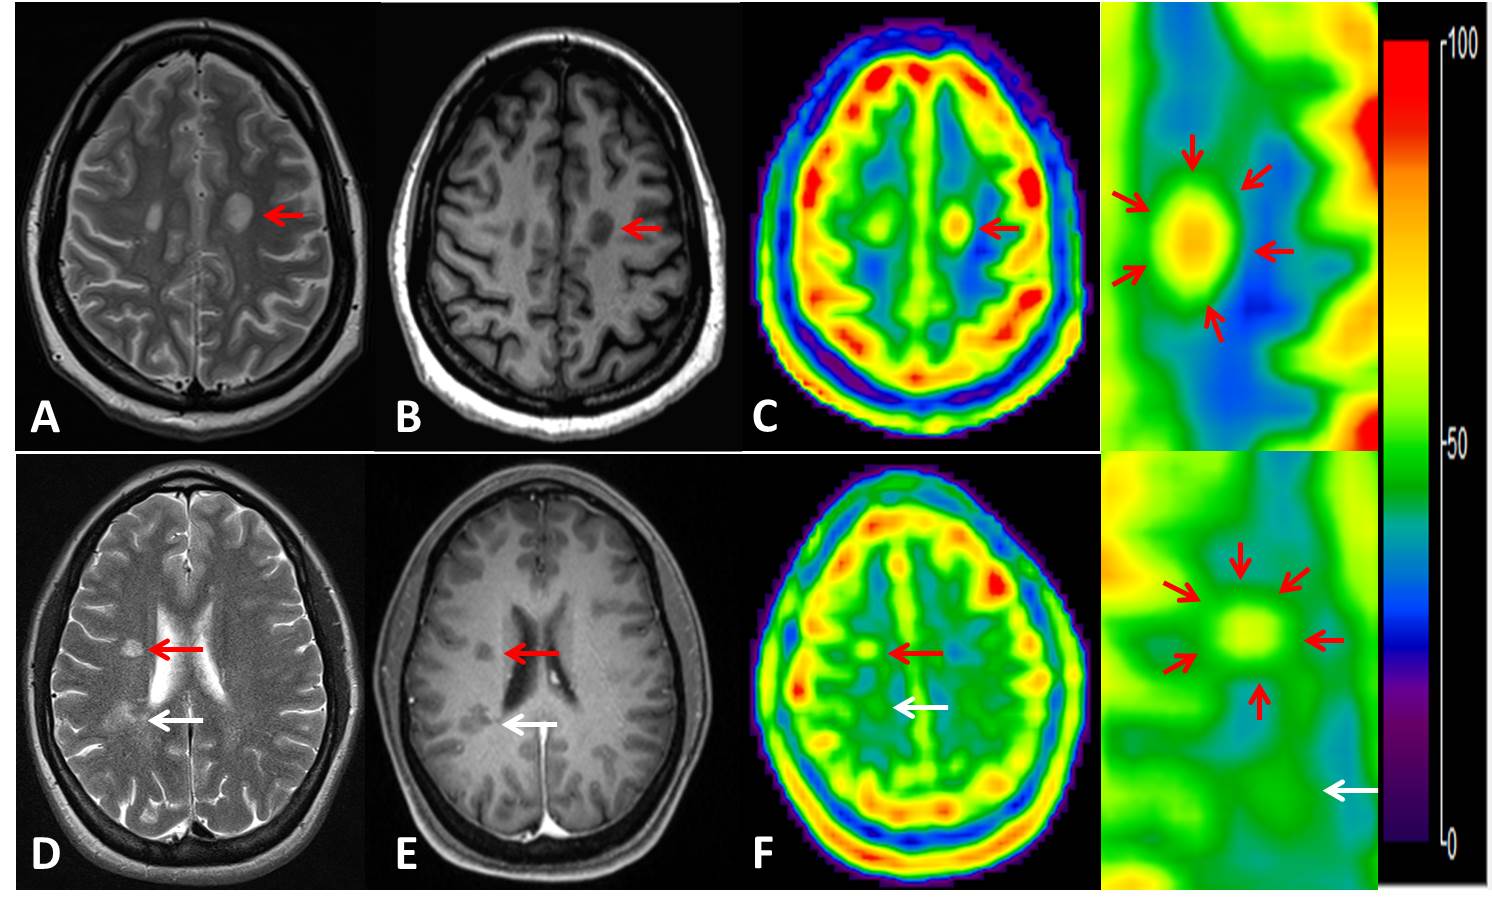
A total of 54 lesions (>3mm) were identified on FLAIR or T2-weighted imaging for TSC measurements and six ROIs from each subject were manually drawn in the bilateral periventricular WM on the 3 continuous slices. There was a significantly increased TSC (mean/SD = 47.6±6.6mM) versus either NAWM in patients (38.6±2.3mM, P < 0.0001) or WM in controls (37.4±1.8mM, P < 0.0001). Albeit of some overlap, TSC was higher of NAWM of patients than in WM of normal controls (P = 0.005). Interestingly, as shown in Figure 1, 15 out of 54 lesions (28%) have not shown increased TSC (<43 mM) and all lesions but one that have highest TSC (>55 mM) are ring appearance on TSC map and they showed highest TSC value in the center. Figure 2 demonstrated examples of the heterogeneity of TSC increase in MS lesions, indicating not all MS lesions showed increased sodium concentration. Figure 3 showed examples of ring-appearing lesions on TSC maps with highest values in the center, and such ring pattern is not seen on conventional 1H imaging, indicating different underlying pathophysiology in these lesions.Discussion
In MS, the higher intracellular sodium accumulation is likely to be responsible for the neuronal conduction failure and produce negative signs and symptoms. Our findings of increased TSC in NAWM suggest that TSC is sensitive in detecting early pathological changes that are not available on conventional MRI. Although TSC may include both intra- and extra-cellular concentrations, it is sensitive to abnormal sodium changes in particular for MS lesions in WM that has minimal CSF contamination. The WM TSC changes are mostly likely due to axonal Na+ channolopathy. Na+ channels are present at high density within myelinated axon membrane (approximately 1000 per μm2) and NKA is a critical enzyme for cell physiology to keep and restore resting and normal Na+/K+ gradient (i.e., with lower intracellular sodium level). Intriguingly, over-expression of NKA 4, 6 and increased activation of 23Na channels along axons in early stage of lesion development have been indicated in previous studies2, which play an important role in preserving normal axonal electrochemical gradient and keep normal axonal functions. The findings of different patterns of TSC changes in MS lesions support the previous study 7, in which there is TSC heterogeneity of acute MS lesions. These findings of various patterns TCS changes in MS lesions may indicate different stages of demyelination and axonal injury. The lesions with slightly higher TSC may be associated with a compensative mechanism with increased NKA distribution at early lesion formation. The highest TSC in the ring-appearing lesions may indicate a subtype of chronic inactive lesions with increased tissue destruction and fluid accumulation.Conclusion
TSC 23Na MRI together with 1H MRI are complementary for better characterization of subtypes of MS lesions and for better understanding of underlying pathophysiology in MS in particular associated with cellular energy failure or axonal integrity.Acknowledgements
This work was also partly supported by R01 grant NS-076588 from National Institute of Health (NIH) and was performed under the rubric of the Center for Advanced Imaging Innovation and Research (CAI2R, www.cai2r.net), a NIBIB Biomedical Technology Resource Center (NIH P41 EB017183).References
[1] Lucchinetti C, Bruck W, Parisi J, Scheithauer B, Rodriguez M, Lassmann H: Heterogeneity of multiple sclerosis lesions: implications for the pathogenesis of demyelination. Annals of neurology 2000, 47:707-17.
[2] Craner MJ, Damarjian TG, Liu S, Hains BC, Lo AC, Black JA, Newcombe J, Cuzner ML, Waxman SG: Sodium channels contribute to microglia/macrophage activation and function in EAE and MS. Glia 2005, 49:220-9.
[3] Waxman SG: Mechanisms of disease: sodium channels and neuroprotection in multiple sclerosis-current status. Nature clinical practice Neurology 2008, 4:159-69.
[4] Young EA, Fowler CD, Kidd GJ, Chang A, Rudick R, Fisher E, Trapp BD: Imaging correlates of decreased axonal Na+/K+ ATPase in chronic multiple sclerosis lesions. Annals of neurology 2008, 63:428-35.
[5] Boada FE, Shen GX, Chang SY, Thulborn KR: Spectrally weighted twisted projection imaging: reducing T2 signal attenuation effects in fast three-dimensional sodium imaging. Magnetic resonance in medicine : official journal of the Society of Magnetic Resonance in Medicine / Society of Magnetic Resonance in Medicine 1997, 38:1022-8.
[6] Hirsch HE, Parks ME: Na+- and K+-dependent adenosine triphosphatase changes in multiple sclerosis plaques. Annals of neurology 1983, 13:658-63.
[7] Eisele P, Konstandin S, Griebe M, Szabo K, Wolf ME, Alonso A, Ebert A, Serwane J, Rossmanith C, Hennerici MG, Schad LR, Gass A: Heterogeneity of acute multiple sclerosis lesions on sodium (23Na) MRI. Multiple sclerosis 2016, 22:1040-7.
Figures