1105
Qualitative and quantitative analysis of amide proton transfer-weighted MR images at 3 Tesla of adult gliomas1Radiology, Zhujiang Hospital of Southern Medical University, Guangzhou, People's Republic of China, 2Radiology, Zhujiang Hospital of Southern Medical University, 3Pathology, Zhujiang Hospital of Southern Medical University, 4Radiology, Hainan General Hospital, 5Radiology, Beijing Hospital, 6Radiology, Johns Hopkins University
Synopsis
We evaluated the reliability and clinical value of amide proton transfer-weighted (APTW) MR imaging at 3 Tesla in adult gliomas. Fifty-seven patients with primary gliomas were recruited and scanned. Two radiologists evaluated the location and size of the APTW hyperintensity and enhancing areas, and measured the tumor and contralateral normal-appearing white matter (CNAWM) APTW values. The correlation between relative APTW (rAPTW) values and pathologic grades was calculated. Results showed APTW analysis had good reliability. APTW images almost showed the same compared with T1-weighted contrast-enhancing (T1W+C) images. The tumor rAPTW values had a strong positive correlation with pathologic grades.
Target audience
Researchers and clinicians who are interested in APTW MR imaging applications and in pathologic grading of gliomas.Purpose
Glioma, the most common primary brain tumor, includes all the neoplasms arising from astrocytic, ependymal, and oligodendroglial cells or choroid plexus. Pathologic grading for gliomas still plays a crucial role in planning the medical treatments. Among the conventional MRI sequences, T1WI+C is the most important sequence in the diagnosis of gliomas. APTW MR imaging is a new molecular imaging technique which has the ability to detect the endogenous protein and peptide in central nervous system tumors. Previous studies have shown that APTW MRI has great potential to detect and differentiate high-grade gliomas (HGGs) from low-grade gliomas (LGGs). Here, based on a larger sample size, we evaluated the APTW characteristics of glioma qualitative and quantitatively.Methods
Fifty-seven patients with primary gliomas were recruited and scanned, including 23 cases of grade IV; 12 cases of grade III; 21 cases of grade II; and only 1 case of grade I, based on the World Health Organization (WHO) standard (2007/2016).
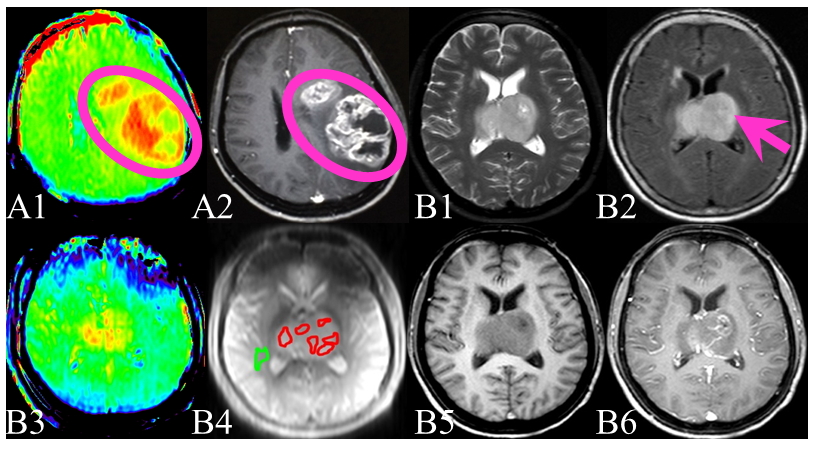
For the qualitative analysis, two experienced radiologists (blinded to the pathology diagnosis) determined the APTW signal features, and compared the location and size of the APTW hyperintensity and enhancing T1W areas (Fig. 1 A1,2). Kappa coefficient was used to evaluate the reliability of their results. A third radiologist would join the analysis when there were any disagreements.
For the quantitative APTW measurements, two observers independently drew (blinded to the pathology diagnosis) six ROIs on each glioma mass, depending upon the T1WI contrast-enhancement and APTW signals. The CNAWM APTW values were also recorded (Fig.1 B1~6). The maximum, minimum, and mean APTW values from these six ROIs were recorded as APTWmax, APTWmin, and APTWmean. We calculated the relative values (rAPTW) by subtracting the CNAWM APTW values from the absolute APTW values and recorded them as rAPTWmax, rAPTWmin, and rAPTWmean. Intraclass correlation coefficients (ICCs) were used to evaluate the reliability of rAPTWmax, rAPTWmin, and rAPTWmean measurements. Multivariate logistic regression model was used to explore the correlation between the rAPTW values and pathologic grades. We applied ROC curves to get the cut-off rAPTW values in differentiating the HGGs from LGGs, and the sensitivity, specificity, accuracy were calculated at the same time.
Results
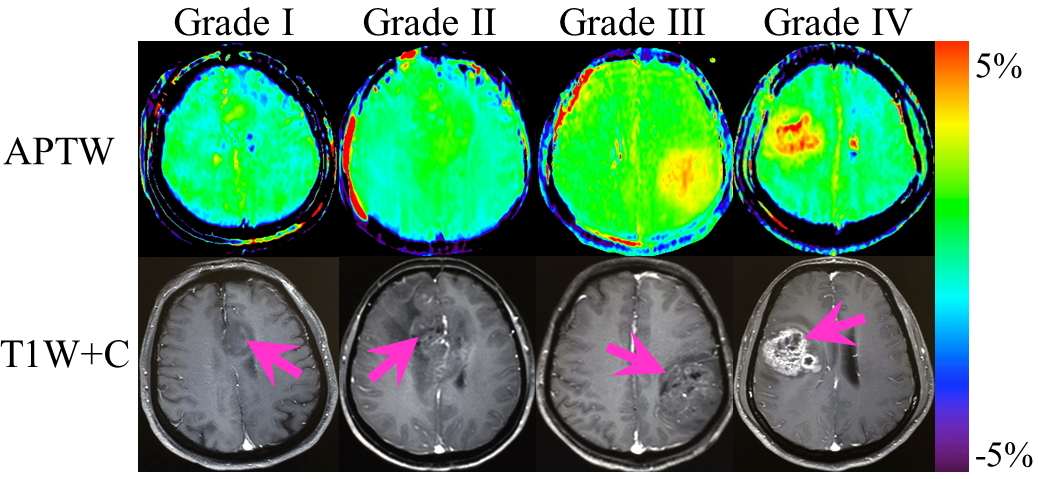
For the qualitative analysis of the APTW and T1W+C images, we compared the lesions with or without APTW hyperintensity and estimated the location and size between the APTW hyperintensity and enhancing areas, and then we got the Kappa values of 0.838, 0.632 and 0.925, respectively. At least 75.4% (43/57) APTW images showed the same tumor features as T1W+C images (Fig. 2). The APTW signals of the liquid in the tumor cavities were variable, some were hyperintensity while others were hypointensity.
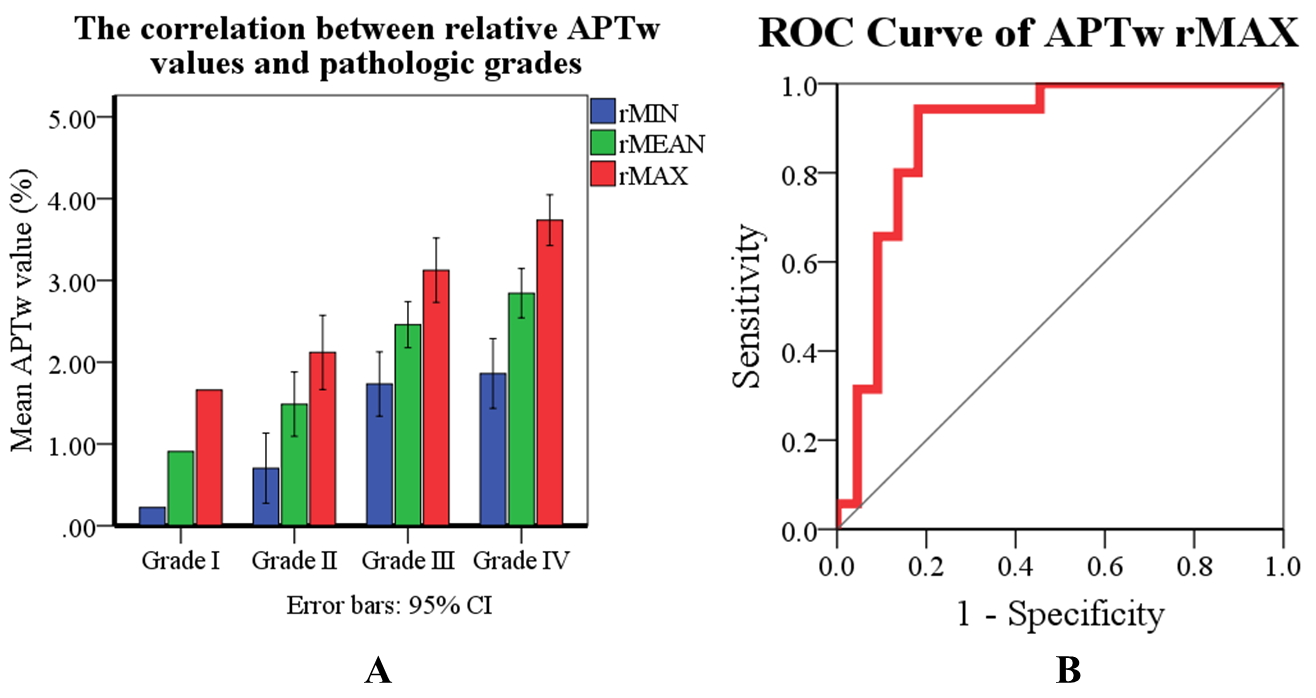
For the quantitative measurements of the ROIs, the ICCs for the rAPTWmax, rAPTWmin, and rAPTWmean values measured by two observers were 0.944, 0.872, and 0.944, respectively. There was a strong positive correlation between the glioma tumor rAPTW values and pathologic grades (Fig. 3 A). These rAPTW parameters of the glioma tumors had high collinearity. We found that rAPTWmax was the most relevant one to the grades, with the 95% confidence interval (CI) in subdividing the gliomas into I~IV grades to be 1.66%, 1.67%~2.57%, 2.73%~3.52%, and 3.43%~4.05%, respectively. The area under ROC curve (AUC) of rAPTWmax was 0.886 (Fig. 3 B) in differentiating the HGGs from LGGs, with a cut-off value of 2.46% (sensitivity 94.3%, specificity 81.8%, and accuracy 87.7%).
Conclusions
APTW imaging has high reliability in qualitative analysis and quantitative measurements of adult gliomas. It is a good sequence for the glioma pathologic grading prediction and could be a useful alternative when T1WI+C is not available.Acknowledgements
The authors thank Miss Qian Ke for statistical assistance. This work was supported in part by grants from Guangdong Provincial Science and Technology Project (2014A020212726), Guangdong Provincial Natural Science Foundation (S2012010009114), and the National Natural Science Foundation of China (81171322).References
(1) Zhou J et al. Nature medicine 9, 1085 (2003). (2) Ge Zhang et al. Chinese Journal of Neurosurgery 29, 1005(2013). (3)Togao O et al. Neuro-oncology 16, 441 (2014). (4) Ge Zhang et al. Chinese Journal of Radiology 9, 736 (2014). (5) Louis DN et al. Acta neuropathologica 131, 803 (2016). (6)Zhou J et al. Magnetic Resonance in Medicine 60, 842(2008). (7) Wu B et al. EJNMMI physics 3, 19 (2016). (8) Zhou J et al. Journal of Magnetic Resonance Imaging 38,1119(2013).Figures