1103
About the complementarity of gluCEST and 1H-MRS for the study of neurodegenerative diseases using animal models1Molecular Imaging Research Center (MIRCen), Commissariat à l’Energie Atomique (CEA), Fontenay-aux-Roses, France, 2UMS27, INSERM, Fontenay-aux-Roses, France
Synopsis
Animal models of neurodegenerative diseases are useful tools to investigate neurodegenerative diseases. However, there is often a wide variety of described models for a same pathology, each model exhibiting its own characteristics. In this work, we used two mouse models of Huntington’s disease exhibiting very different alterations. Using a protocol combining gluCEST imaging and 1H-MRS, we showed that, while gluCEST may evidence alterations in unexpected brain regions, it may also be blind to disease process in certain situations where glutamate levels are preserved. This highlights the complementarity of both methods to identify relevant biomarkers of the pathology.
PURPOSE
MRI and MRS are promising methods to identify biomarkers of neurodegenerative diseases in vivo, especially using animal models. 1H-MRS has been widely used to study metabolic modifications in several neurodegenerative diseases. Recently, gluCEST imaging has been proposed to map glutamate distribution in the brain and can provide complementary insights about local alterations1,2. However, the wide heterogeneity of animal models for a same pathology can make it difficult to choose the appropriate method. Here, we highlight the complementarity of 1H-MRS and gluCEST methods for the study of neurodegenerative disease in two different mouse models of Huntington’s disease (HD).METHODS
Ki140 model: knock-in mice (12-m old) expressing chimeric mouse/human exon 1 containing 140 CAG repeats inserted in the murine Htt gene were used (Ki140)3. Three cohorts were compared: wild type littermate controls (Ki140-WT, n=5), heterozygous (Ki140-Hetero, n=5) and homozygous (Ki140-Homo, n=5) mice for the HTT gene.
R6/1 model: transgenic mice (7-m old) expressing mouse/human exon 1 containing 115 CAG repeats in the HTT gene were used4. Two cohorts have been compared: wild type littermate controls (R6/1-WT, n=3) and heterozygous (R6/1-Hetero, n=4) mice.
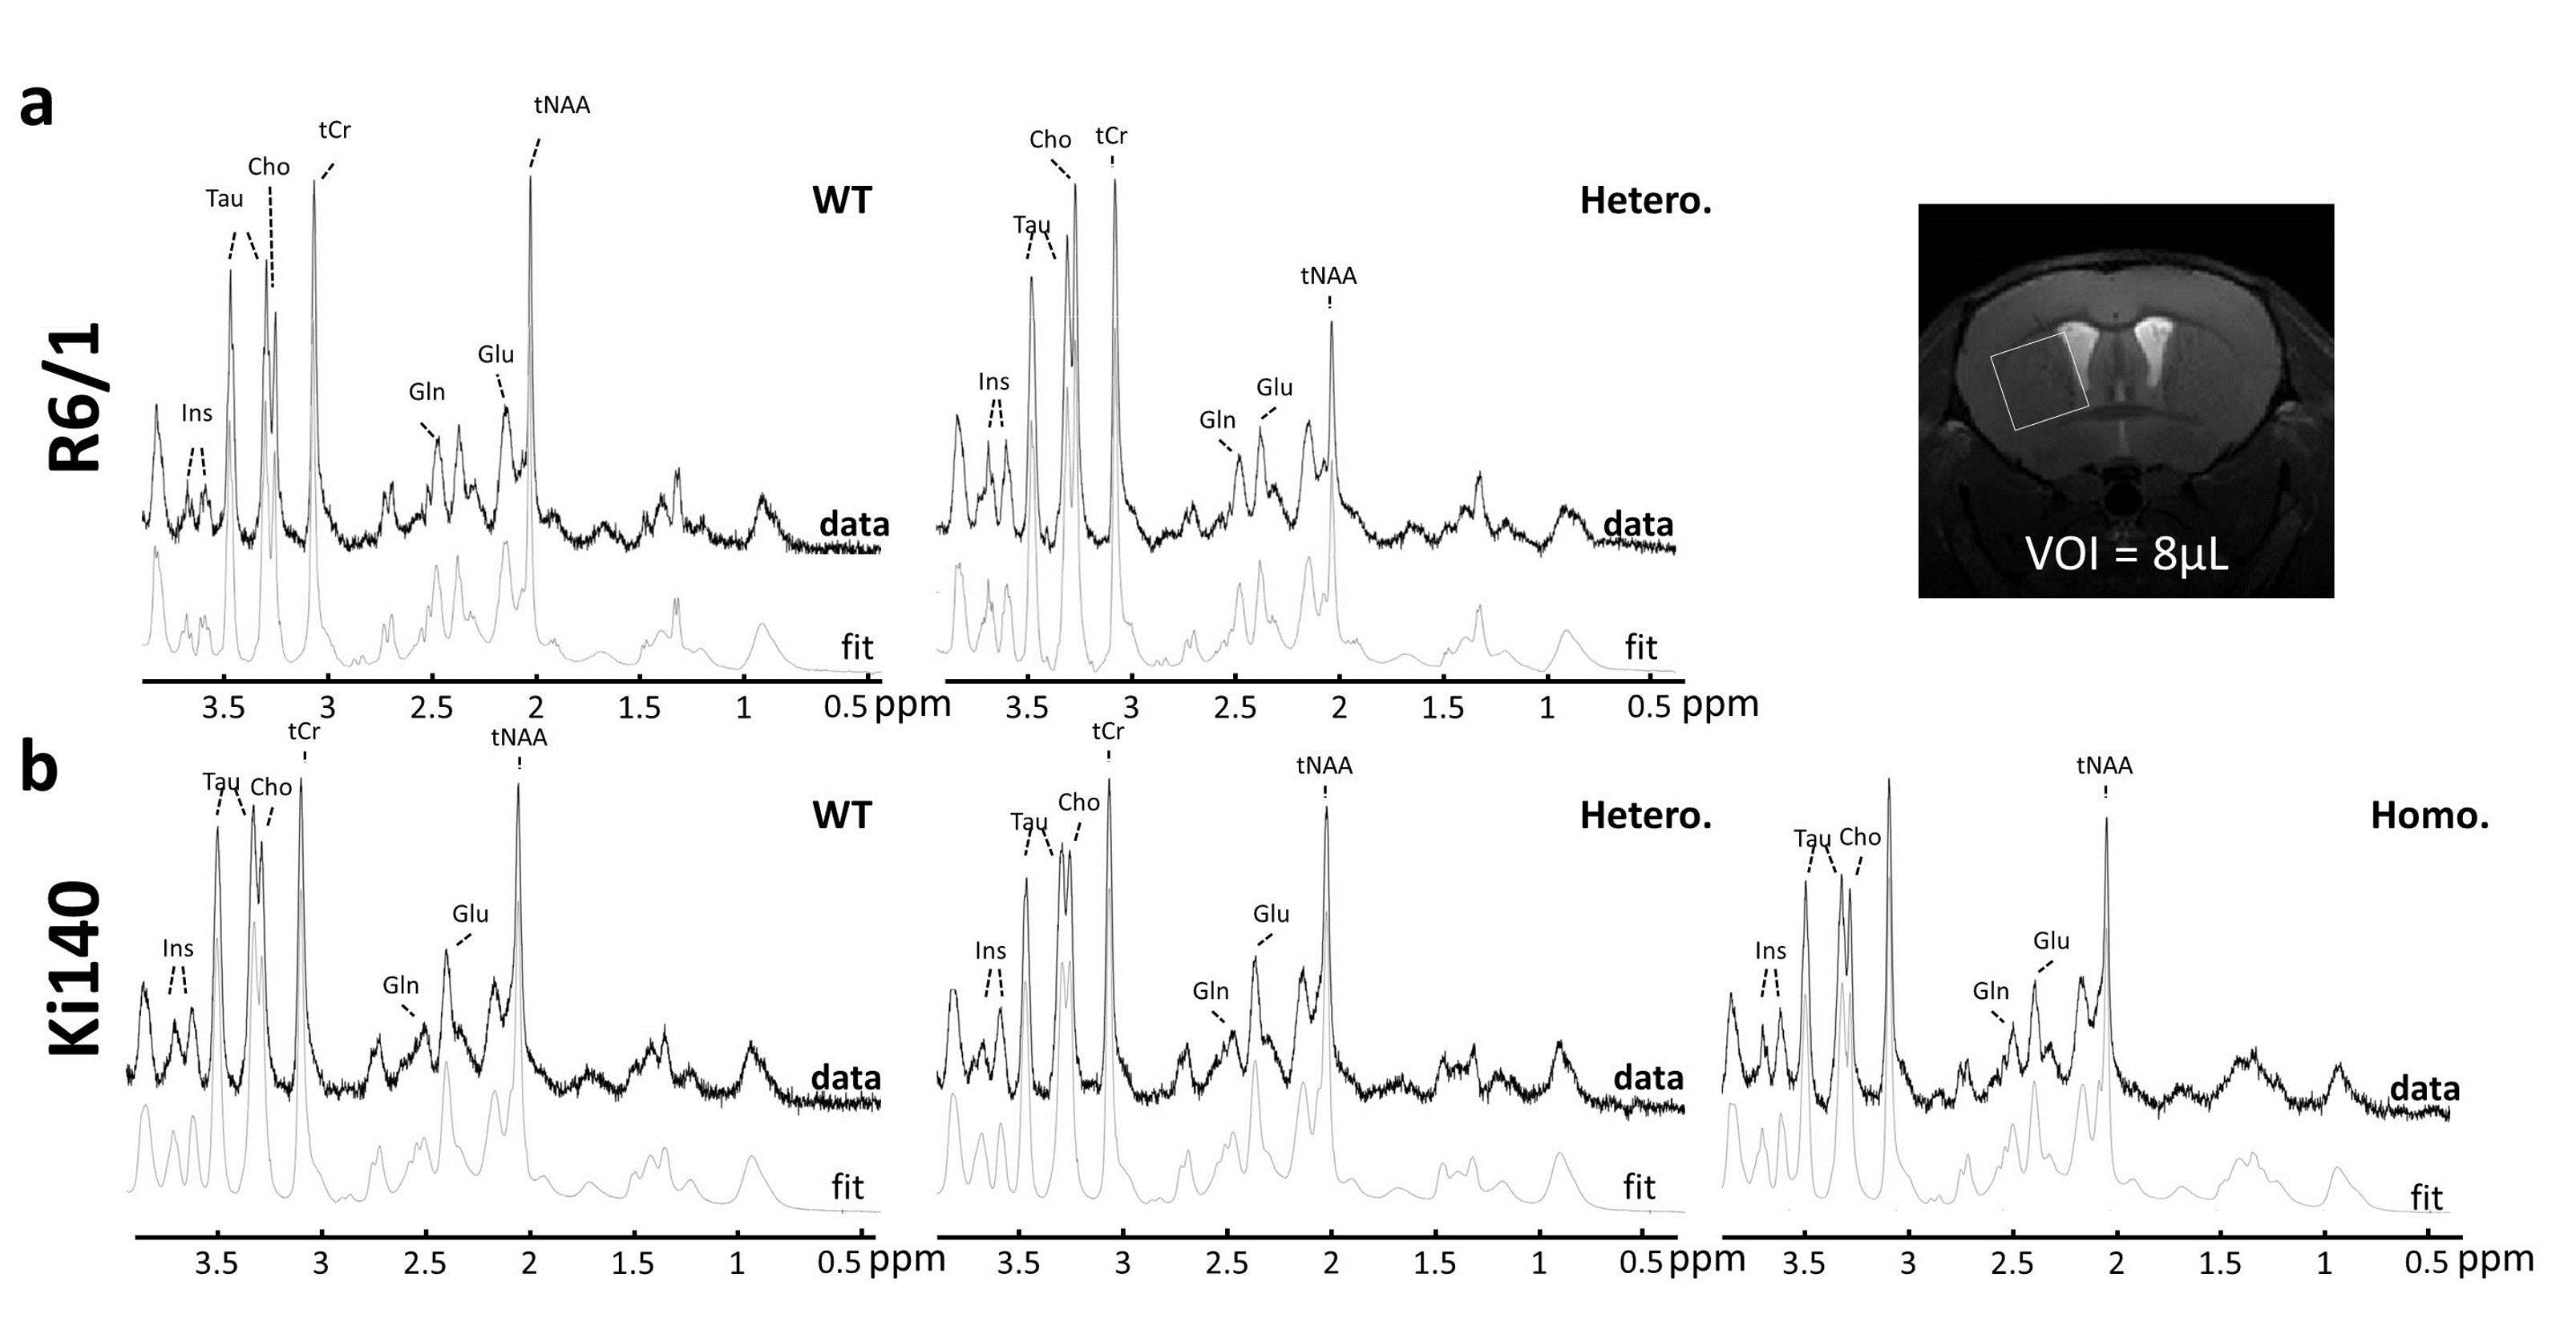
1H-MRS and gluCEST: data were acquired on a horizontal 11.7T Bruker magnet. The 1H-MRS spectrum was acquired in a voxel positioned in the left striatum (8 µL) using LASER sequence. GluCEST images were acquired using TSE sequence preceded by a continuous wave saturation pulse of 1s with an intensity B1 of 5 µT applied at frequencies ranging from -5 to 5 ppm with a step of 0.5 ppm. B0 inhomogeneity was corrected using WASSR method5. GluCEST images were calculated using asymmetric Magnetization Transfer Ratio (MTRasym) at ±3 ppm2.
RESULTS
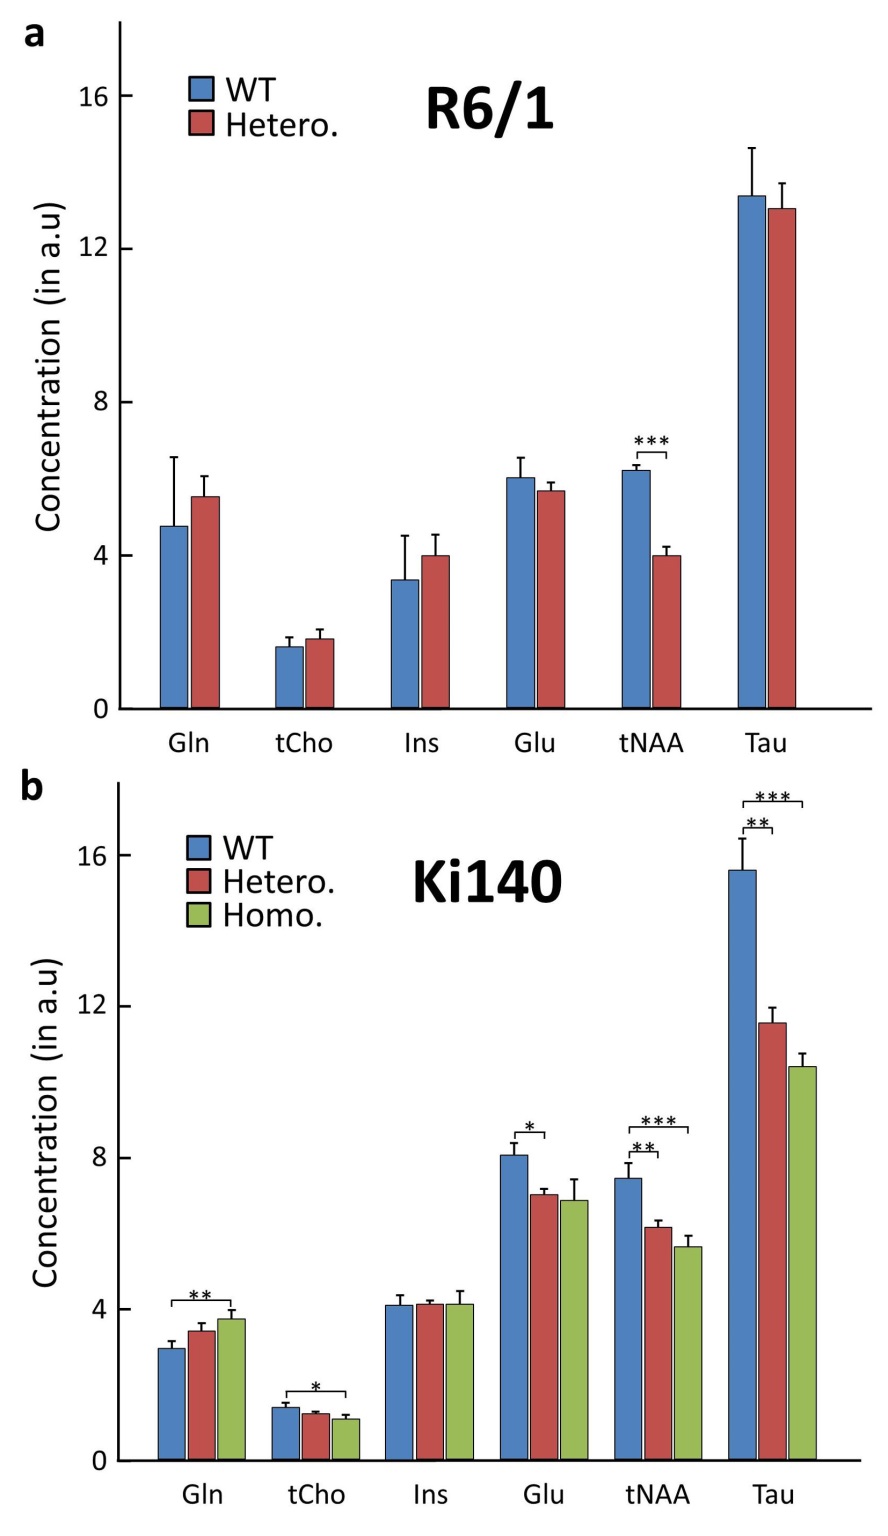
1H-MRS: Figure 1 shows typical spectra acquired in R6/1 (Fig.1.a) and Ki140 mice (Fig.1.b). Mean metabolic profiles are shown in figure 2. Both models exhibited a significant decrease of tNAA (-36.4% in R6/1, Fig.2.a; -17.4% and -24.3% in Ki140-Hetero and Ki140-Homo respectively, Fig.2.b). Ki140-Hetero group exhibited a significant increase of Gln (+27%) and significant decrease of Glu (-13.0%). In Ki140-Homo, Glu was reduced by -14.9% but this did not reach statistical significance.
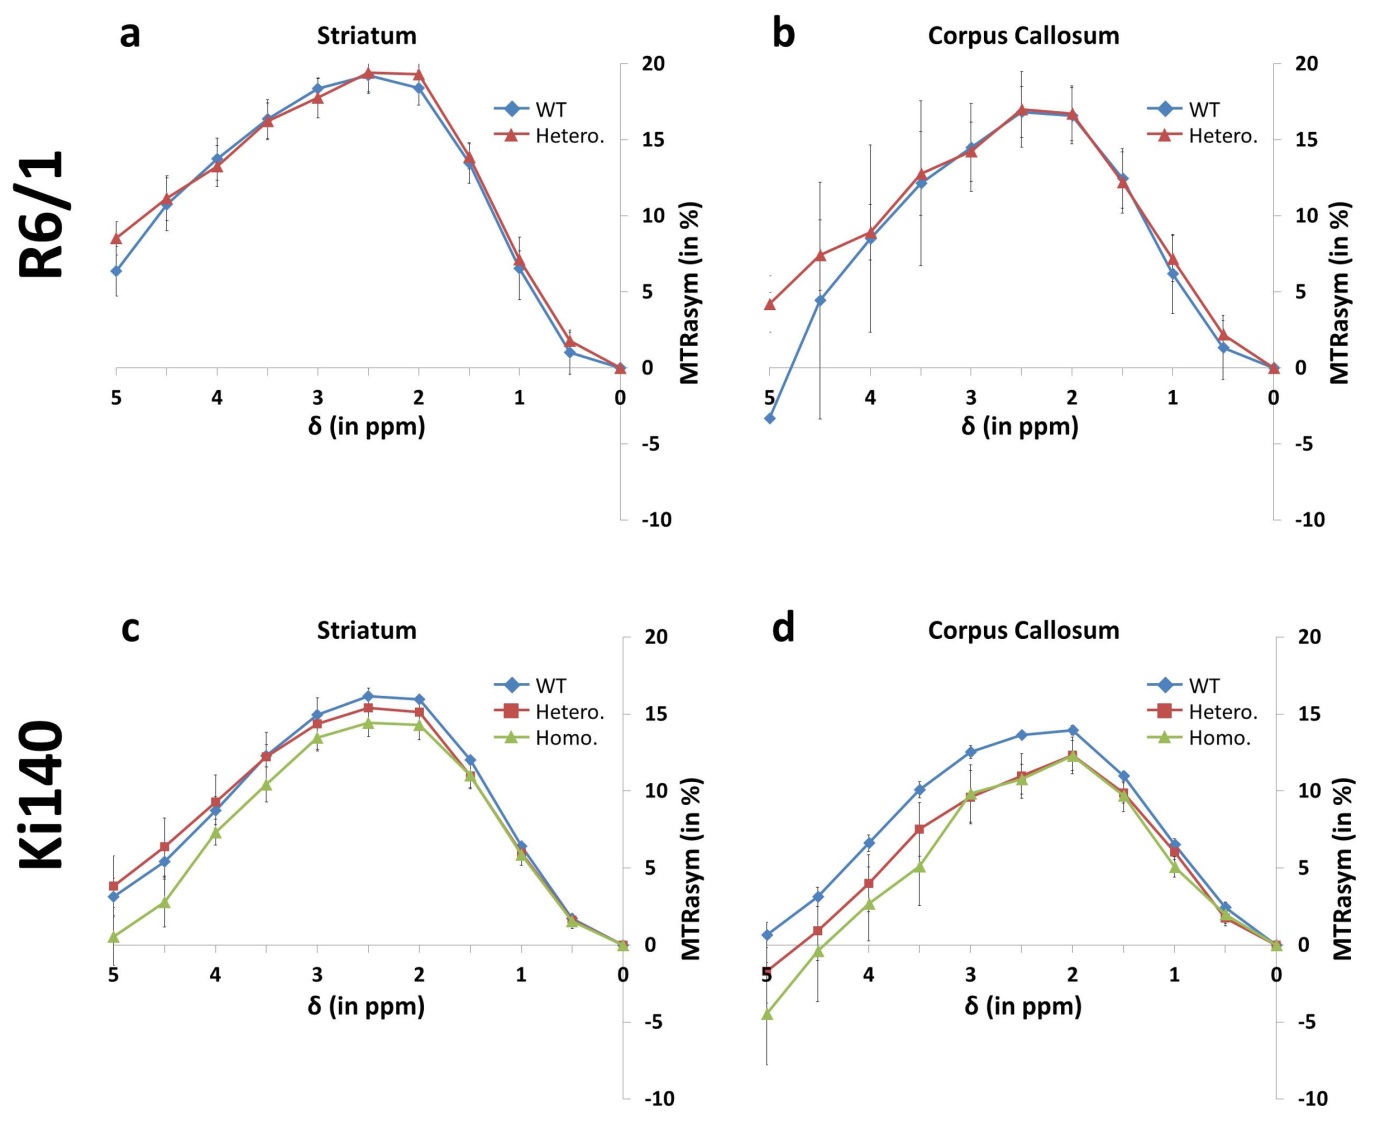
GluCEST: Figure 3
shows mean MTRasym spectra acquired in R6/1 and Ki140 mice in the striatum (Fig.3.a and .c respectively) and in the corpus callosum (Fig.3.b and .d
respectively). GluCEST data confirmed the decrease of Glu level in Ki140 mice
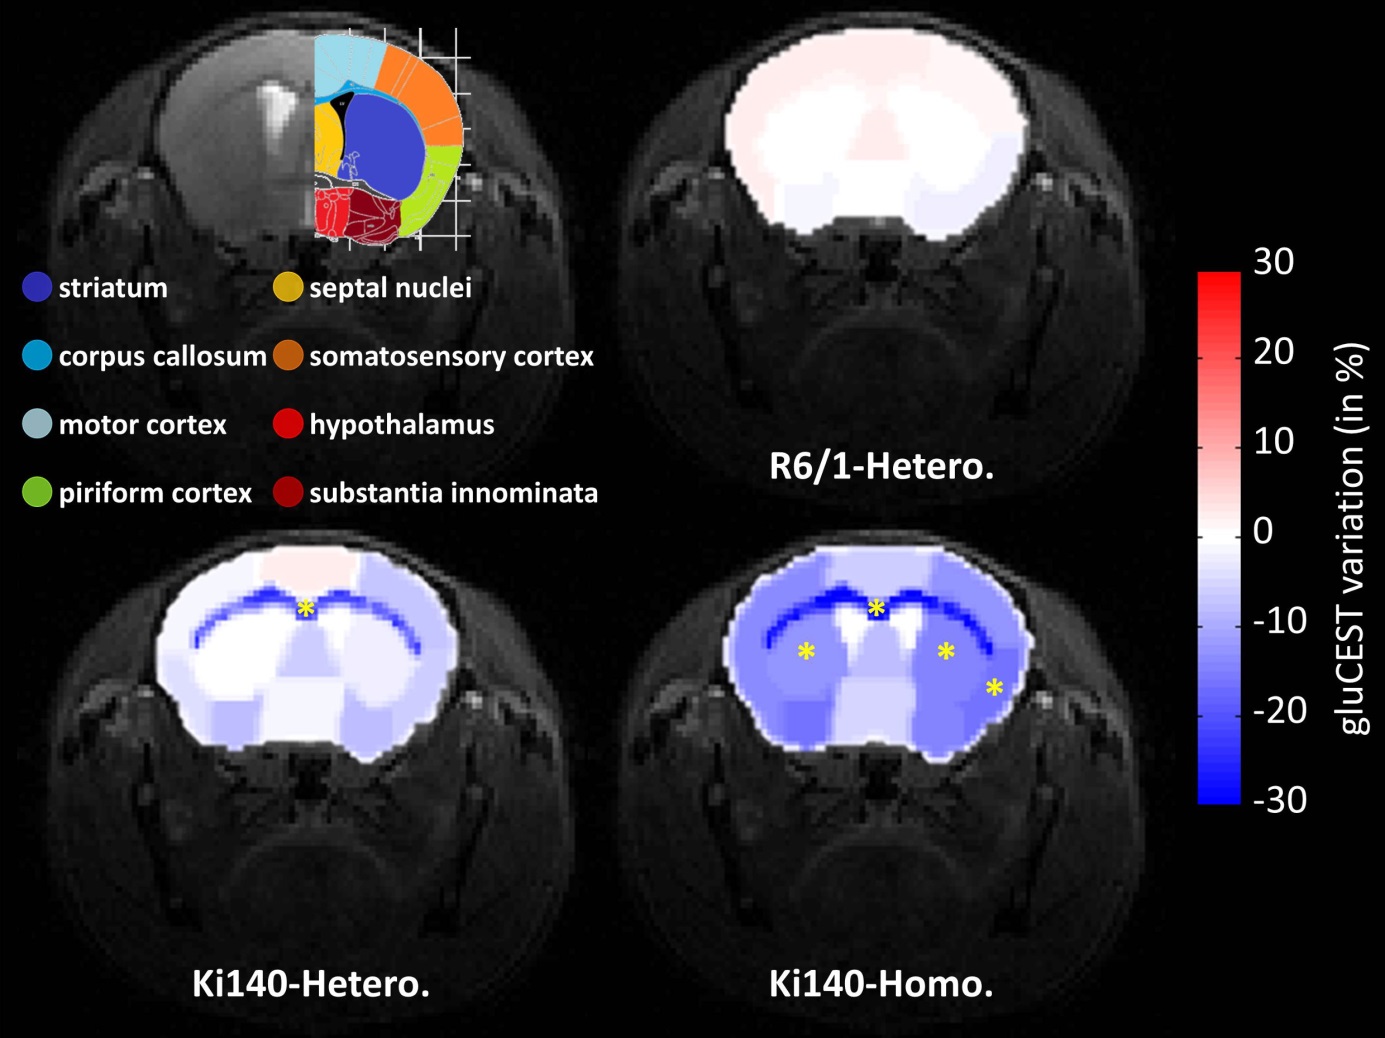
while no significant differences were observed in R6/1 mice. Eight ROIs were
drawn (Fig.4, top left panel) and variations
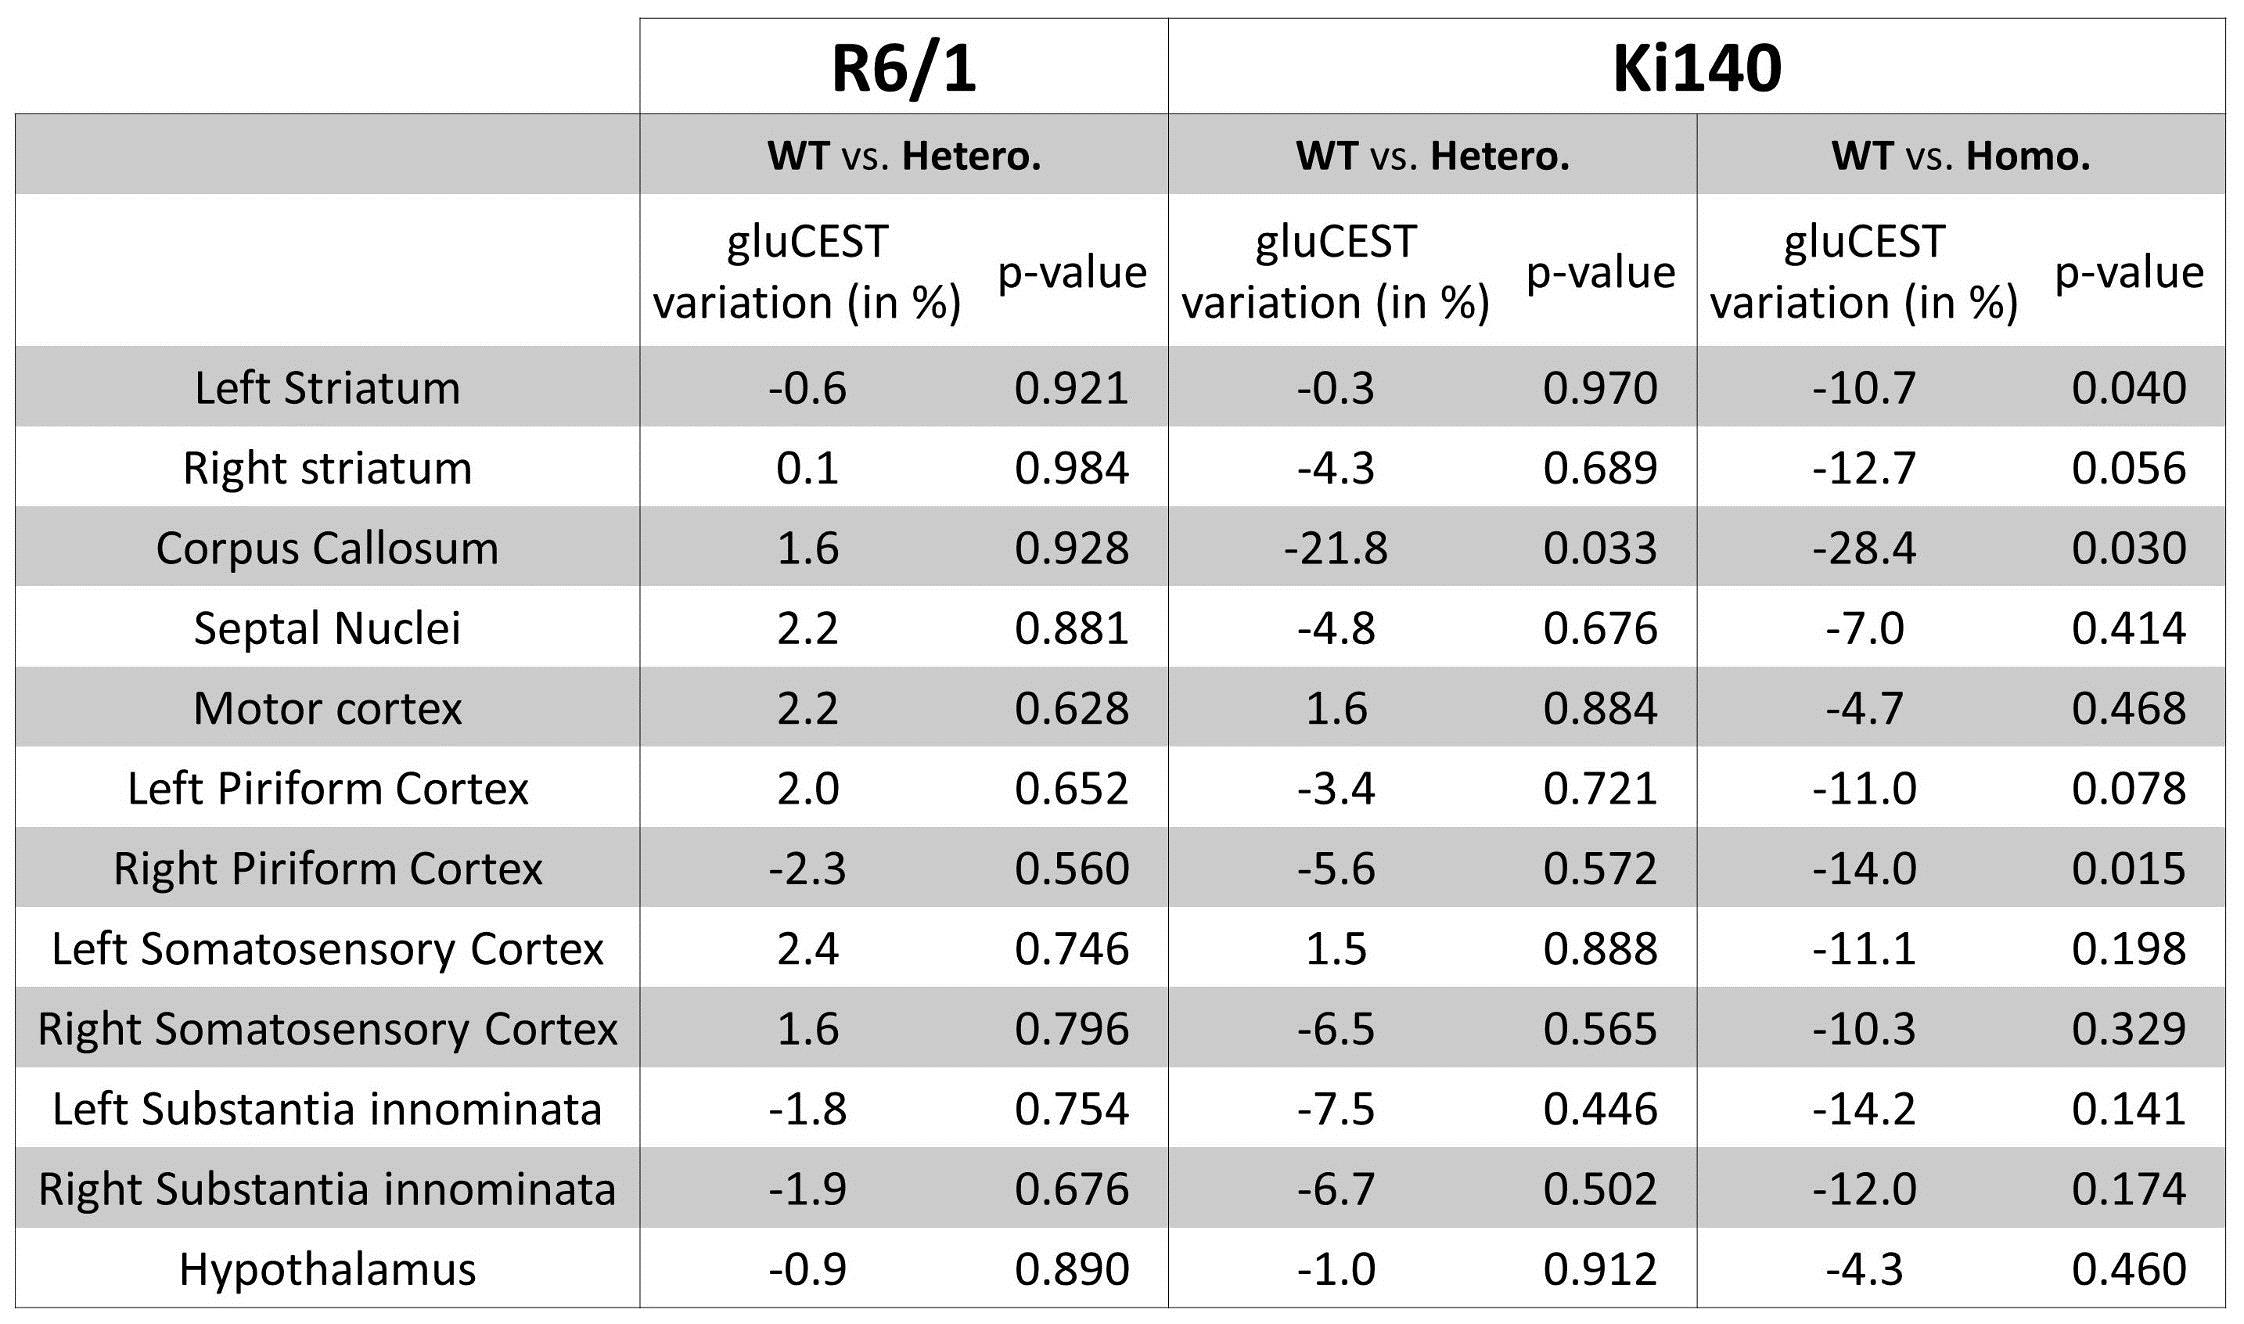
of gluCEST contrast between WT and HD mice were calculated2. Variation
map in R6/1 exhibited no significant Glu level modification in any ROI (Fig.4, top right). Ki140-Homo mice exhibited a decrease of Glu across
the whole brain (Fig.4, bottom
right), the decrease in Ki140-Hetero being
milder (Fig.4, bottom left), confirming a “gene-dose” effect in this mouse model2. Surprisingly, the most affected structure in both
heterozygous and homozygous Ki140 mice was the corpus callosum (-21.8% and
-28.4% respectively). All variations and p-values are resumed in Table 1.
DISCUSSION
1H-MRS results confirmed
the high variability between animal models of HD seen in literature2,6-8. The decrease in [Glu] and [tNAA], two neuronal metabolites, suggests
neuronal alterations in Ki140 mice whereas only tNAA was significantly altered
in R6/1 mice. In addition, increase in [Gln], an astrocytic metabolite, may
reflect a slight inflammation or astrocytic reactivity in Ki140 mice. If 1H-MRS provides rich and specific
information about neuronal or astrocytic status, the use of relatively large
and rectangular voxel requires strong a priori and is very limiting for the
study of a particular structure. In contrast, gluCEST was able to point out
alteration of the corpus callosum in Ki140 mice, which was not expected at
first. Contrarily to 1H-MRS which requires rectangular voxel,
leading most of the time to partial volume effects, contamination from
surrounding structures was limited in gluCEST, allowing more accurate analyze
of individual structures. Nonetheless, gluCEST was not suitable to study R6/1
model as Glu level was not significantly impaired in any brain region.
CONCLUSION
By combining 1H-MRS and gluCEST, we have shown striking differences between 2 mouse models of HD and highlighted the potential of both methods to monitor animal models. Given the wide variety of animal models, a protocol combining 1H-MRS and gluCEST can provide different readouts to monitor disease progression or treatment efficacy and improve the use of animal models for the study of neurodegenerative diseases. With the increasing availability of clinical 7T scanners, such protocol should also be useful for clinical investigations.Acknowledgements
This work was funded by Agence Nationale pour la Recherche (grant #14-15CE-0007-01).References
1. Cai K, Haris M, Singh A, et al. Magnetic resonance imaging of glutamate. Nat Med. 2012;18(2):302-306.
2. Pepin J, Francelle L, Carrillo-de Sauvage MA, et al. In vivo imaging of brain glutamate defects in a knock-in mouse model of Huntington's disease. Neuroimage. 2016;139:53-64.
3. Menalled LB, Sison JD, Dragatsis I, Zeitlin S, Chesselet MF. Time course of early motor and neuropathological anomalies in a knock-in mouse model of Huntington's disease with 140 CAG repeats. The Journal of comparative neurology. 2003;465(1):11-26.
4. Mangiarini L, Sathasivam K, Seller M, et al. Exon 1 of the HD gene with an expanded CAG repeat is sufficient to cause a progressive neurological phenotype in transgenic mice. Cell. 1996;87(3):493-506.
5. Kim M, Gillen J, Landman B, Zhou J, van Zijl P. Water Saturation Shift Referencing (WASSR) for Chemical Exchange Saturation Transfer (CEST) Experiments. Magnetic Resonance in Medicine. 2009;61(6):1441-1450.
6. Zacharoff L, Tkac I, Song Q, et al. Cortical metabolites as biomarkers in the R6/2 model of Huntington's disease. J Cereb Blood Flow Metab. 2012;32(3):502-514.
7. Tkac I, Henry PG, Zacharoff L, et al. Homeostatic adaptations in brain energy metabolism in mouse models of Huntington disease. J Cereb Blood Flow Metab. 2012.
8. Jenkins BG, Andreassen OA, Dedeoglu A, et al. Effects of CAG repeat length, HTT protein length and protein context on cerebral metabolism measured using magnetic resonance spectroscopy in transgenic mouse models of Huntington's disease. J Neurochem. 2005;95(2):553-562.
Figures