1100
3T 1H PRESS (TE 68 ms) reveals elevated cerebral glucose in patients with diabetes mellitus type 2, which is associated with fasting blood glucoseFrank C.G. van Bussel1, Tamar M van Veenendaal1, Miranda T Schram2, Coen D.A. Stehouwer2, Walter H Backes1, and Jacobus F.A. Jansen1
1Radiology, Maastricht University Medical Center, Maastricht, Netherlands, 2Internal Medicine, Maastricht University Medical Center, Maastricht, Netherlands
Synopsis
A standard 1H PRESS sequence, with a TE of 68 ms, acquired at 3T is applied to investigate differences in cerebral glucose concentrations in type 2 diabetes mellitus (T2DM ) compared with controls with normal glucose metabolism. Subjects with T2DM (n=38) display an increased cerebral glucose level compared to controls (n=38). These levels are also associated with two blood glucose measures, fasting blood glucose (FBG) and glycated hemoglobin (HbA1c).
Purpose
Type 2 diabetes mellitus (T2DM) is a common and chronic metabolic disease and is characterized by elevated blood glucose levels caused by insulin deficiency or insulin resistance. T2DM has a broad range of serious systemic complications and is also associated with cognitive decline and macrostructural as well as physiological brain alterations1. It remains to be shown whether systemic glucose elevation also holds true for cerebral glucose. The detection of cerebral glucose is traditionally regarded a challenging endeavor2, for which solutions have been proposed that involve glucose infusions, 13C-labeled compounds, spectral editing, or high field (≥4T). The current study was initiated by a serendipitous observation that the LCModel analysis of the OFF spectrum from the MEGA-PRESS spectral editing approach for GABA detection appeared to yield a valid glucose estimation. Here, we apply a standard 1H PRESS sequence, with a TE of 68 ms, acquired at 3T. The goal of the present study was to investigate differences in cerebral glucose concentrations in T2DM compared with controls with normal glucose metabolism.Methods
Thirty-nine healthy participants and 40 participants with T2DM were included. All MR measurements were performed on a 3T Philips Achieva TX MR scanner with a 32 channel head coil. A 3x3x3 cm3 voxel-of-interest was placed in the occipito-parietal lobe (Figure 1), on a T1-weighted image. PRESS was acquired with TE/TR 68/2000 ms, 160 averages, editing pulse at 7.46 ppm, MOIST water suppression, and water spectrum (8 averages). Spectra were all analyzed with LCModel3 version 6.3-1L (Figure 2). A standard basis set was applied, with sixteen simulated metabolites, including glucose (Glc) and total creatine (tCr). Spectra were analyzed from 0.2 to 4.0 ppm. Eddy current correction was included in all analyses. Frequency and phase correction was implemented and applied to the averaged spectrum. Glucose concentrations are given relative to total Creatine (Glc/tCr), and were only considered when absolute Cramér–Rao lower bounds (CRLB) < mean+2*SD of the controls4. Linear regression analyses, adjusted for age, sex, BMI, and gray matter fraction in the voxel (gray matter fraction divided by the sum of the white and gray matter fractions) were performed to assess the association of Glc/tCr concentrations with type 2 diabetes status. Additionally, analyses with fasting blood glucose (FBG) or glycated hemoglobin (HbA1c, average level of blood sugar over the past 3 months) instead of diabetes status were performed.Results
Spectra from one control and three T2DM participants did not fulfill quality criteria (absolute CRLB > 0.20), thus data from 38 controls and 38 T2DM were included for final analysis (Figure 3). Linear regression revealed an increased Glc/tCr level for T2DM (standardized β=0.47, p=0.001) compared to controls (Figure 4). Other covariates were not significant (p>0.56). Additional linear regression analyses revealed a positive relationship of Glc/tCr with FBG (standardized β=0.37, p=0.008, Figure 5) and with HbA1c (standardized β=0.42, p=0.002).Discussion
Subjects with T2DM display an increased cerebral glucose tissue level, as detected using 1H PRESS. These levels are also associated with blood glucose measures (FBG and HbA1c). Interestingly, a previous 4T ultra short STEAM study with type 1 diabetes (T1DM)5 did not find differences in cerebral metabolites, which might hint at a different biology underlying T1DM and T2DM. As Glc resonates in a very crowded region of the NMR spectrum (3-4 ppm), traditional detection of Glc is quite challenging2. It appears that by using a 1H PRESS sequence with a TE of 68 ms, overlapping peaks (including GABA, glutamate, glutamine, inositol, macromolecules) are relatively suppressed, enabling LCModel to provide a significant estimate for Glc. Indirect validation of this approach is provided by the fact that the observed cerebral Glc/tCr is significantly elevated in T2DM, and that the Glc/tCr concentration is strongly associated with blood glucose measures (FBG and HBA1c). However, proper experiments with phantoms containing all compounds (including macromolecules) that have overlapping NMR signals are required to validate the prospect of detection Glc using 1H PRESS at 3T.Conclusion
An easy to implement 1H PRESS with a TE of
68 ms at 3T in combination with LCModel can provide significant estimates of
cerebral Glc levels. This approach shows that cerebral Glc is elevated in T2DM,
and that cerebral MRS-derived Glc is associated with blood glucose levels.Acknowledgements
No acknowledgement found.References
1. Awad N, Gagnon M, Messier C. The relationship between impaired glucose tolerance, type 2 diabetes, and cognitive function. J Clin Exp Neuropsychol. 2004;26(8):1044-1080. 2. De Graaf RA, In vivo NMR spectroscopy, Principles and Techniques, John Wiley & Sons Ltd, Chichester, UK, 1998. 3 Provencher SW. Estimation of metabolite concentrations from localized in vivo proton NMR spectra. Magn Reson Med. 1993;30(6):672-679. 4. Kreis R, The trouble with quality filtering based on relative Cramér-Rao lower bounds, Magn Reson Med. 2016;75(1):15-8. 5. Mangia S, et al. Neurochemical profile of patients with type 1 diabetes measured by 1H-MRS at 4T, J Cereb Blood Flow Metab. 2013;33(5):754-9.Figures
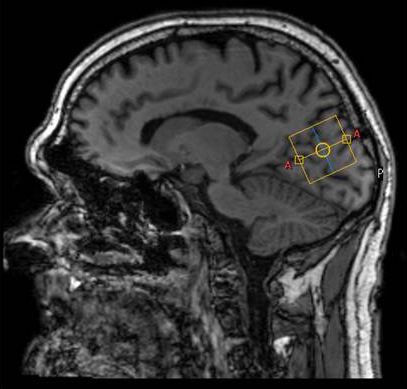
Figure 1) Sagittal
view of T1-weighted image of participant with diabetes indicating the 1H-MRS
voxel (yellow) in the occipito-parietal lobe.
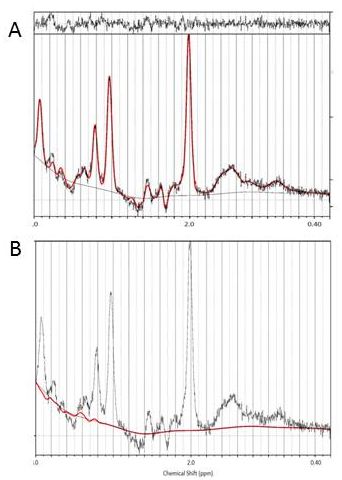
Figure 2A) Representative
PRESS spectrum (black line) and LCModel fit (red line) of a participant with
T2DM. B) Individual estimate for Glc.
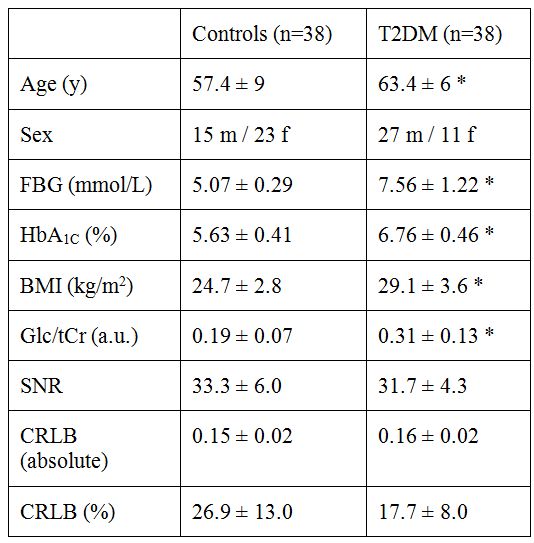
Figure 3) Table with
clinical characteristics of T2DM and control groups (mean ± SD).
FBG, fasting
blood glucose; HbA1C, glycated hemoglobin; BMI, body mass index; Glc/tCr
(a.u.), glucose over total creatine concentration (arbitrary units); SNR,
signal-to-noise ratio; CRLB, Cramér-Rao lower bounds. * p < 0.0005, Student’s
t-test.
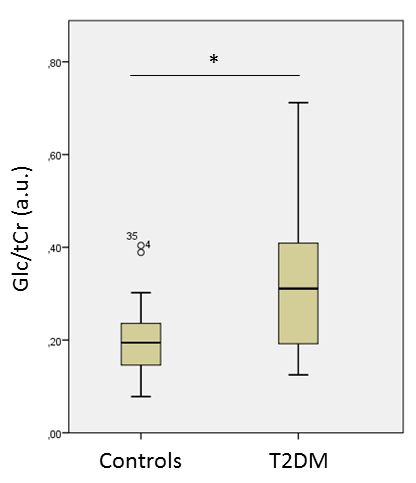
Figure 4) Boxplots
indicating Glc/tCr concentrations for T2DM and controls. * p=0.001 (linear
regression, corrected for age, sex, BMI, and gray matter fraction)
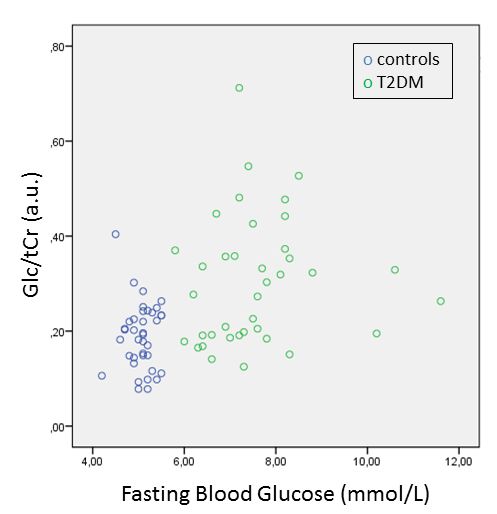
Figure 5) Scatterplots
indicating Glc/tCr concentrations as
function of fasting blood glucose. Controls are blue, T2DM participants are green.