1099
Improved Differentiation of Low- and High-Grade Gliomas by APT Contrast Fitted from Z-Spectrum1Center for MR Research, University of Illinois at Chicago, Chicago, IL, United States, 2Department of Radiology, Tongji Hospital, Huazhong University of Science and Technology, Wuhan, People's Republic of China, 3Department of Radiology, University of Illinois at Chicago, Chicago, IL, United States, 4Departments of Radiology, Neurosurgery, and Bioengineering, University of Illinois at Chicago, Chicago, IL, United States, 5Departments of Radiology and Bioengineering, University of Illinois at Chicago, Chicago, IL, United States
Synopsis
Preoperative grading is important for treatment planning in glioma patients. Amide proton transfer (APT) -weighted imaging is helpful in grading since it reflects metabolic changes associated with mobile proteins and peptides. However, the conventional APT based on asymmetrical analysis receives contaminations from semi-solid magnetization transfer asymmetry and nuclear overhauser enhancement effects. Multi-component Z-spectral fitting for the separated quantification of APT can help to remove those contaminations. In this study, we performed such fitting on Z-spectral data from glioma patients. We found that fitted APT provided higher power in differentiating low- and high- grade gliomas compared to the conventional APT quantification.
Introduction:
Gliomas are the most common primary brain tumors. They are classified into four grades according to the 2007 World Health Organization criteria1. Since the prognosis and treatment of low-grade (LG:Ⅰ and Ⅱ) and high-grade (HG:Ⅲ and Ⅳ) gliomas are quite different, it’s very important to make preoperative grading. It has been shown that amide proton transfer (APT) MRI contrast is sensitive to intracellular mobile proteins and peptides2, which markedly increases as glioma cells proliferate. However, the conventional APT based on asymmetrical analysis may lead to quantification errors due to the confounding semi-solid magnetization transfer (MT) asymmetry and aliphatic nuclear overhauser enhancement (NOE) effects3,4. A previous research5 demonstrated that multi-component Z-spectral fitting for separated quantification of APT can help to remove those contaminations. In this study, we performed the fitting of Z-spectra from patients with low and high-grade gliomas and tested if fitted APT contrast provides higher power for grading gliomas than the conventional APT quantification.Materials and Methods:
Subjects:
Under an IRB protocol approved by the institutional review board, 32 patients with gliomas were recruited and underwent CEST scan before biopsy or surgery. Among these patients (male: 21, with age of 16-66 years, female: 11, with age of 18-63 years), 16 low-grade gliomas and 16 high-grade gliomas were confirmed by histopathology according to WHO guideline of 2007.
Image Acquisition:
All MR imaging examinations were performed on a 3T GE MR750 scanner with a 32-channel head coil. The Z-spectral data was collected with the following acquisition parameters: TR=3s, field of view= 24x24cm2, matrix=128×128, slice thickness=5mm, NEX=2, RF saturation time=400ms. The entire Z-spectrum contains a total of 33 images acquired at various saturation offsets, including -4 to +4ppm in an increment of 0.25ppm, ±4 to ±5ppm in an increment of 0.5ppm, ±6ppm, +15.6ppm, and +39.1ppm. The total scanning time for Z-spectral data was about 3 min.
Image processing:
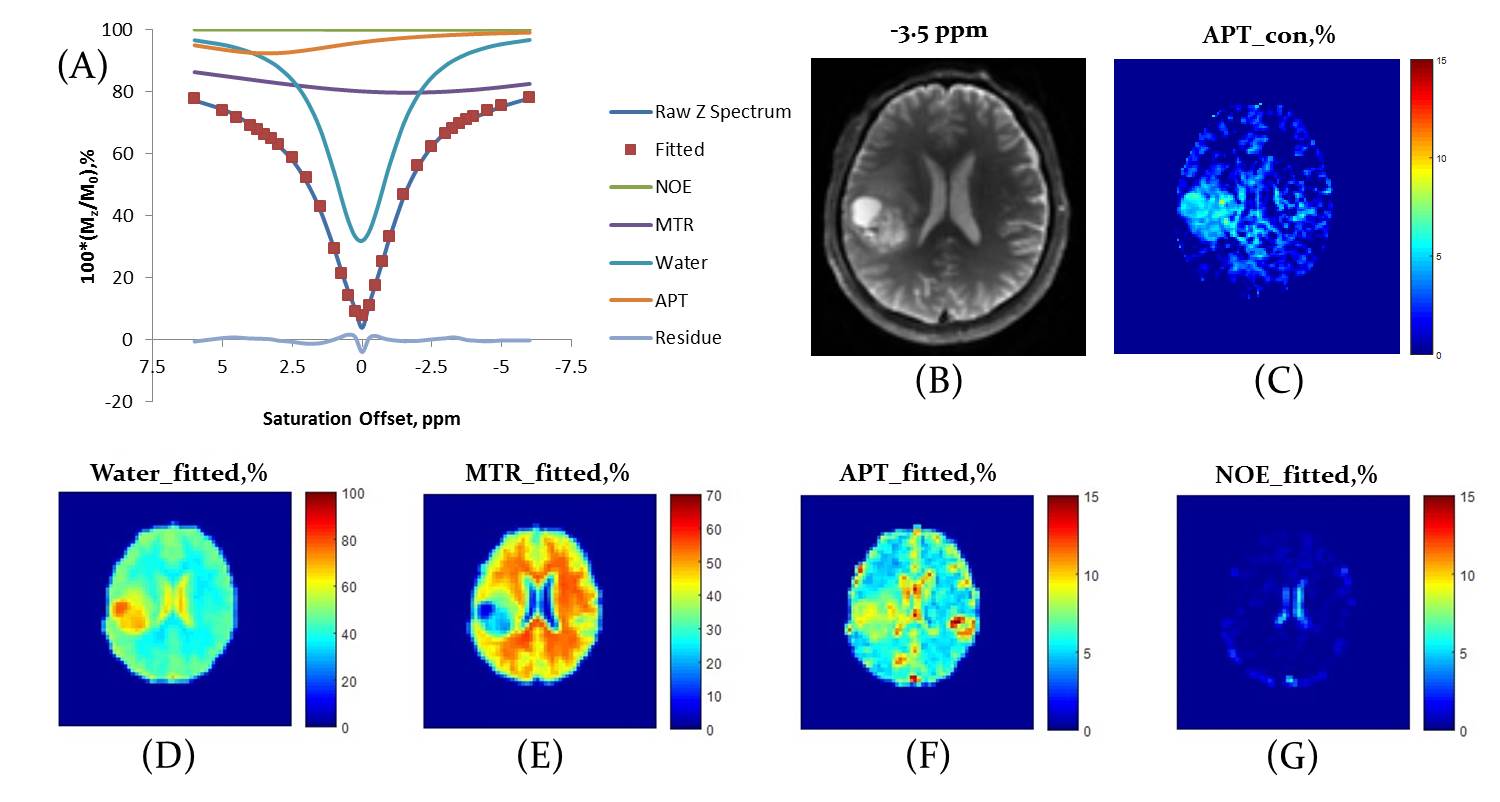
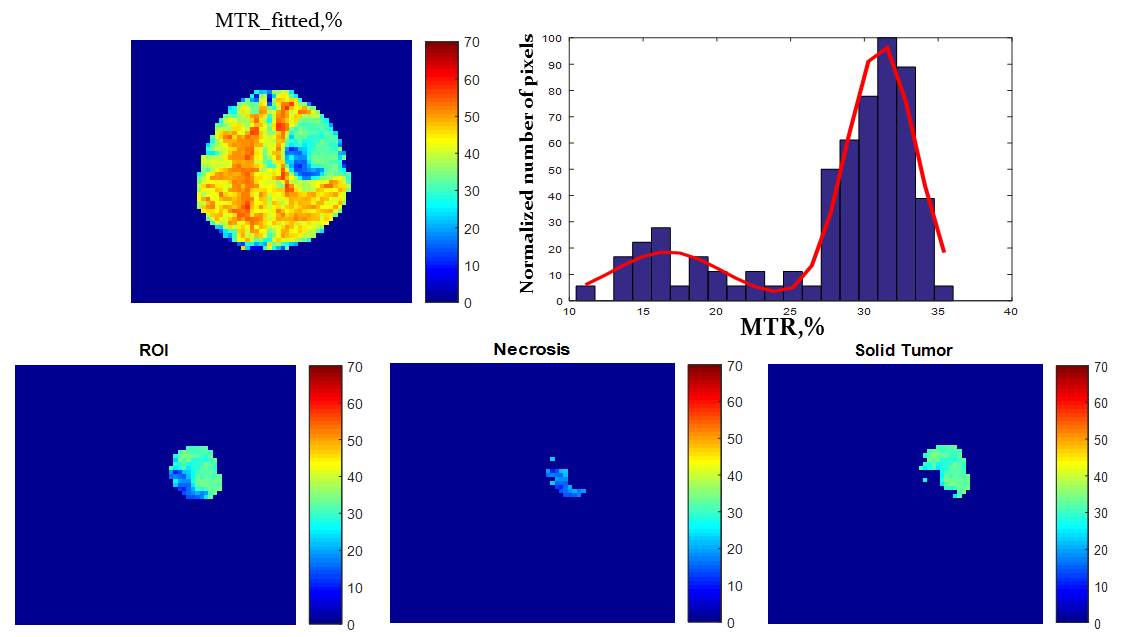
Before the fitting, Z-spectra within ±6ppm range were normalized by the signal at +39.1 ppm and center-corrected using B0 field map. Z-spectra were fitted with a sum of four Lorentzian functions6 corresponding to NOE, MT effect, bulk water, and APT effect located at around −3.2, −1.5, 0, and 3.6 ppm, respectively. The nonlinear constrained fitting routine “lsqcurvefit” was performed in MATLAB 2014. After the fitting, ROI-based analyses were performed to summarize the fitted amplitudes of APT (APT_fitted), MTR (MTR_fitted), and water (Water_fitted) respectively. Due to the small amplitude of the fitted NOE, analyses based on NOE amplitude alone were not performed. The same ROI-based calculation was performed for conventional APT contrast (APT_con) with B0 correction7 (Fig.1). To avoid the dominant influence on MRI contrasts due to tumor necrosis, which is associated with much lower MTR8, the histogram of pixal MTR from the whole tumor region was fitted with two Gaussian distributions to determine a cutoff MTR that was used to exclude tumor necrotic areas during regions of interest (ROI)-based analyses (Fig.2).
Statistical Analysis:
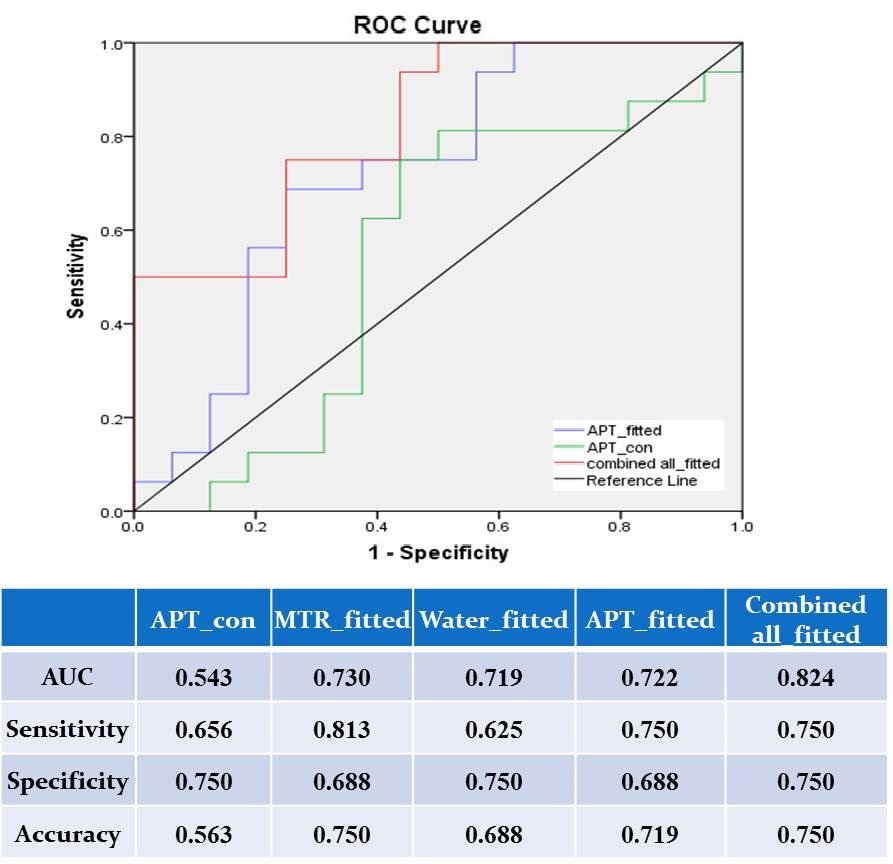
All the parameters were compared between LG and HG glioma groups by Mann-Whitney U-test with a statistical significance set at 0.05. To investigate the potential value of using the combination of the fitted Water, MTR, APT, and NOE contrast (all_fitted) for the differentiation of LG and HG gliomas, a binary logistic regression method was performed in IBM SPSS statistics 24. Receiver operating characteristic (ROC) analysis was performed to determine the area under the curve (AUC) of APT_fitted, APT_con and combined all_fitted for differentiating LG and HG gliomas. Sensitivity, specificity and diagnostic accuracy of APT_con, MTR_fitted, Water_fitted, APT_fitted, and combined all_fitted contrast were calculated respectively.
Results and Discussion:
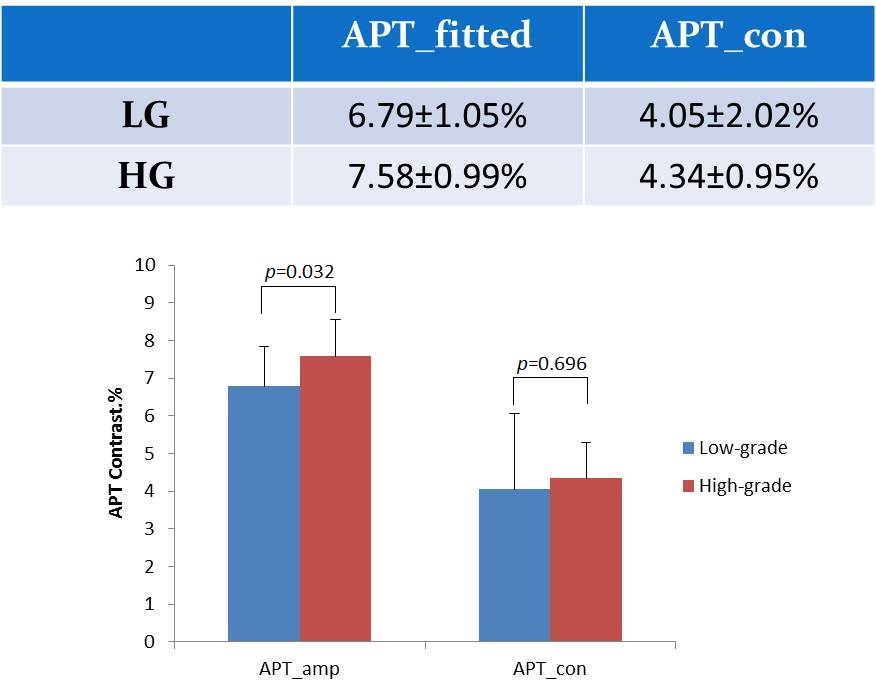
The descriptive statistics of the conventional APT data showed higher conventional APT contrast in HG (4.34±0.95%) than LG (4.05±2.02%) gliomas, which was consistent with the previous studies9,10, in which no Z-spectral fitting was performed. Note, the difference in this study was not statistically significant (p>0.05) likely due to the relative small sample size. In contrast, the fitted APT contrast of HG (7.58±0.99%) and LG (6.79±1.05%) groups had a significant difference (p<0.05), which showed a better diagnostic power than conventional APT contrast (p>0.05) (Fig.3). When combined fitted water, MTR, APT and NOE, a higher AUC and diagnostic accuracy were obtained. In addition to the fitted APT contrast, the rest of the fitted parameters also contributed to differentiation of gliomas (Fig.4).Conclusion:
In conclusion, Z-spectral fitted APT contrast quantification is more powerful in differentiation of LG and HG gliomas, compared to conventional APT quantification presumably by eliminating the contaminations from semi-solid MTR asymmetry and NOE. Moreover, Z-spectral fitting method provided additional imaging biomarkers together further improves the diagnostic accuracy.Acknowledgements
This work was supported in part by National Natural Science Foundation of China (NSFC) -81171308, 81401389 (Wenzhen Zhu). We thank for Drs. M. Muge Karaman, Alessandro Scotti, Zheng Zhong, Liping Qi, and Frederick C. Damen for helpful discussions.References
1. Louis DN, et al. The 2007 WHO classification of tumours of the central nervous system. Acta Neuropathol 2007; 114:97–109.
2. Zhou J, et al. Amide proton transfer (APT) contrast for imaging of brain tumors. Magn. Reson. Med. 2003; 50(6):1120-6.
3. Hua J, et al. Quantitative description of the asymmetry in magnetization transfer effects around the water resonance in the human brain. Magn. Reson. Med. 2007; 58:786–793.
4. CK. Jones, et al. Exchange-relayed nuclear Overhauser effect MRI. Proc 9th Annual Meeting ISMRM; Montreal. 2011. p. 2735.
5. Kejia Cai, et al. CEST Signal at 2ppm (CEST@2ppm) from Z-spectral Fitting Correlates with Creatine Distribution in Brain Tumor. NMR Biomed. 2015; 28: 1–8.
6. Desmond KL, et al. Mapping of amide, amine, and aliphatic peaks in the CEST spectra of murine xenografts at 7 T. Magnetic resonance in medicine. 2014; 71(5):1841–1853.
7. Kejia Cai, et al. Magnetic resonance imaging of glutamate. Nature Medicine. 2012; 18, 302–306.
8. Li KC, et al. Experimental hepatic tumor necrosis. Comparison of spin-echo and pulsed magnetization transfer contrast magnetic resonance imaging. Invest Radiol. 1993 Oct; 28(10):896-902.
9. Zhou J, et al. Amide proton transfer (APT) contrast for imaging of brain tumors. Magnetic resonance in medicine. 2003; 50(6):1120–1126.
10. Harris RJ, et al. pH-weighted molecular imaging of gliomas using amine chemical exchange saturation transfer MRI. Neurooncology. 2015;17(11):1514-1524.
Figures