1098
In Vivo Characterization of an Ultrashort-T2 Component in the Brain Reveals a Chemical Shift1Radiology and Biomedical Imaging, University of California - San Francisco, San Francisco, CA, United States, 2Ecole normale supérieure de Cachan, Paris, France, 3Neurology, University of California - San Francisco, San Francisco, CA, United States
Synopsis
A new approach for direct measurements of myelin content is to image an sub-millisecond T2 component in the brain, likely associated with myelin membrane protons . This study characterized this ultrashort-T2 component across the whole brain using a novel relaxometry approach at ultrashort echo times (UTEs). This component had an estimated T2* ~ 0.6-1.0 ms at 3T and ~0.2-0.4 ms at 7T, as well as an approximately -3.2 ppm frequency shift from water that has never been measured before in vivo. This verifies that the ultrashort-T2 component primarily arises from methylene protons, as in the myelin phospholipid membranes.
Introduction
It has recently been shown that myelin contains ultrashort T2 components with sub-millisecond relaxation times that are not observed with conventional pulse sequences and are likely associated with bound protons in the myelin phospholipid membranes 1-4. Measuring this component in the membranes has the potential to provide a more direct measure of myelination compared to current myelin imaging approaches that measure the myelin water, free water, or indirect measurements of bound protons. We developed a 3D ultrashort T2* relaxometry method to characterize the decay rate and frequency shift of these components across the entire brain at 3T and 7T.Methods
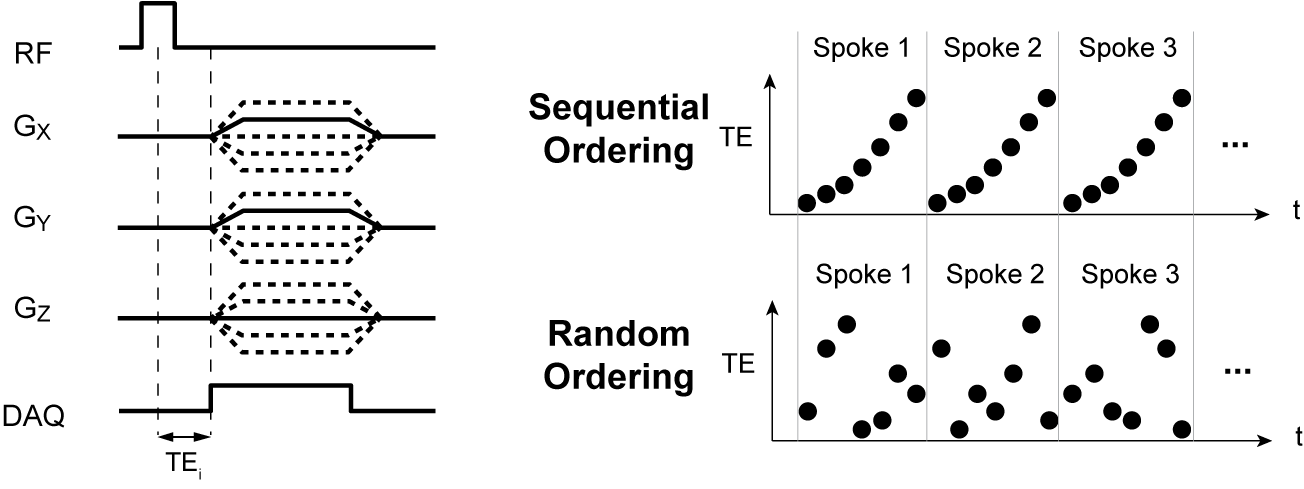
Acquisition: Whole-brain relaxometry was performed using a 3D UTE pulse sequence with a non-selective, hard pulse excitation and radial k-space readouts (Fig. 1) on 3 healthy volunteers. The delay between excitation and readout was shifted between TRs to acquire a set of 32 differents TEs within a single scan. Scan times were 45-50 minutes for 2.2mm isotropic resolution, TR = 10ms. Data was acquired on 3T and 7T GE MRI systems, both with a 32-channel head coil (Nova Medical). A non-Cartesian ESPIRiT parallel imaging reconstruction method 5 was implemented using BART (https://mrirecon.github.io/bart/) with acceleration factors from R=4 to 6.
To characterize sub-millisecond T2 components, multiple TE measurements less than 1ms are required. We chose to sample the same spoke in k-space repeatedly with multiple TEs to minimize the chance of motion artifacts that will likely be problematic over the long scan times required. Two TE ordering strategies were tested: (1) a sequential, regular TE ordering, and a (2) randomized TE ordering, where the ordering is randomized for each spoke (Fig. 1).
Fitting method: We fit our multiple TE data to the following signal model to estimate the component relaxation times,$$$T_{2}^*$$$, and frequency shifts, $$$\Delta f_k$$$:
$$S(TE)=\exp(i2\pi\Delta f_x TE) \sum_{k=1}^N \rho_{k} \exp(-TE/T_{2,k}^*) exp(i2\pi \Delta f_k TE + \phi_k)$$
The number of components to be fit, $$$N$$$, was determined based on Akaike’s Information Criteria (AIC) – a measure of model quality that trades off goodness of fit and model complexity. For accurate spatial mapping of off-resonant components, we also applied our fitting to an off-resonance reconstructed image. This image was created by demodulating the data at the expected off-resonant component frequency prior to ESPIRiT reconstruction.
Results and Discussion
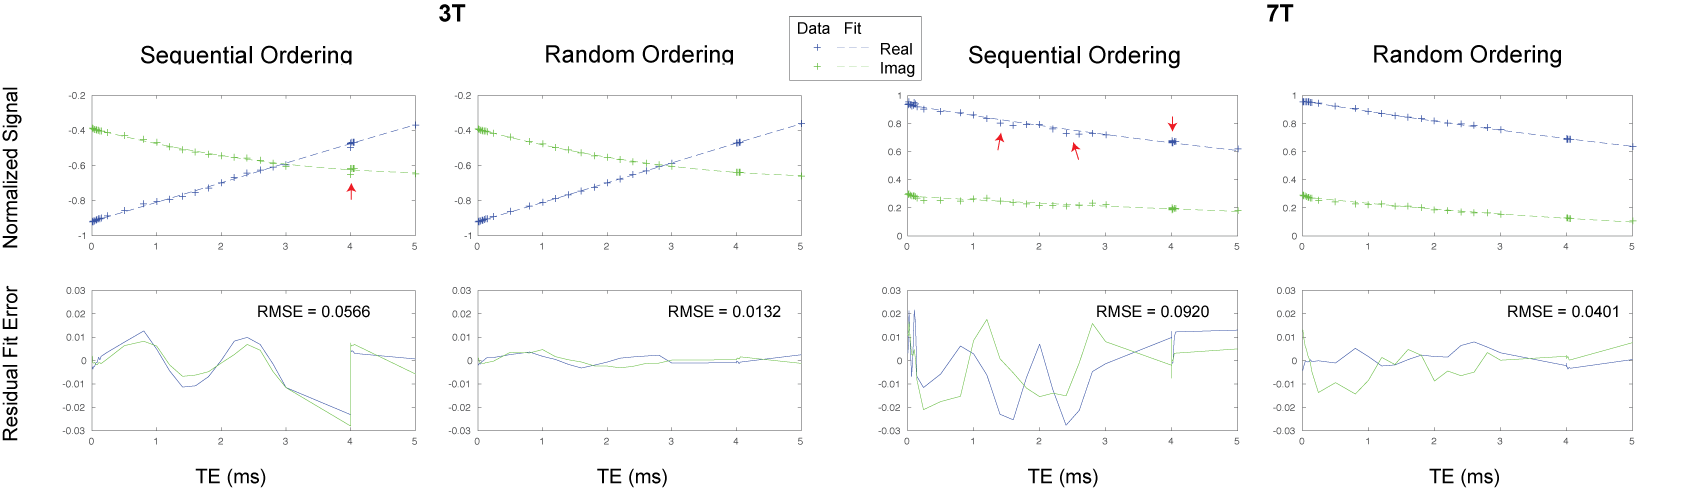
The phantom experiments in Figure 2 clearly demonstrate errors in multi UTE data with sequential, regular TE ordering that are effectively eliminated with randomized TE ordering. We speculate that these fluctuations are due to eddy currents with millisecond time constants that result in consistent distortions when gradient timings are constant for each TR but give rise to fluctuating distortions when the gradients are shifted each TR.
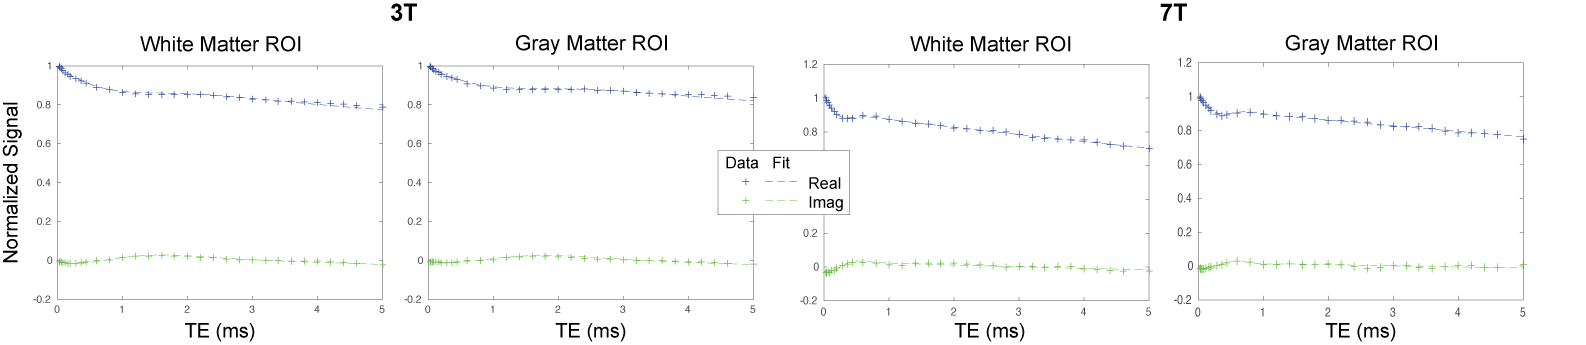
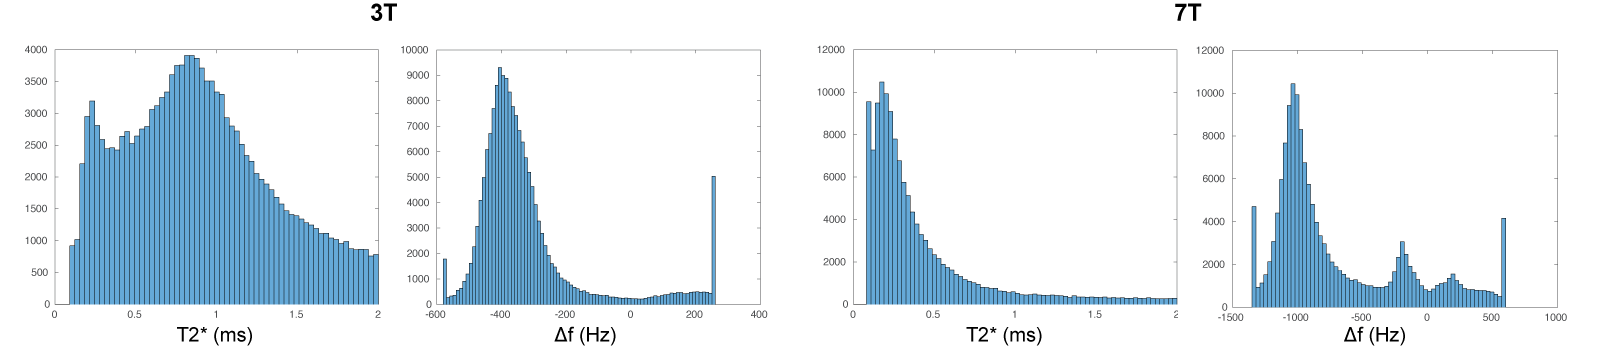
Ultrashort T2 relaxometry in vivo was best fit with a 2-compartment model (Fig. 3) as measured by the AIC. These consisted of (1) an ultrashort-T2* component (T2* ~0.6-1.0 ms at 3T, ~0.2-0.4 ms at 7T) with a frequency shift (~-400 Hz at 3T, ~-1000 Hz at 7T) (Fig. 4), and (2) a long T2* component (T2* > 10 ms) that was on-resonance. The ultrashort-T2* values are slightly longer than previous in vivo measurements3, which can be accounted for by the inclusion of a frequency shift in our model. The frequency shift corresponds to -3.1 to -3.3 ppm and is evident in the complex signal fits, providing strong evidence that this signal arises from methylene protons in myelin phospholipid membranes 1, 2. The long T2* component is a combination of myelin water and free water, and were not separated due to the ultrashort TE regime sampled.
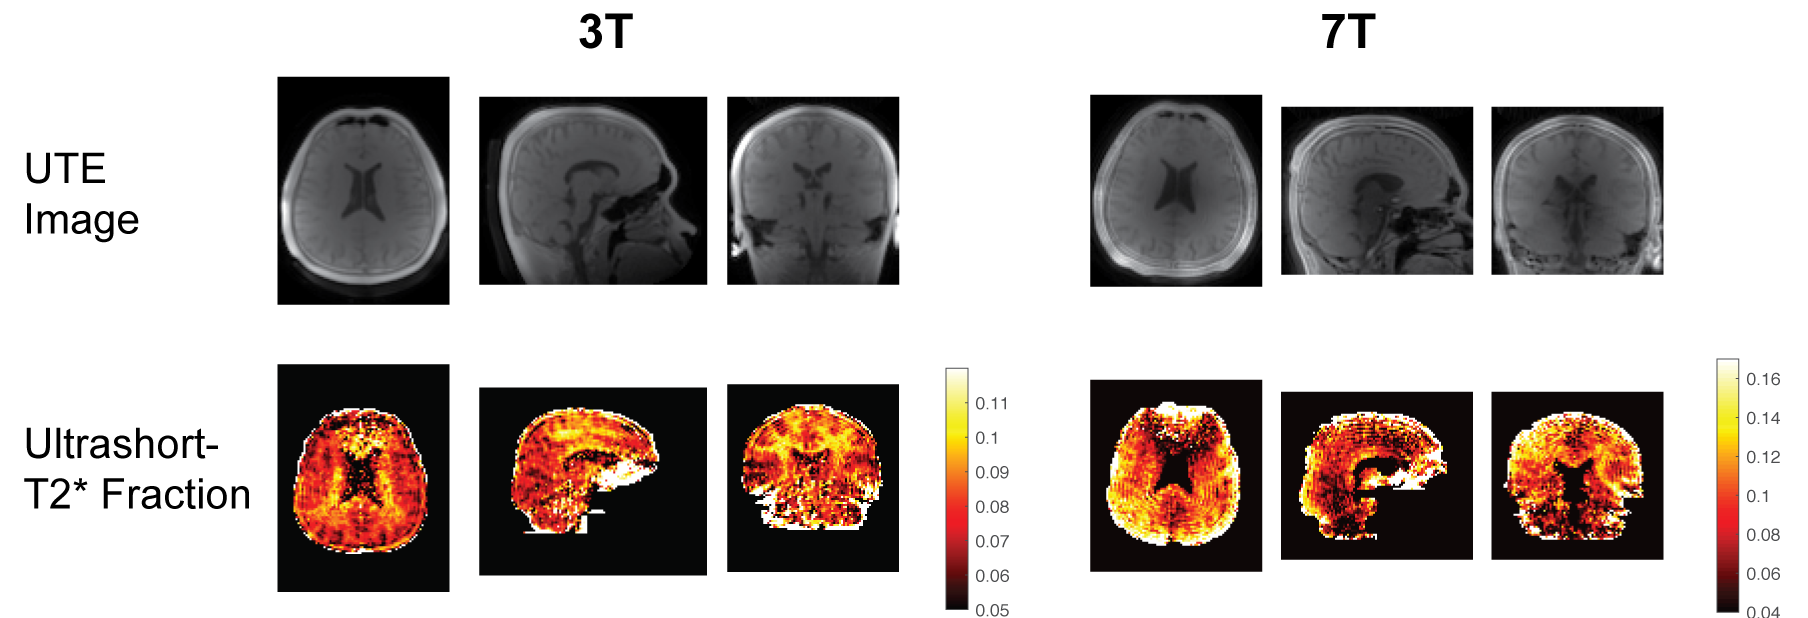
Maps of the relative ultrashort-T2 component fraction reveal that it is highly associated with white matter distribution across the brain. Maps of the ultrashort component are blurred out when fitting based on the on-resonance reconstruction (not shown) due to the off-resonance blurring, whereas fitting with an off-resonance reconstructed image reduces this blurring with image quality as shown.
Conclusion
This work presents whole-brain characterization of an ultrashort-T2* component (T2* ~0.6-1.0 ms at 3T, ~0.2-0.4 ms at 7T) that includes an approximately -3.2 ppm frequency shift which has not been measured before in vivo. The scaling of this shift between 3T and 7T indicates this is a result of chemical shift, most likely from methylene protons in the myelin phospholipid membranes. These measurements were enabled by a randomized TE ordering, on-resonance and off-resonance image reconstructions, and parallel imaging. These characterizations will be crucial to design future measurements for direct myelin imaging.Acknowledgements
We’d like to thank Kevin Johnson and Jiang Du for insightful discussions and funding from the National MS Society and NIH R21NS089004.References
1. Horch, R. A., Gore, J. C., & Does, M. D. (2011) Origins of the ultrashort-T(2) (1) H NMR signals in myelinated nerve: A direct measure of myelin content?. Magn Reson Med 66, 24-31.
2. Wilhelm, M. J., Ong, H. H., Wehrli, S. L., Li, C., Tsai, P.-H., Hackney, D. B., & Wehrli, F. W. (2012) Direct magnetic resonance detection of myelin and prospects for quantitative imaging of myelin density. Proc Natl Acad Sci U S A 109, 9605-10.
3. Du, J., Ma, G., Li, S., Carl, M., Szeverenyi, N. M., VandenBerg, S., Corey-Bloom, J., & Bydder, G. M. (2014) Ultrashort echo time (UTE) magnetic resonance imaging of the short T2 components in white matter of the brain using a clinical 3T scanner. Neuroimage 87, 32-41.
4. Sheth, V., Shao, H., Chen, J., Vandenberg, S., Corey-Bloom, J., Bydder, G. M., & Du, J. (2016) Magnetic resonance imaging of myelin using ultrashort Echo time (UTE) pulse sequences: Phantom, specimen, volunteer and multiple sclerosis patient studies. Neuroimage 136, 37-44.
5. Uecker, M., Lai, P., Murphy, M. J., Virtue, P., Elad, M., Pauly, J. M., Vasanawala, S. S., & Lustig, M. (2014) ESPIRiT-an eigenvalue approach to autocalibrating parallel MRI: Where SENSE meets GRAPPA. Magn Reson Med, 71(3), 990-1001.
Figures