1097
Characterization of White Matter Tortuosity using High-Resolution gSlider-SMS Diffusion Imaging1Harvard Medical School - Massachusetts General Hospital, Boston, MA, United States, 2University of São Paulo, São Paulo, Brazil, 3Rutgers Robert Wood Johnson Medical School, New Brunswick, NJ, United States, 4Brigham and Women's Hospital, Harvard Medical, Boston, MA, United States
Synopsis
Conventional tractography excludes acute directional changes. We define these acute changes as tortuosity and use it to characterize gray-white matter boundaries, as well as quantify deformation and remodeling in pathologic states. Five healthy volunteers and a brain tumor patient were scanned using the gSlider-SMS technique. Diffusion data was processed to create 3D contiguous ribbons that characterize tortuosity. Twisting angles of the 3D ribbons were compared within and between subjects, and were visually and statistically consistent. This highly informative tractographic method could be applied to evaluate tumor infiltration and adjacent brain compression, or traumatic brain injury.
Introduction
Conventional white matter (WM) tractography using diffusion imaging assumes the orientation of the principal eigenvector to be parallel to the local WM fascicles. While streamline tracking is useful for depicting the directional patterns and for identifying major WM tracts in the brain, it excludes any acute directional changes and thus does not account for the twisting and kinking in their paths.1,2 We define these twists and bends that are unobservable using streamline tractography as the tortuosity. Characterizing this property may improve our understanding of WM organization and enable quantification of WM deformation and remodeling in pathologic states. Here, using the diffusion tensor, we describe a tractographic approach that uses all eigenvectors to quantify tortuosity.Methods
Five healthy volunteers and a patient with a left frontal oligodendroglioma were imaged using a 3T scanner (Siemens Skyra) fitted with a 300mT/m gradient array3 and a purpose-built 64-channel head RF coil.4 Our institutional review board approved all scans. In all healthy subjects, sagittal diffusion-weighted EPI images were acquired using the gSlider-SMS technique5 with 10 simultaneous sagittal slice acquisition (gSlider x MB factor=5x2) using ZOOPPA6 to suppress signal in the neck and phase-encoding in the head-foot direction. Key parameters were: 750μm isotropic resolution; FOV=134x220mm2; slice thickness 3.8mm; partial Fourier 6/8; TE/TReff=80ms/22s; 2 repetitions of 128 directions at b=1500s/mm2 with interspersed b=0s/mm2 images every 10 volumes; total scan time ~120 min. For the tumor patient, 2mm isotropic diffusion-weighted EPI images, FOV=216x216mm2, 64 slices were acquired using a b-value of 1500s/mm2 with 128 directions. Images were corrected for eddy currents and head motion.7
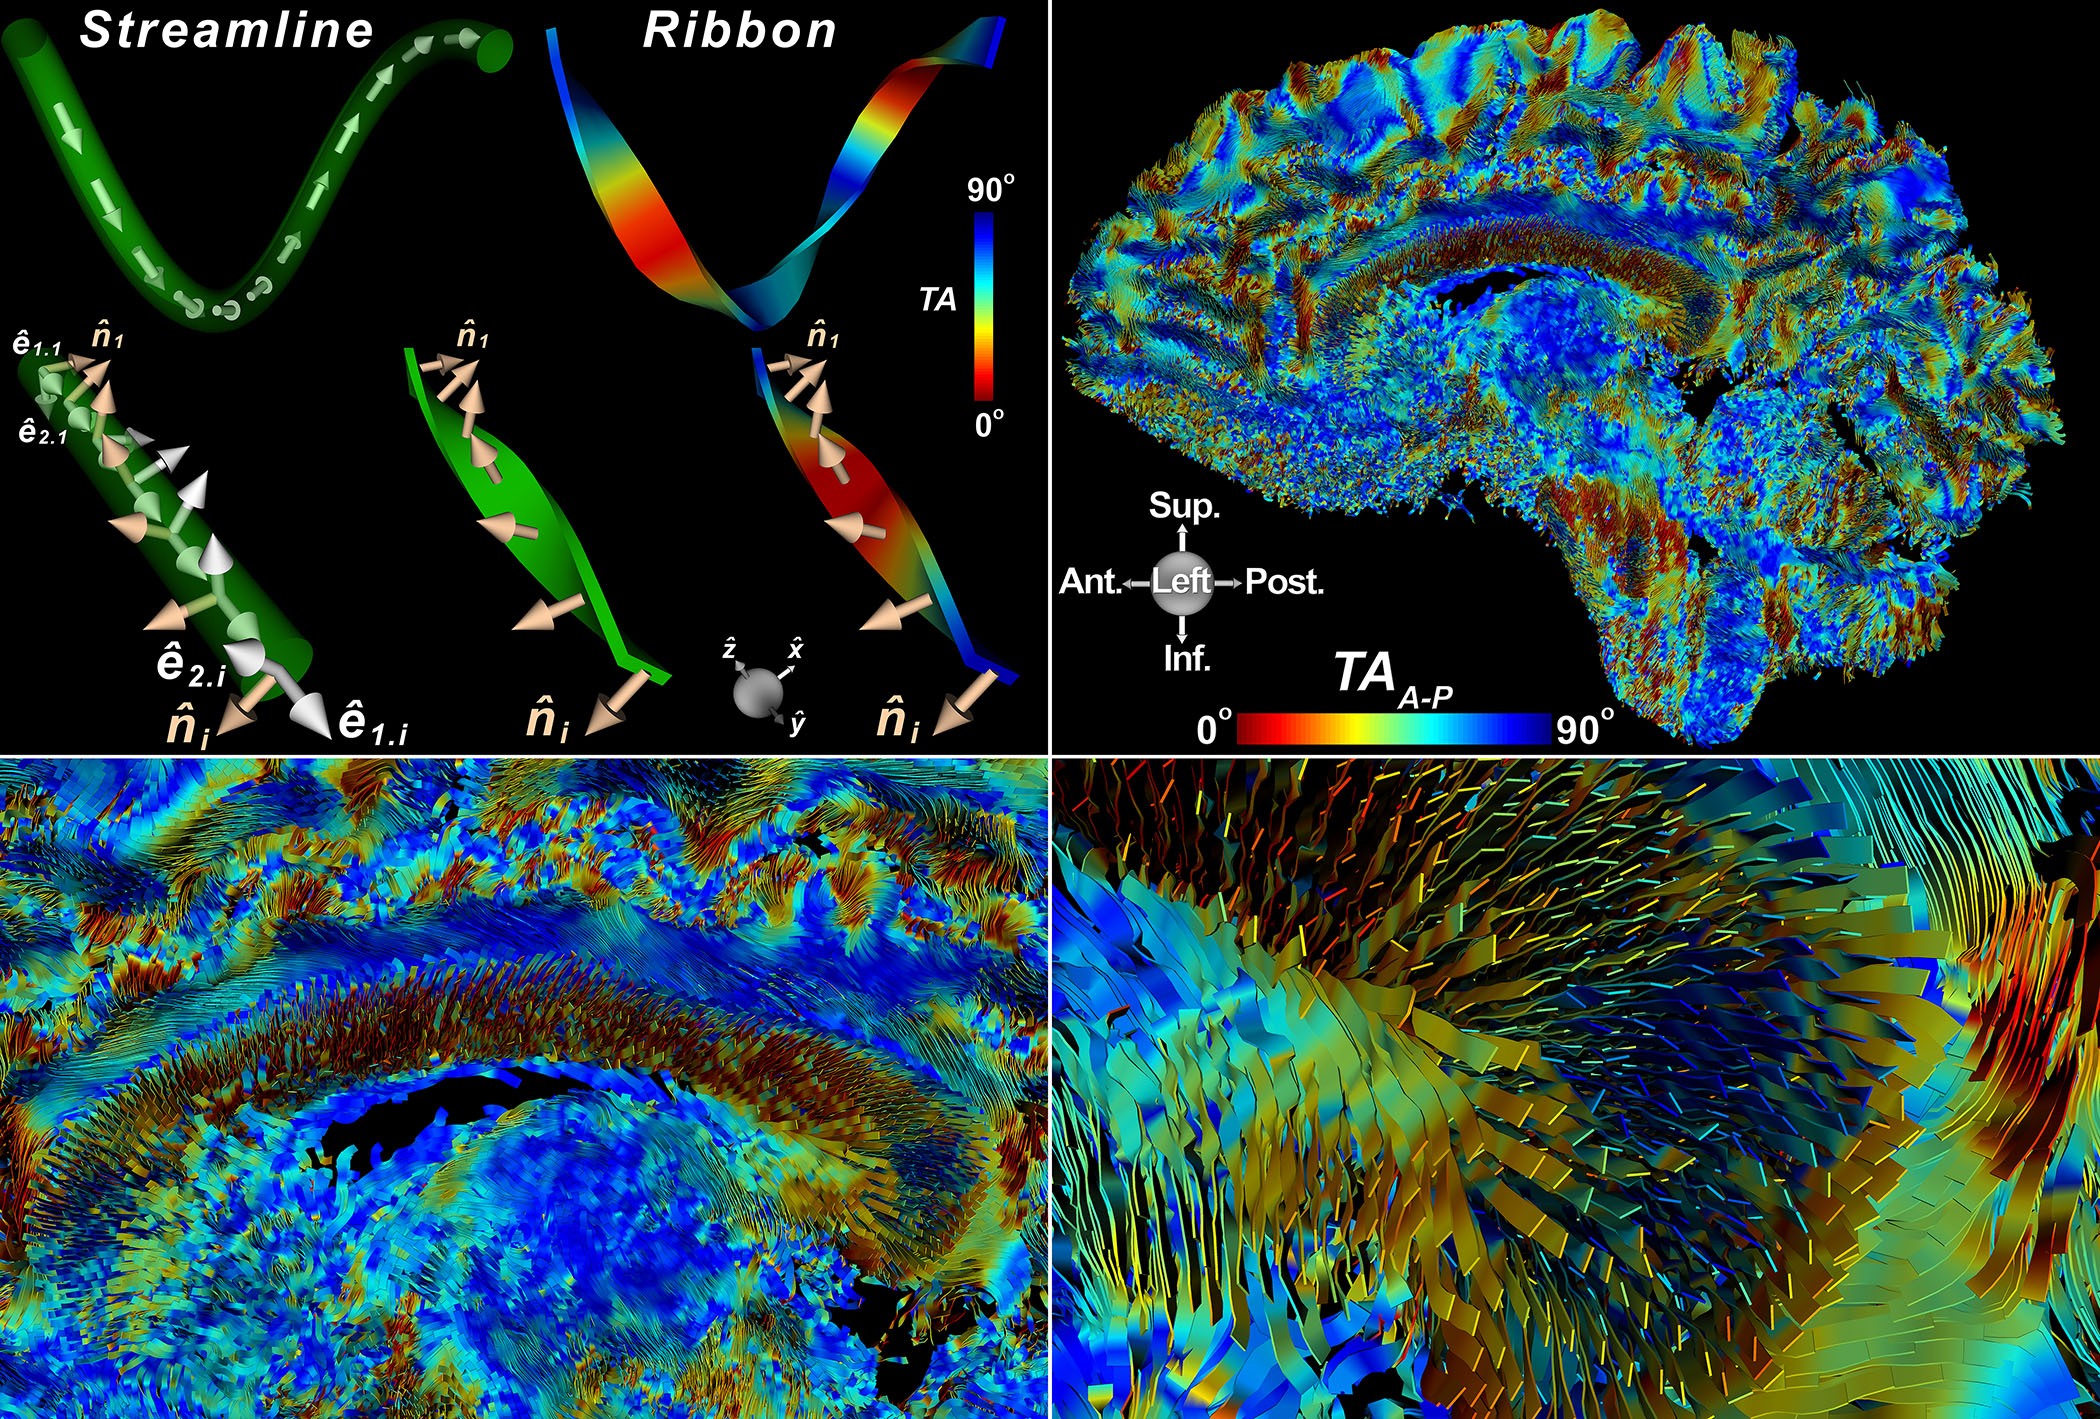
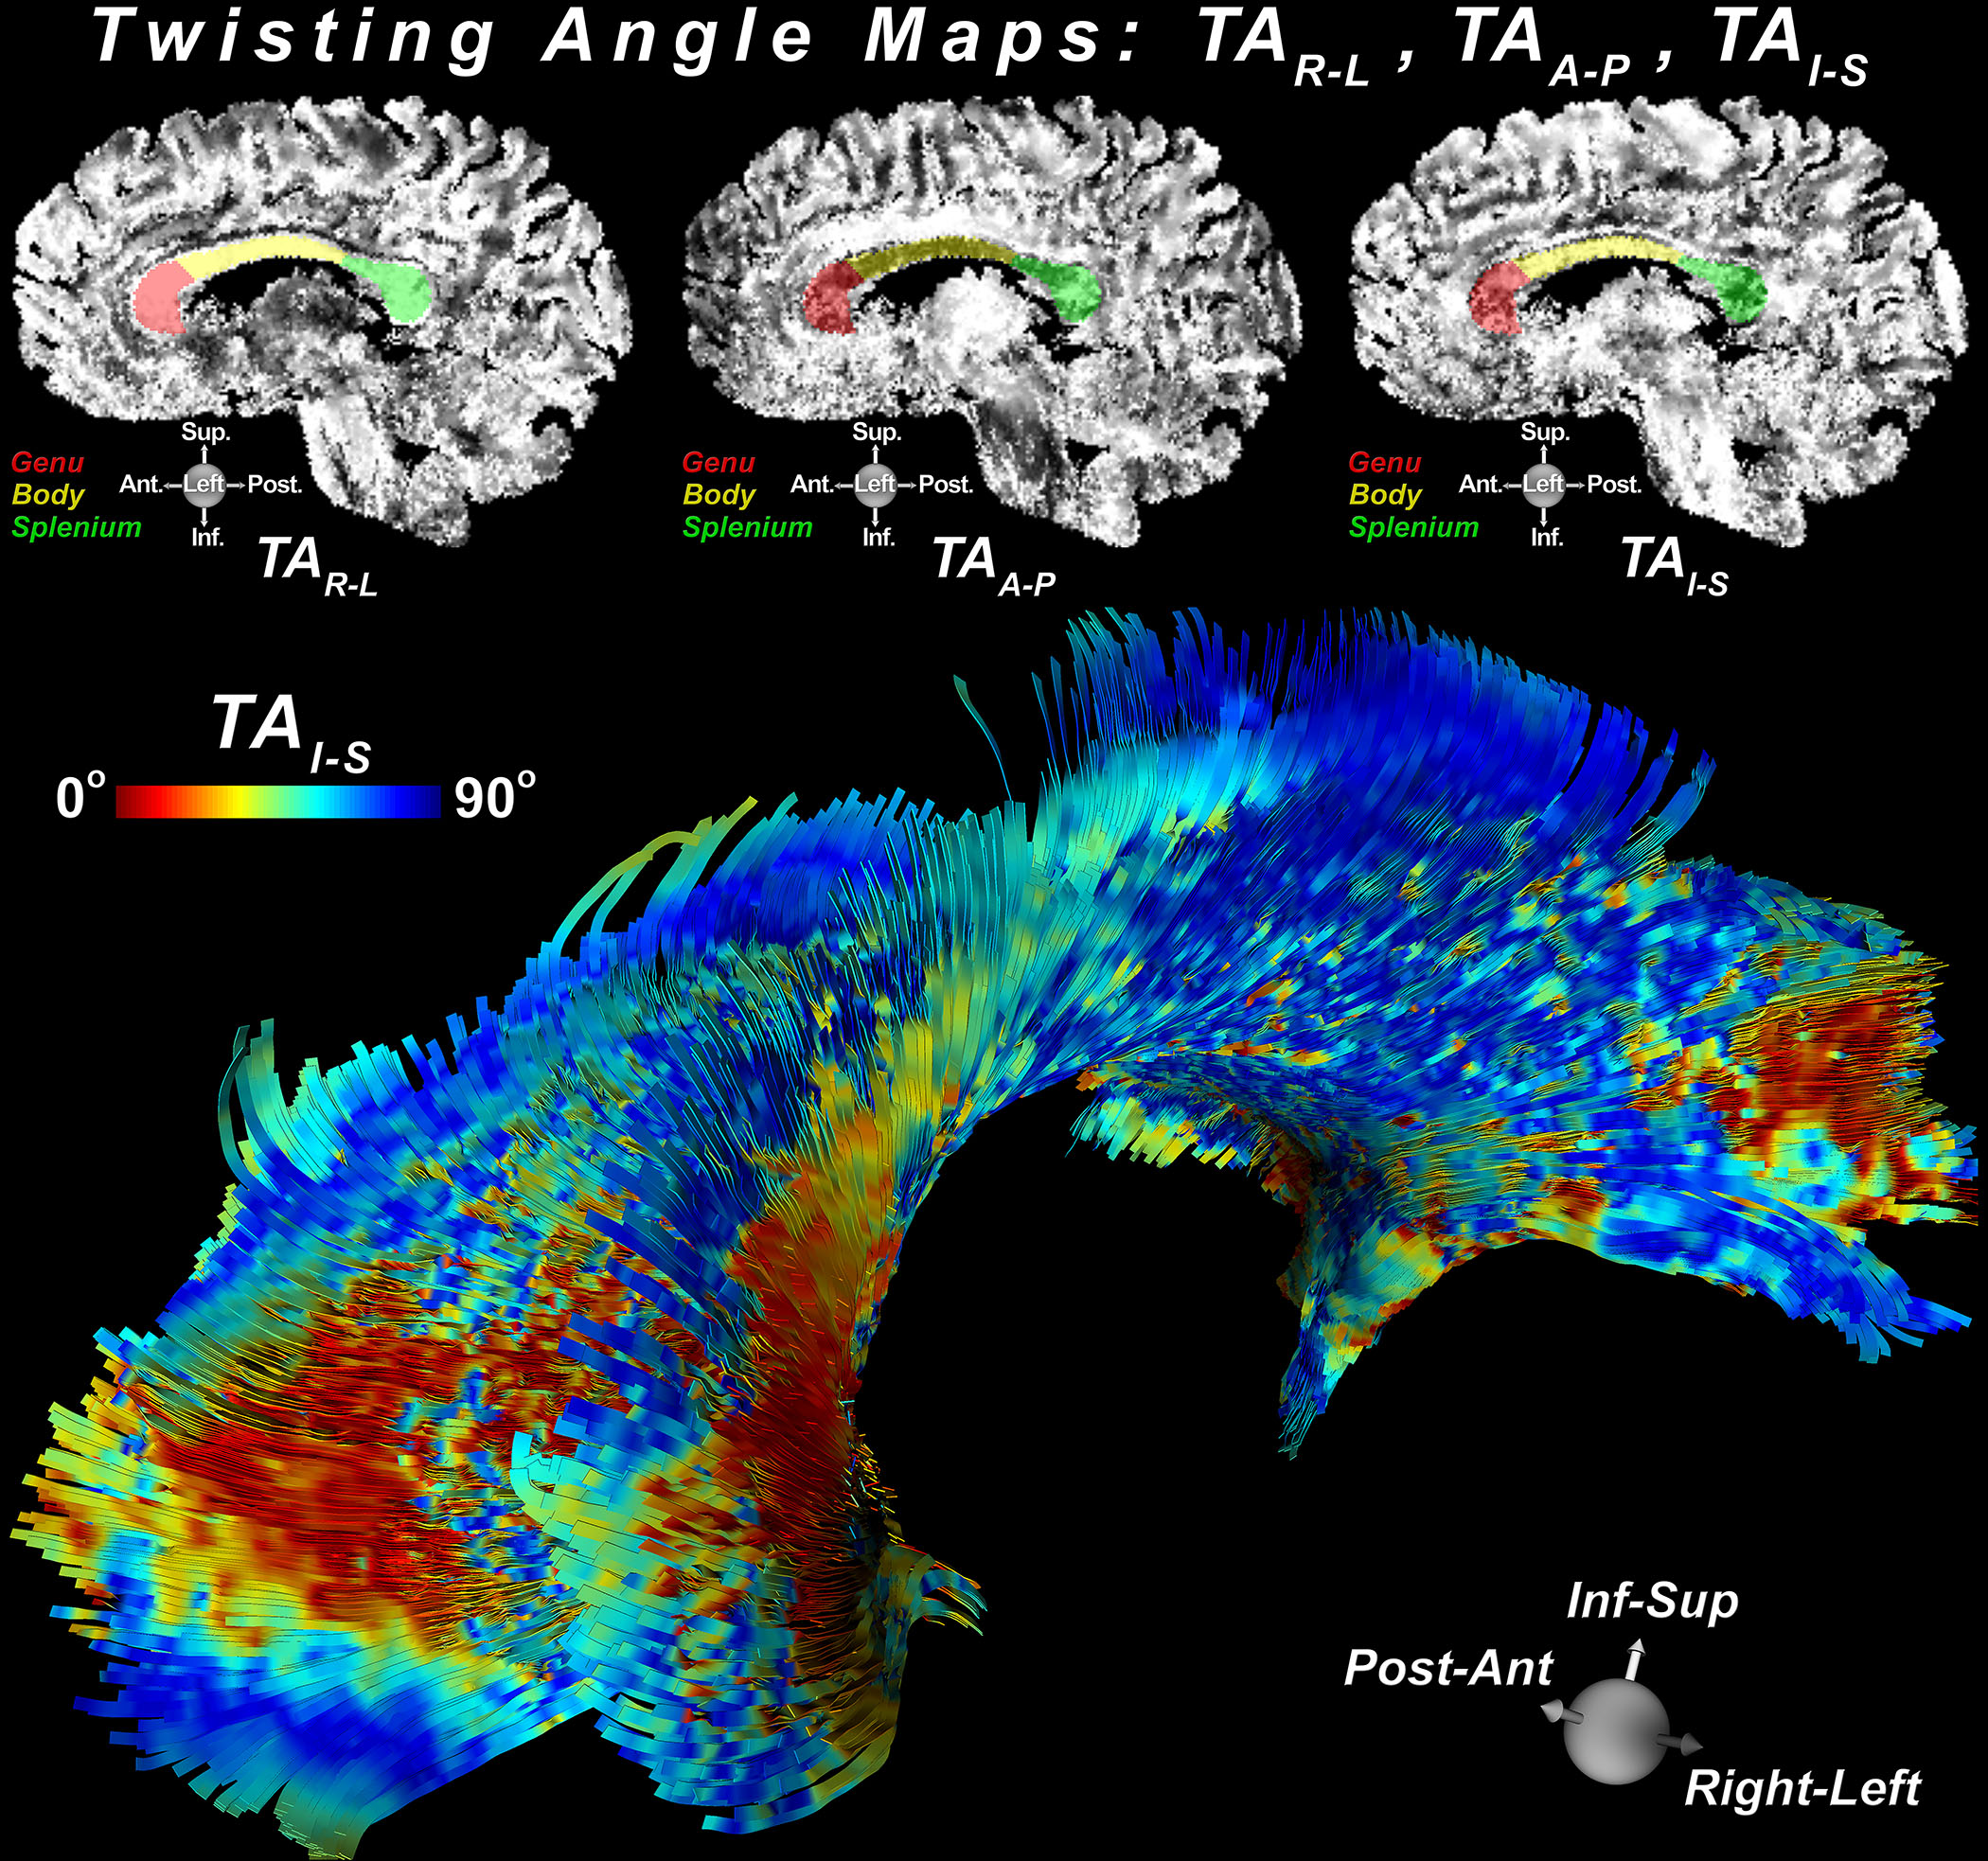
Ribbons were created by numerically integrating the primary eigenvector field using an adaptive 5th order Runge-Kutta approach, with a width extending along the second eigenvector and a thickness aligned with the third (Figure 1). Given a global reference frame $$$V=[\vec{x},\vec{y},\vec{z}]$$$, the amount of ribbon twisting with respect to $$$V$$$ was determined by the twisting angles $$$[TA_{R-L},TA_{A-P},TA_{I-S}] = [cos^{-1}\lvert\vec{x}\cdot \vec{n}\lvert,cos^{-1}\lvert\vec{y}\cdot\vec{n}\lvert, cos^{-1}\lvert\vec{z}\cdot\vec{n}\lvert]$$$ where $$$\vec{n}$$$ is the unit normal vector at each ribbon point. The global reference frame $$$V$$$ was defined such that $$$\vec{x}$$$, $$$\vec{y}$$$, and $$$\vec{z}$$$ were aligned with the standard Right-Left, Anterior-Posterior, and Inferior-Superior head orientation reference. Characterization of WM tortuosity was performed by quantification of twisting angles (TA) at the genus, body, and splenium regions of the corpus callosum (CC) for the healthy individuals, and also shown using tumor patient data.
Results
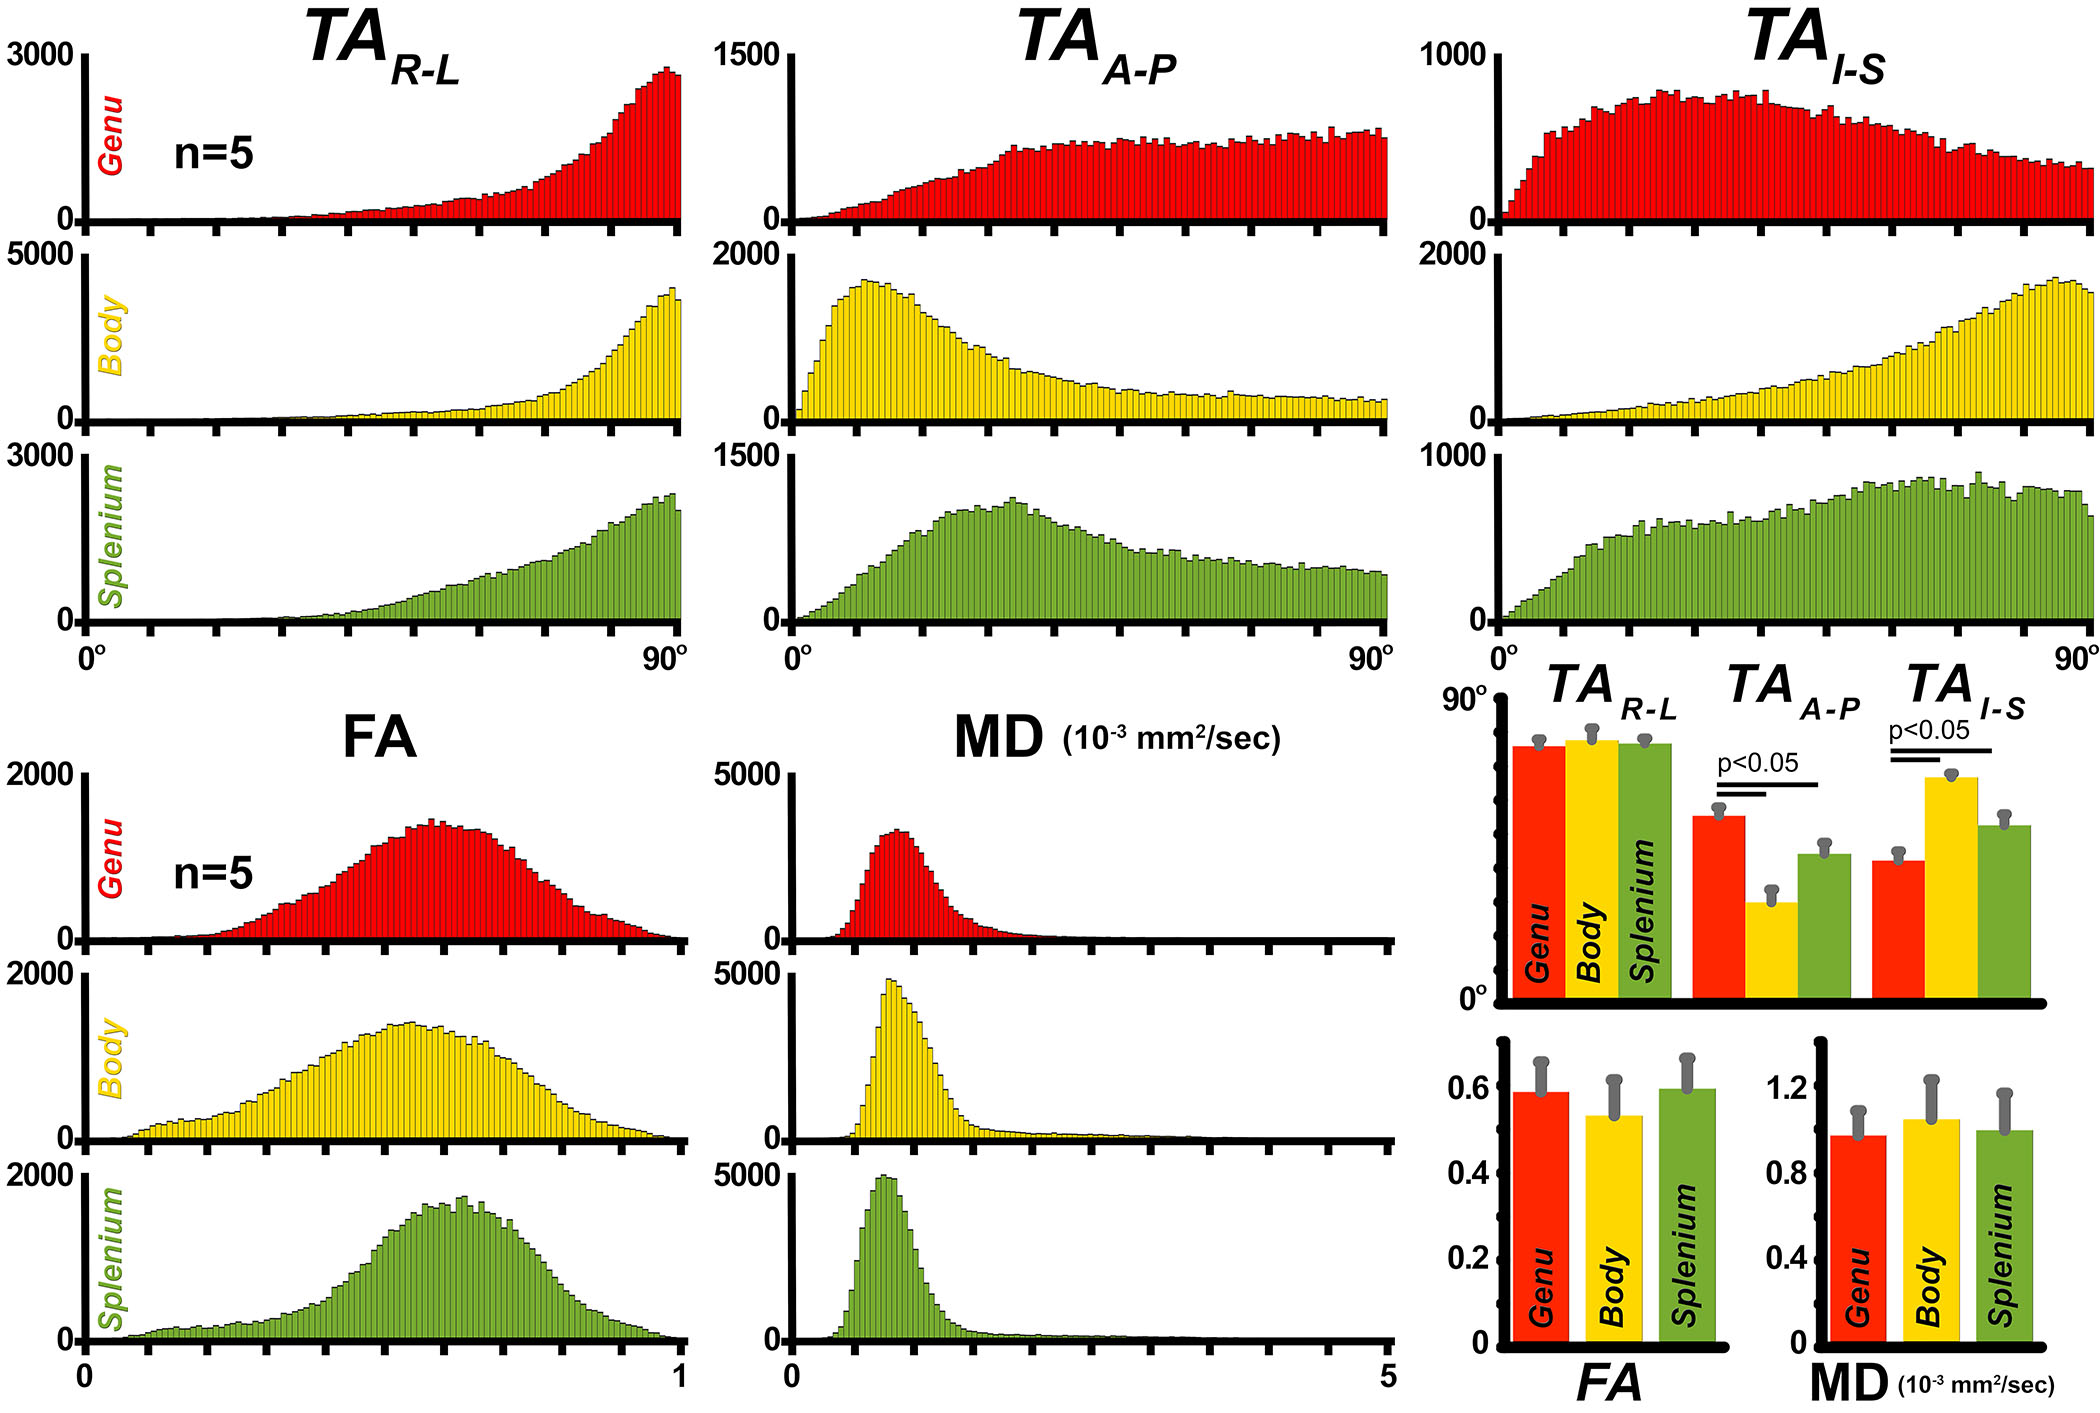
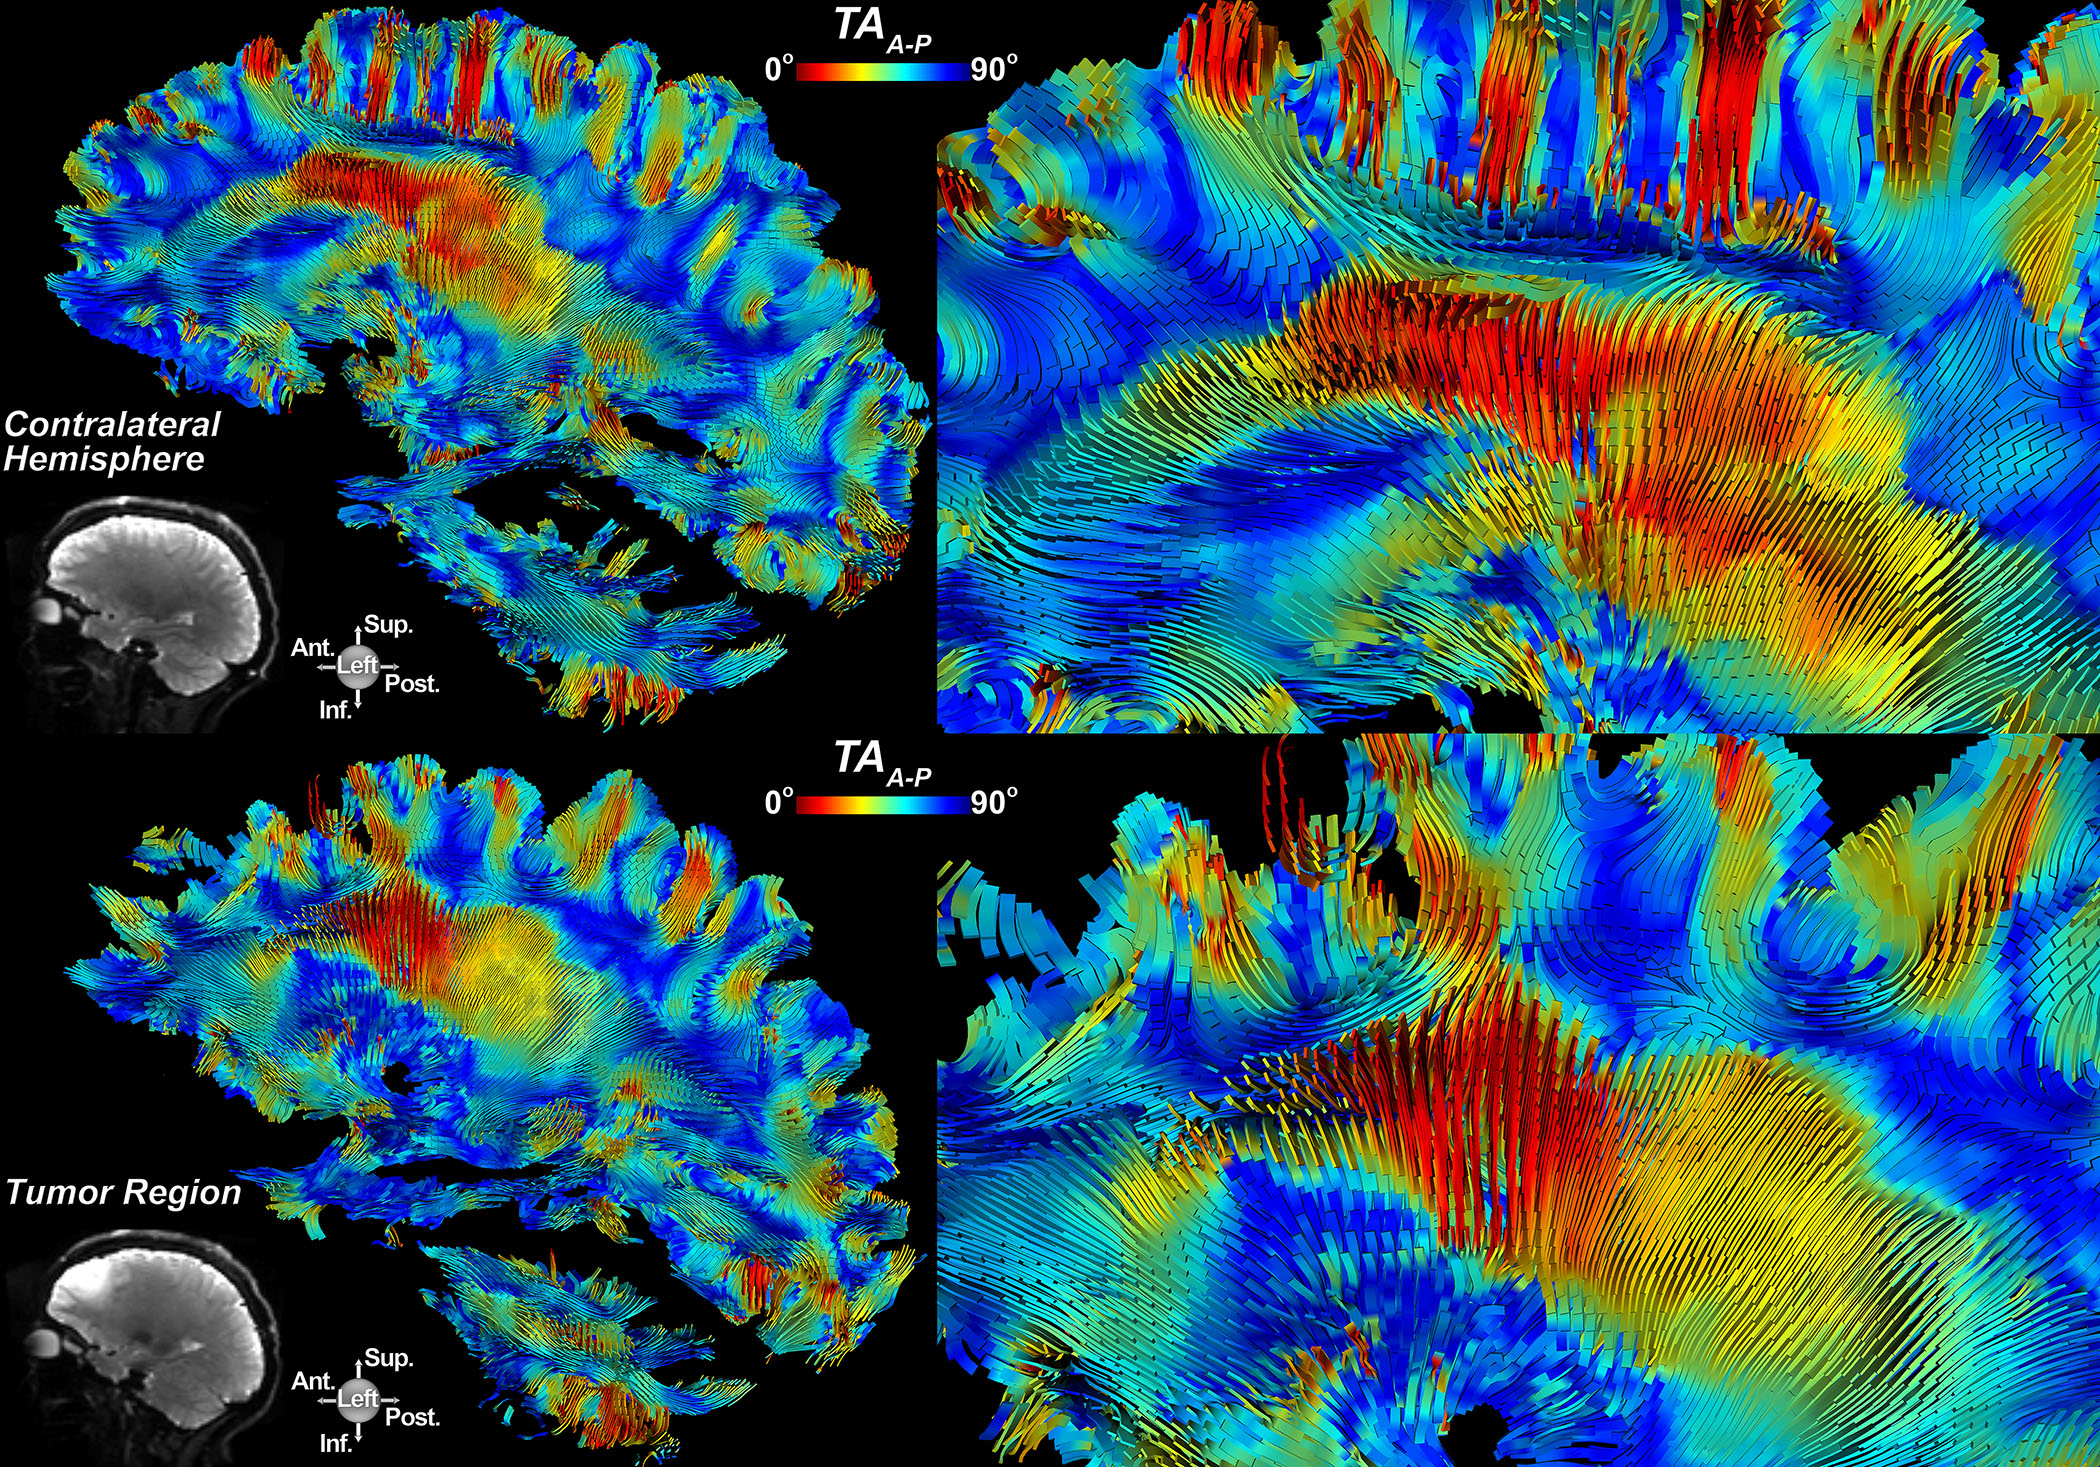
Figure 1 shows results from ribbon tracking in the CC and highlights differences in TA. Figure 2 presents a mid-sagittal cross-section of the genu, body, and splenium regions of the CC used for quantification, overlaid on TA maps. A 3D perspective of ribbon tractography illustrates the differences in the twisting angle along the width of the CC. While no substantial differences were seen in FA or MD between segments of the CC, TA did capture changes in tortuosity. Histograms of $$$TA_{R-L}$$$ were similar between segments, but $$$TA_{A-P}$$$ and $$$TA_{I-S}$$$ showed that fibers twist more at genus and splenium, when compared to the body (Figure 3). Figure 4 shows changes in $$$TA_{A-P}$$$ in the left frontal WM caused by the presence of a tumor in the left frontal lobe.Discussion and Conclusion
Ribbon tracking paths were visually consistent and statistical evaluation of WM tortuosity was found to be similar across normal subjects (Figure 3). Conventional tracking does not consider the rotational component clearly present in our ribbon depiction representing the spatial progression of the eigensystem. The origin of this twisting remains to be investigated and we speculate that it could derive from changes in connectivity perpendicular to the pathway or changes in local axonal density. Our approach captured the tortuosity at the gray-white matter boundary as well as at the genu and splenium of the CC as compared to the adjacent body. We observe that the abrupt changes at these interfaces correspond to areas most affected by axonal shear injury, suggesting that the sharp turning of WM at these locales explains the vulnerability to such injury. In the tumor patient, the abrupt changes in TA seen at the margins of the lesion may help to characterize the degree of mass effect and extent of infiltrative tumor growth (Figure 4). Our approach detects and depicts the tortuosity of fibers as they turn and fold within the WM using high-quality sub-mm voxel resolution diffusion data. This is a highly informative tractographic method that renders white and gray matter structure as a 3D continuum. Potential applications include assessment of tumor infiltration and adjacent brain compression or evaluating traumatic brain injury.Acknowledgements
No acknowledgement found.References
1. Jones DK, Knosche TR, Turner R. White matter integrity, fiber count, and other fallacies: the do's and don'ts of diffusion MRI. Neuroimage 2013;73:239-54.
2. Close TG, Tournier JD, Johnston LA, et al. Fourier Tract Sampling (FouTS): A framework for improved inference of white matter tracts from diffusion MRI by explicitly modelling tract volume. Neuroimage 2015;120:412-27.
3. McNab JA, Edlow BL, Witzel T, et al. The Human Connectome Project and beyond: initial applications of 300 mT/m gradients. Neuroimage 2013;80:234-45.
4. Keil B, Blau JN, Biber S, et al. A 64-channel 3T array coil for accelerated brain MRI. Magn Reson Med. 2013;70:248-58.
5. Setsompop K, Bilgic B, Nummenmaa A, et al. SLIce Dithered Enhanced Resolution Simultaneous MultiSlice (SLIDER-SMS) for high resolution (700 um) diffusion imaging of the human brain. Proc ISMRM 2015, p. 339.
6. Heidemann RM, Anwander A, Feiweier T, et al. k-space and q-space: combining ultra-high spatial and angular resolution in diffusion imaging using ZOOPPA at 7 T. NeuroImage 2012;60:967–78.
7. Jenkinson M, Beckmann CF, Behrens TE, et al. FSL. NeuroImage 2012;62:782-90.
Figures