1095
Visualizing Axonal Damage in Multiple Sclerosis Using Double Diffusion Encoding MRI in a Clinical Setting1Electrical Engineering, Stanford University, Stanford, CA, United States, 2Radiology, Stanford University, Stanford, CA, United States
Synopsis
Double diffusion encoding (DDE) measurements of microscopic anisotropy show promise as a method of assessing neurodegeneration. Unfortunately, DDE has yet to be demonstrated in a clinical setting due to constraints in SNR and scan time. Here, we used an optimized gradient orientation scheme to show the first DDE measurements of microscopic anisotropy in multiple sclerosis (MS) patients. Five MS patients were scanned using a DDE sequence optimized to run in five minutes. The microscopic anisotropy maps show improved visualization of axonal damage compared to fractional anisotropy (FA) and may provide additional insight into changes in tissue microstructure.
Introduction
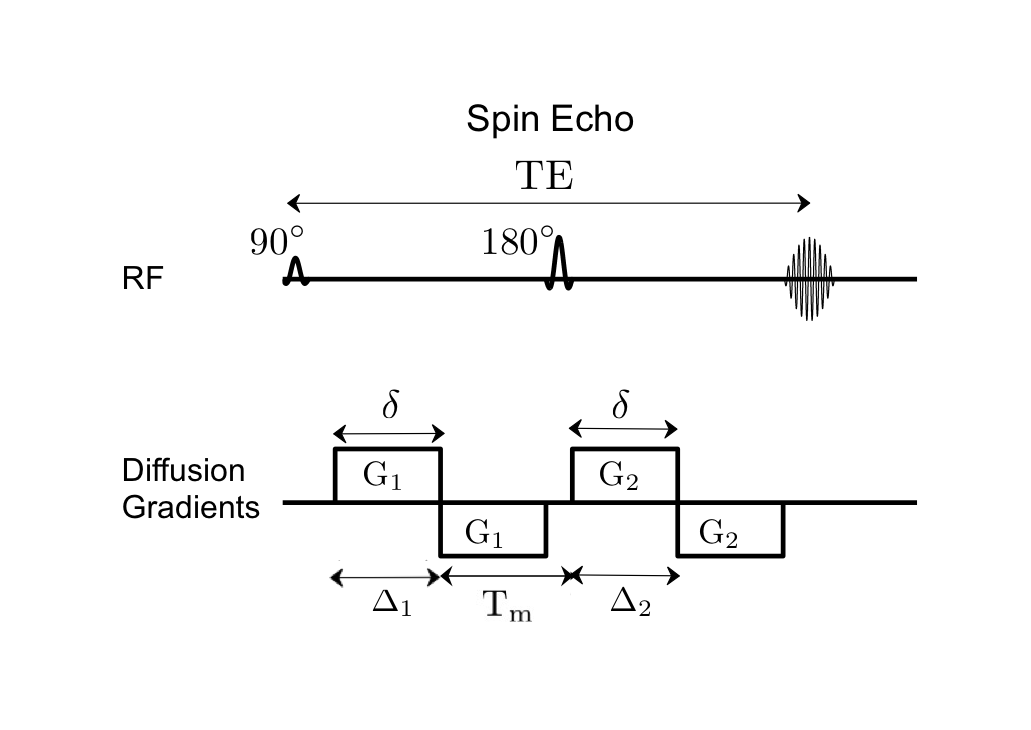
Double diffusion encoding (DDE) MRI1 (Fig. 1) distinguishes between changes in microscopic anisotropy and changes in orientation dispersion; both of which affect the net diffusion anisotropy measured by diffusion tensor imaging. Microscopic anisotropy reflects the shape of restrictive compartments within a voxel and has the potential to be a more specific marker of fiber integrity for studying neurodegenerative diseases. DDE measurements of microscopic anisotropy2-6 have yet to be demonstrated on patients in a clinical setting due to constraints in SNR and scan time. Using an optimized gradient orientation scheme7, we show the first DDE measurements of microscopic anisotropy in multiple sclerosis patients. The microscopic anisotropy maps show improved delineation of MS lesions compared to conventional fractional anisotropy (FA) and may provide additional insight into changes in tissue microstructure.Methods
Five MS patients and one healthy volunteer were scanned with IRB approval on a 3T whole-body MR system (MR750, GE Healthcare, Madison, Wisconsin; 50 mT/m, 200 mT/m/s gradients) equipped with a 32-channel phased array head coil (GE Medical coil for patients/Nova Medical coil for healthy volunteer). The protocol included DTI (TE/TR=61/8000 ms, 2×2×2mm3 resolution, 18 diffusion directions), T2 FLAIR (TI/TE/TR = 1717, 129, 6000 ms, 0.94×0.94×1.2mm3 resolution) and DDE (TE/TR=130/6000 ms, 3×3×3mm3 resolution, 17 axial slices, ASSET R=2, and mixing time = 32 ms). The DDE sequence is shown in Figure 1. A DDE gradient orientation scheme7 with 24 parallel and 24 orthogonal gradient pairs was employed for a scan time of 5 min. For each diffusion encoding pair: b=740 s/mm2, δ=17 ms, Δ=19 ms, G=50 mT/m, gradient rise time 1 ms. DTI and DDE images were corrected for eddy current distortion and bulk motion using “eddy” from the FMRIB Software Library. The DDE images were used to compute fractional eccentricity (FE)6, a rotationally invariant metric of microscopic anisotropy.Results and Discussion
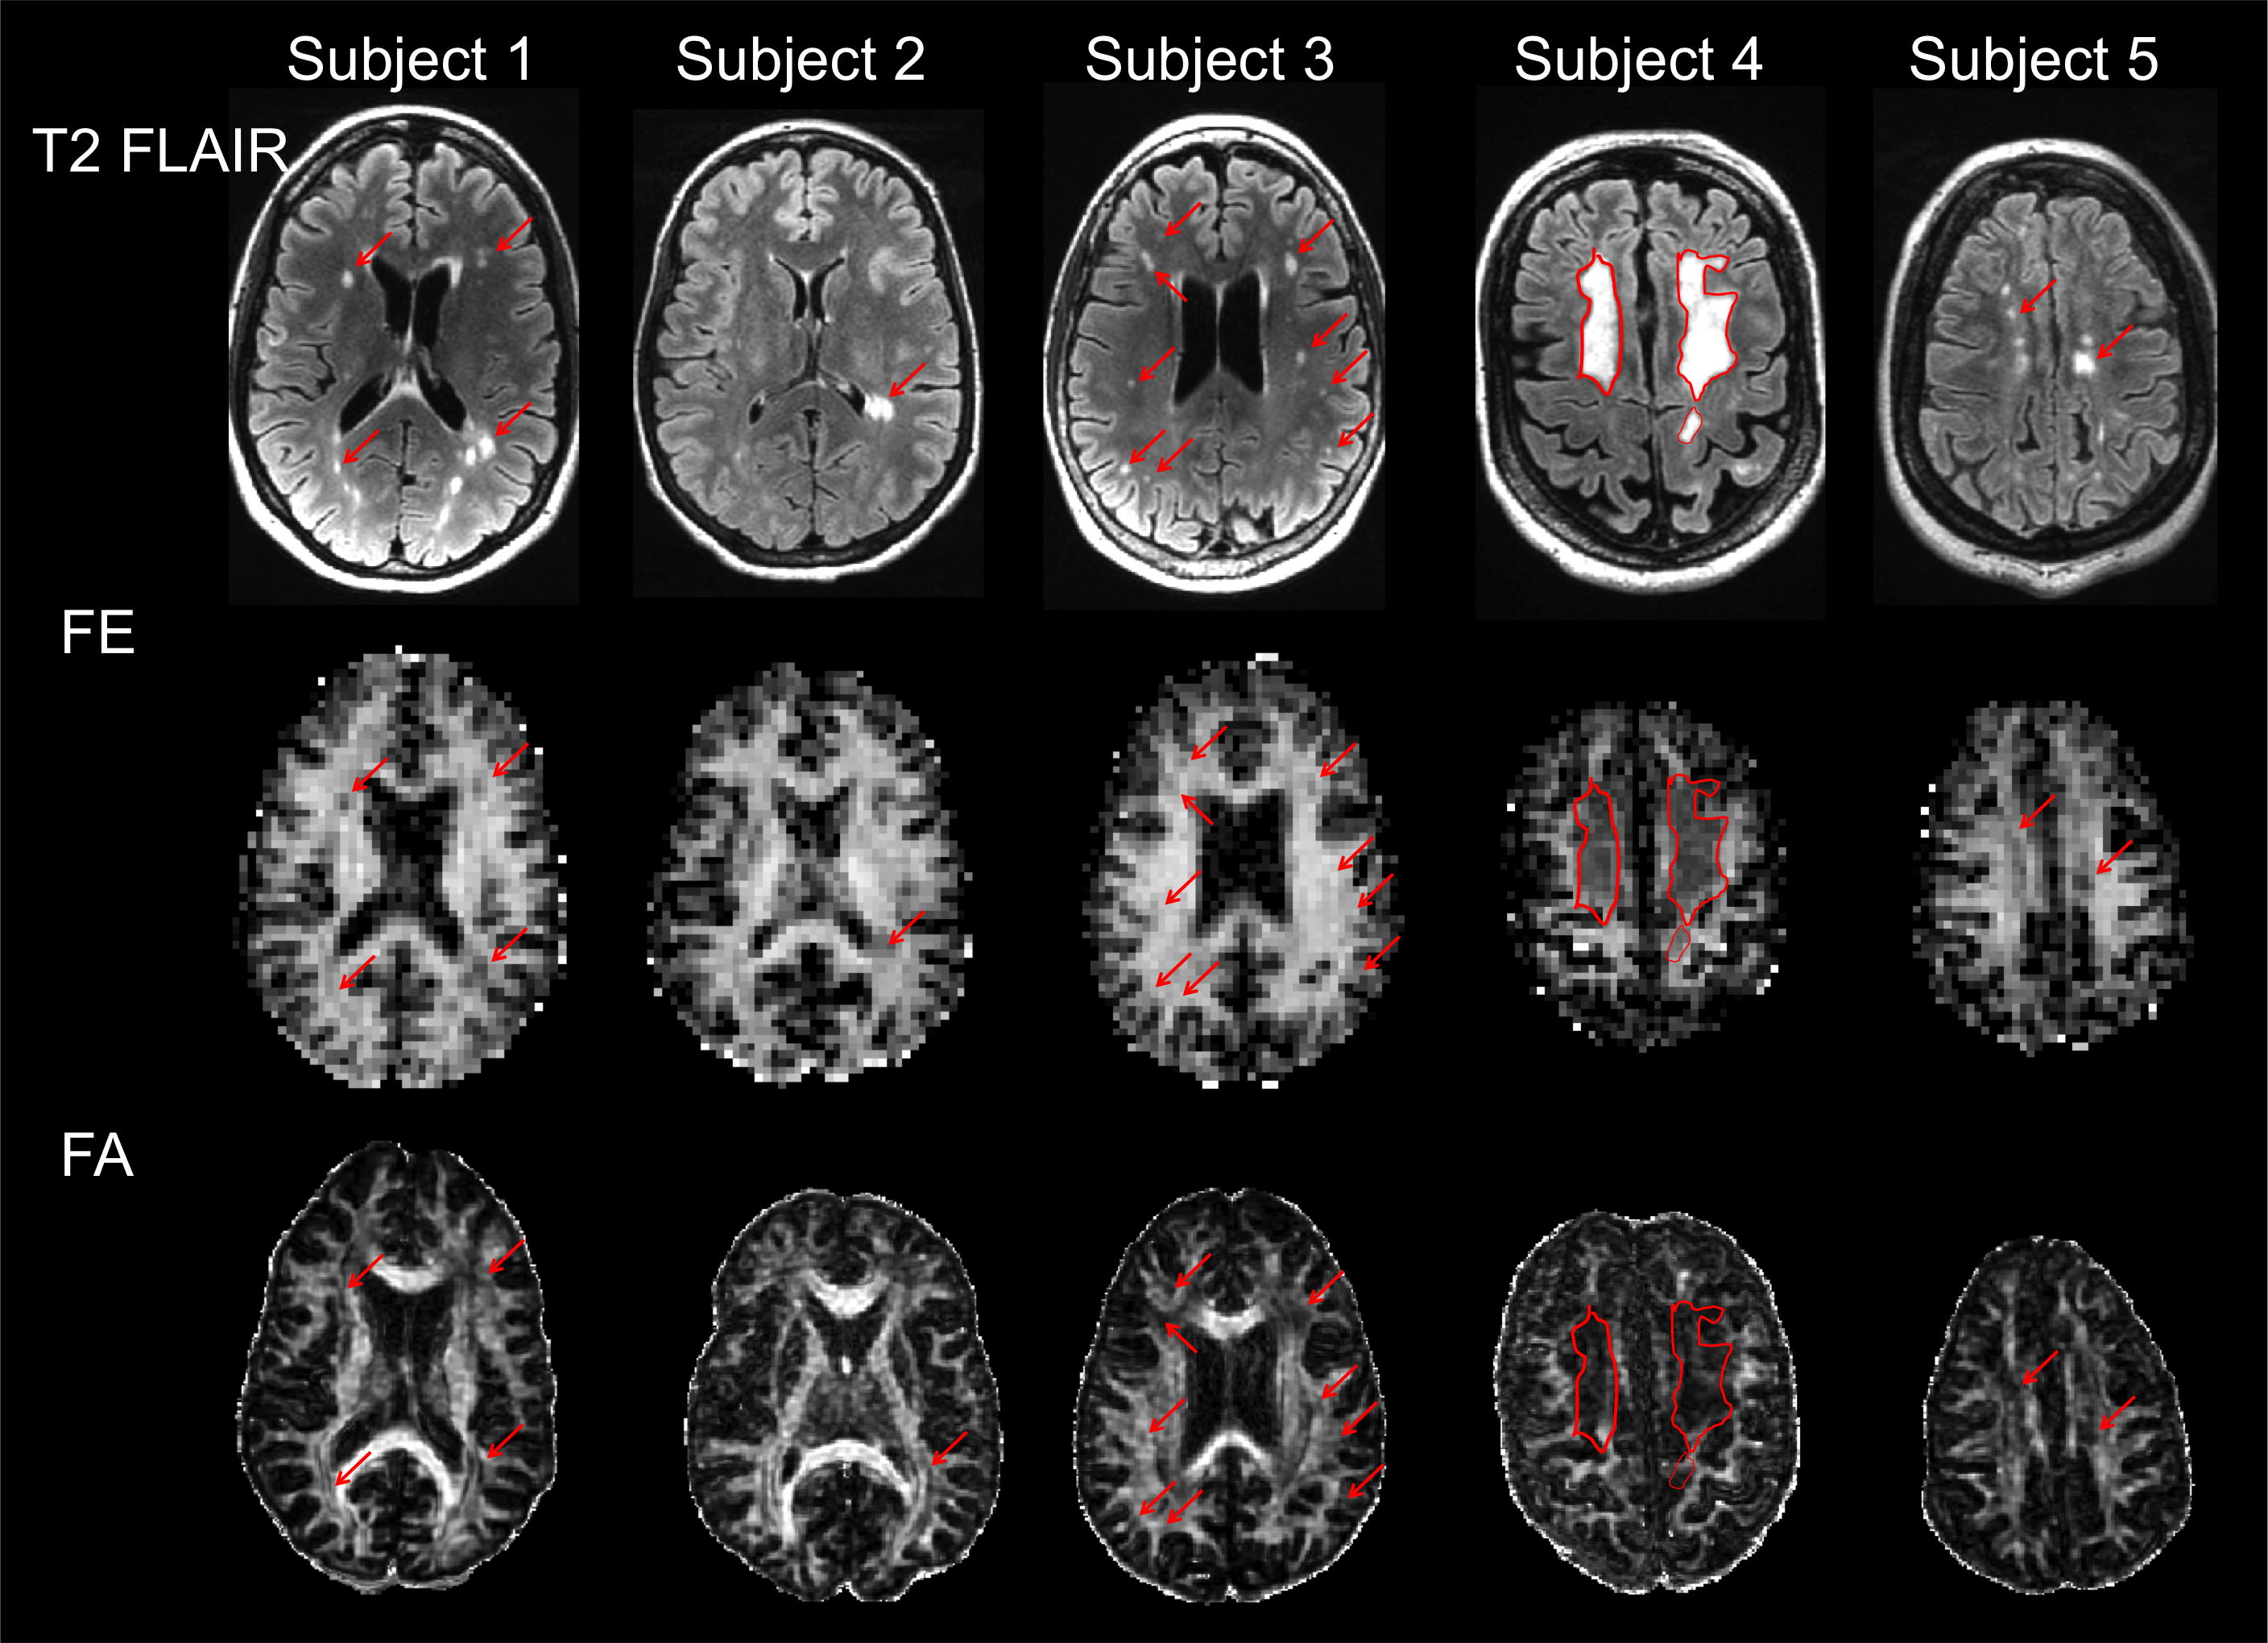
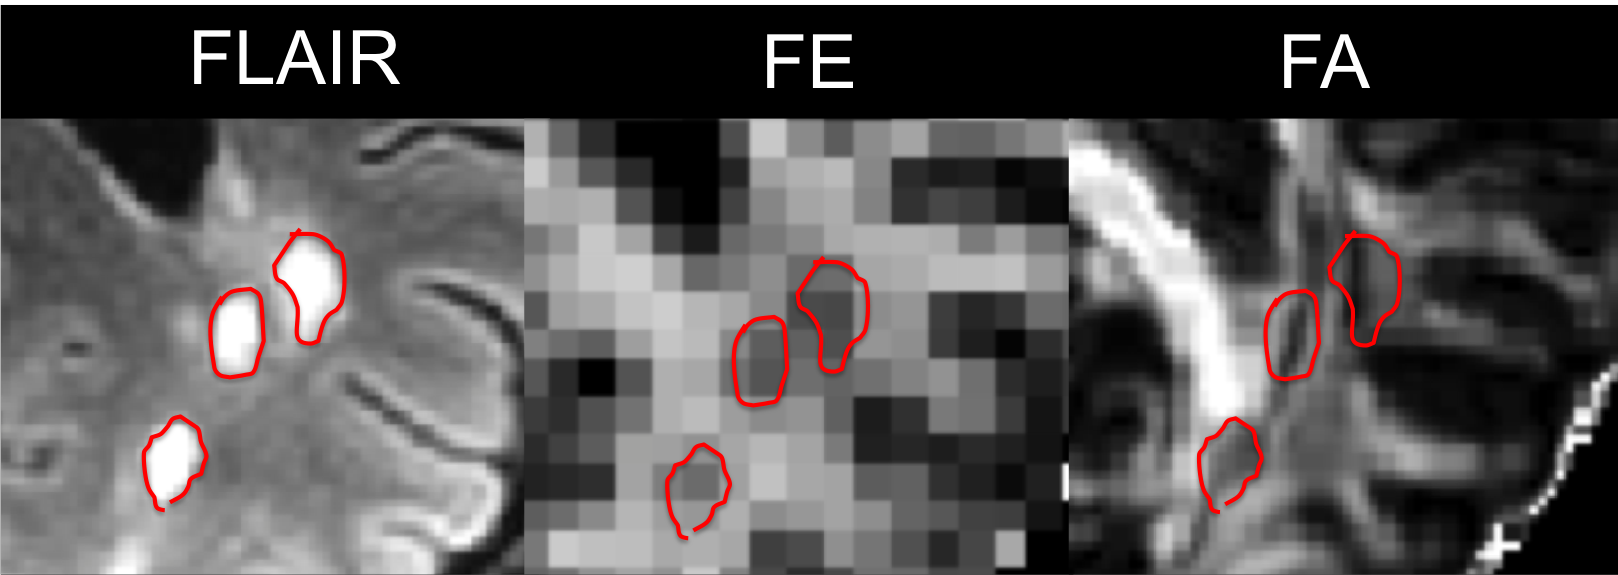
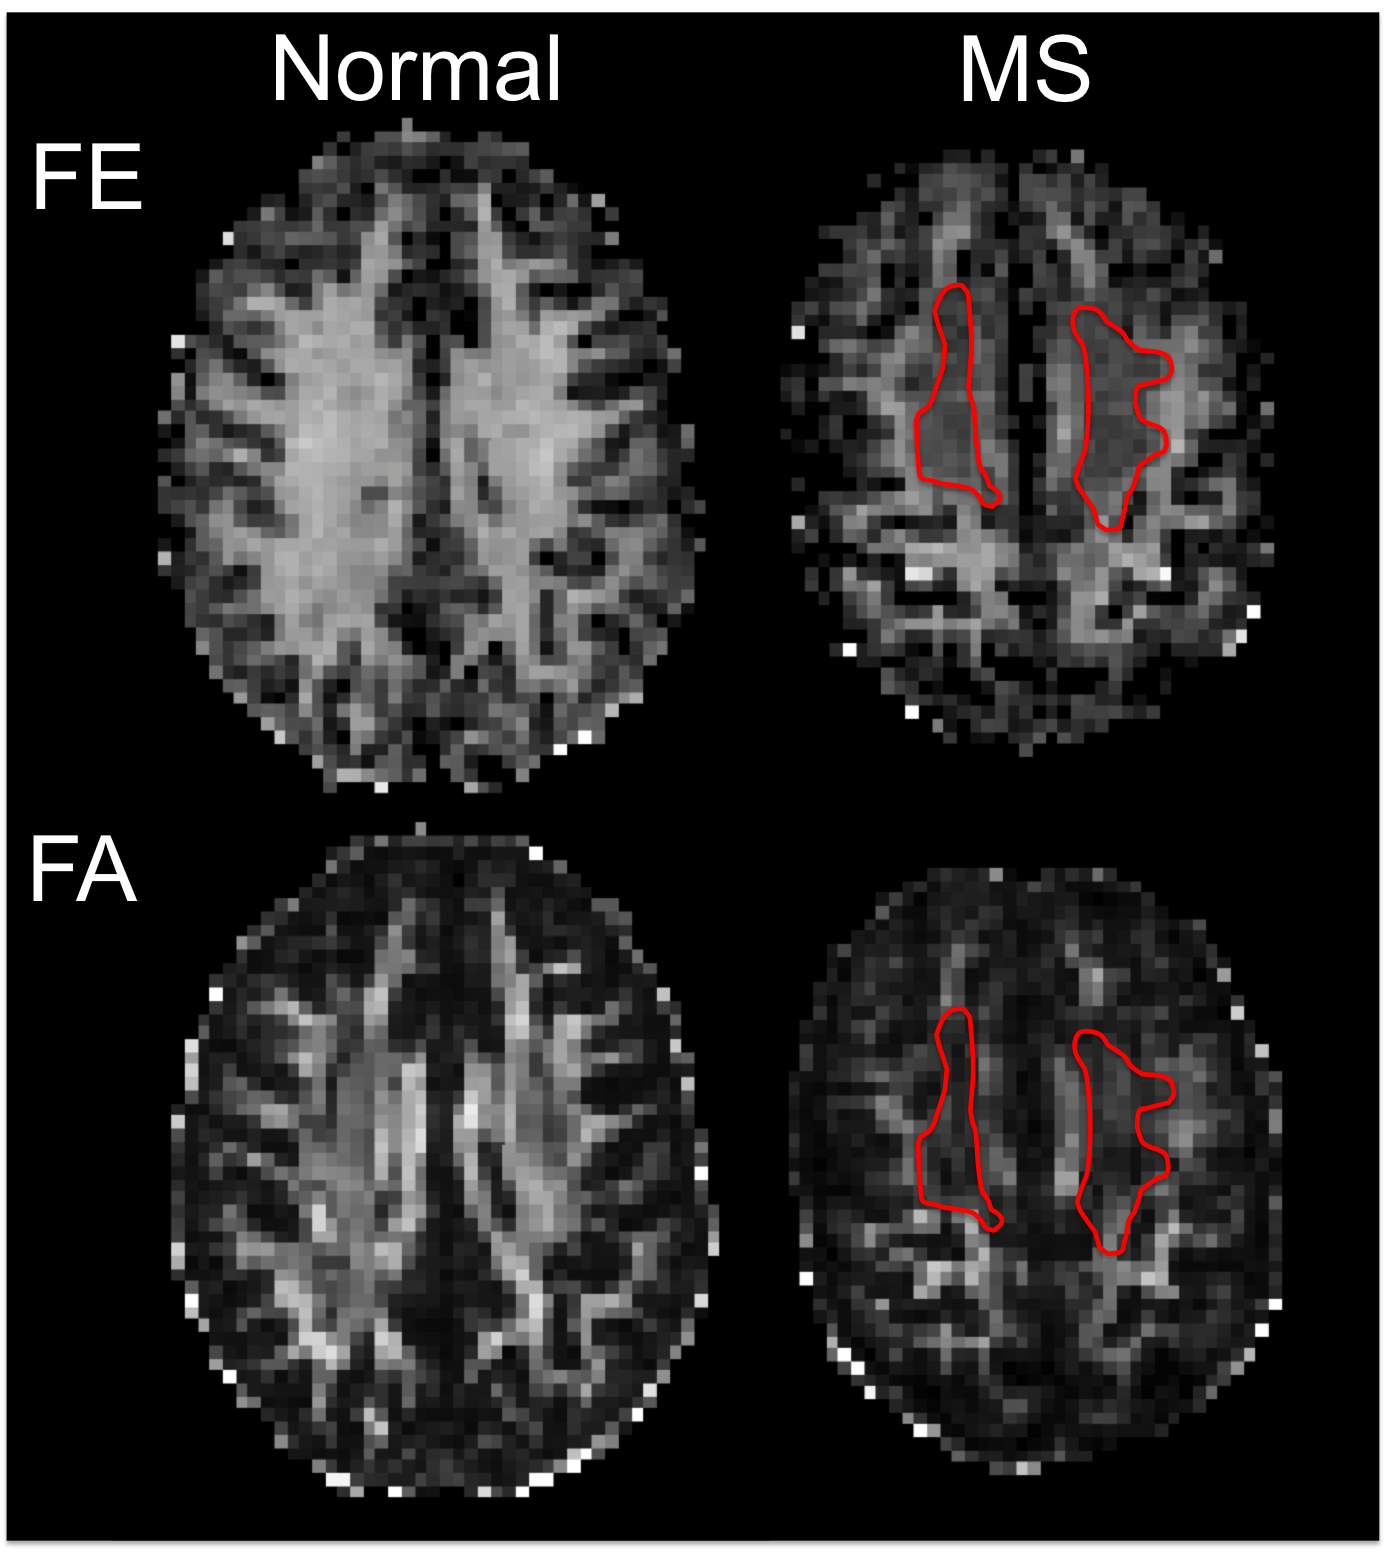
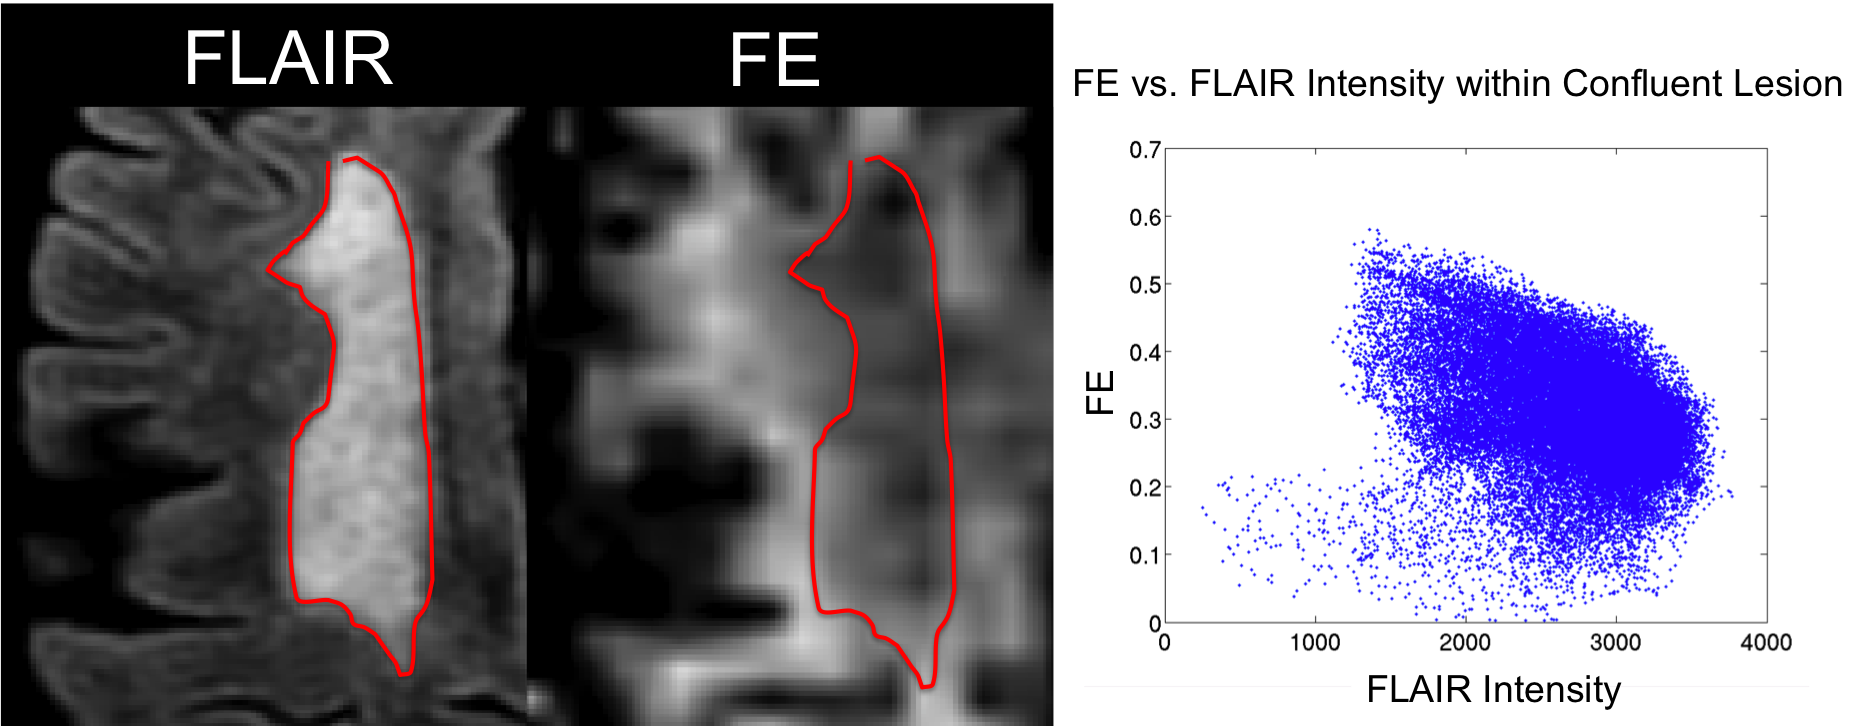
T2 FLAIR, FE, and FA from each subject are shown in Figure 2. The majority of hyperintense lesions on T2-FLAIR correspond to hypointensities on both FE and FA. However, the extent of hypointensities on FE more closely reflects the extent of lesions on T2 FLAIR (Fig. 3). Lesions on FA are confounded with hypointensities caused by crossing fiber regions in the white matter since FA is sensitive to orientation dispersion. In crossing fiber regions such as the centrum semi-ovale, reduced FA compared to adjacent white matter is present in both normal and MS brains, while reduced FE appears more specific to the presence of lesions in the MS brain (Fig. 4). Regions within the large confluent lesions in subject 4 exhibit considerable variations in FE (Fig. 5). The variations in FE within the lesion show only a slight correlation (R = -0.349) to FLAIR intensity. This variation in FE is not limited to partial volume effects with surrounding tissue as these variations exist in the interior of large confluent lesions. This may suggest that FE provides additional information about changes in tissue microstructure distinct from T2 FLAIR (the current standard for evaluating MS lesions).Conclusion
Here we present the first measurements of microscopic anisotropy using DDE on MS patients in a clinical setting. The FE maps generated from DDE measurements suggest an improved specificity to changes in fiber integrity in MS patients compared to FA. Further, DDE FE maps display variations within lesions that are not visible on T2-FLAIR images and may represent additional insights into changes in tissue microstructure caused by MS.Acknowledgements
Funding provided by an NSF-GRFP, a Li-Ka Shing-Oxford-Stanford Big Data in Human Health Seed grant, NIH: R01-NS095985, S10-RR026351, P41-EB015891, Stanford Radiology Angel Funds, and GE Healthcare. Thanks for pulse sequence design assistance from Matthew Middione and Ek Tsoon Tan, and assistance from Curtis Abercrombie in acquiring the MS patient data.References
1 Mitra, P. P. (1995). Multiple wave-vector extensions of the NMR pulsed-field-gradient spin-echo diffusion measurement. Phys Rev B Condens Matter, 51(21), 15074-15078.
2 Shemesh, N., & Cohen, Y. (2011). Microscopic and compartment shape anisotropies in gray and white matter revealed by angular bipolar double-PFG MR. Magn Reson Med, 65(5), 1216-1227. doi:10.1002/mrm.22738
3 Ozarslan, E., & Basser, P. J. (2008). Microscopic anisotropy revealed by NMR double pulsed field gradient experiments with arbitrary timing parameters. J Chem Phys, 128(15), 154511. doi:10.1063/1.2905765
4 Lawrenz, M., & Finsterbusch, J. (2011). Detection of microscopic diffusion anisotropy on a whole-body MR system with double wave vector imaging. Magn Reson Med, 66(5), 1405-1415. doi:10.1002/mrm.22934
5 Lawrenz, M., & Finsterbusch, J. (2015). Mapping measures of microscopic anisotropy in human brain white matter in vivo with double-wave-vector diffusion-weighted imaging. Magn Reson Med, 73(2), 773-783. doi:10.1002/mrm.25140
6 Jespersen, S. N., Lundell, H., Sonderby, C. K., & Dyrby, T. B. (2013). Orientationally invariant metrics of apparent compartment eccentricity from double pulsed field gradient diffusion experiments. NMR Biomed, 26(12), 1647-1662. doi:10.1002/nbm.2999
7 Yang, G., Tian, Q., Leuze, C., & McNab, J. Optimizing the Gradient Encoding Scheme of Double Diffusion Encoding MRI for Obtaining Rotationally Invariant Metrics of Microscopic Anisotropy [abstract]. In: Proceedings of the ISMRM Diffusion Workshop: 2016, Sept. 11-16; Lisbon, Portugal, Abstract nr 44.
Figures