1093
Diffusion MRI differentiated acute inflammation from axonal injury but missed axonal loss1Radiology, Washington University School of Medicine, St. Louis, MO, United States, 2Biostatistics, Washington University School of Medicine, St. Louis, MO, United States, 3The Hope Center for Neurological Disorders, Washington University School of Medicine, St. Louis, MO, United States, 4Biomedical Engineering, Washington University in St. Louis, St. Louis, MO
Synopsis
Diffusion MRI with higher b-values and custom-designed diffusion schemes are critical to identify subtle and coexisting pathology in CNS. In the current study, we employed single-axial high-b diffusion-weighted imaging (DWI) and low-b diffusion basis spectrum imaging (DBSI) to assess mouse optic nerve crush acutely. The results suggested coexisting CNS pathology affected apparent diffusion coefficient (ADC), and low-b DBSI was able to reflect axon and myelin integrity as well as inflammatory edema and cellularity even before histological detection. DBSI-detected axon volume correlated with axonal loss negatively, suggesting cytotoxic-edema-associated axonal swelling might mask axonal loss acutely.
Introduction
Diffusion MRI sensitively reveals white matter structure and pathology. Higher b-values and custom-designed diffusion schemes are critical to identify subtle and coexisting structural and pathological confounds.1 Previously, we introduced diffusion basis spectrum imaging (DBSI) to assess coexisting axonal injury/loss, demyelination, and inflammation in multiple sclerosis (MS) and its animal models.2-5 In the current study, we assess mouse optic nerve crush (ONC) model immediately (Day 0) and 3 days (Day 3) after injury with single-axial high-b diffusion-weighted imaging (DWI, parallel and perpendicular to axons) and DBSI with multiple-direction low-b diffusion-weighting to examine the sensitivity of diffusion MRI to detect evolving axonal pathologies after ONC. Changes in directional apparent diffusion coefficient (ADC) and DBSI isotropic and anisotropic metrics were analyzed and correlated immunohistochemical (IHC) validation.Materials and Methods
Animal model: Ten 10-week-old female C57BL/6 mice were anesthetized by intraperitoneal injection of ketamine (87 mg/kg) and xylazine (13 mg/kg). Under the binocular scope, a small incision was made at the conjunctiva by a spring scissor at the left eye. Two 45-degree-bent micro-forceps were used to hold left eyeballs and grasp the nerve at the location approximately 1-2 mm from the eyeball for 20 s. Right eye was served as the control. DWI&DBSI: A pair of volume and surface active-decoupled coils were used. DBSI was performed immediately (Day 0, n=5) or 3 days (Day 3, n=5) post-ONC on a 4.7-T Agilent small-animal MR scanner utilizing a multiple-echo spin-echo diffusion-weighted sequence.6 DWI: A serial DWIs in phase-encode (DWI⊥, perpendicular to optic nerves) or slice-selection (DWI∥, parallel to optic nerves) directions were acquired with TR = 1.5 s, TE = 35 ms, inter-echo delay = 20.7 ms, slice thickness = 1.4 mm, FOV (field-of-view) = 30 × 30 mm2, matrix = 192 × 192, DWI⊥: Δ = 30 ms, δ = 8 ms, with 21 b-values (from 0 up to 20,000 s/mm2). DWI∥: Δ = 25 ms, δ = 6 ms, with 21 b-values (from 0 up to 10,000 s/mm2). DBSI: A 25-direction diffusion scheme was employed. All images were obtained with following acquisition parameters: TR = 1.5 s, TE = 35 ms, inter-echo delay = 20.7 ms, Δ = 18 ms, δ = 6 ms, maximal b-value = 2,200 s/mm2, with the same FOV, slice thickness, and matrix size as DWI||/⊥. Data analysis: A lab-developed DBSI code was performed on DWI data to estimate DBSI derived λǁ, λ⊥, restricted (putative cellularity) and non-restricted isotropic (putative edema) diffusion tensor fractions. Histology: mice were perfusion fixed immediately after the in vivo MR measurements for IHC staining of SMI-312, MBP, DAPI, SMI-31, GFAP, and Iba1.Results
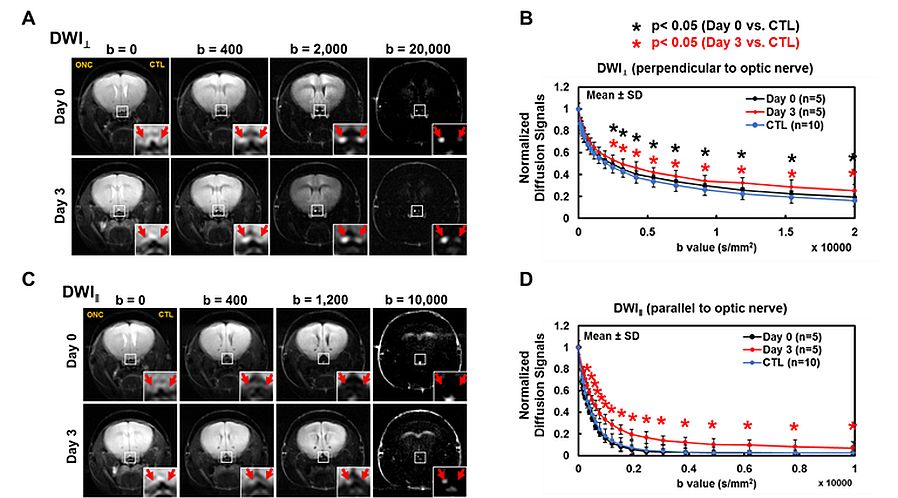
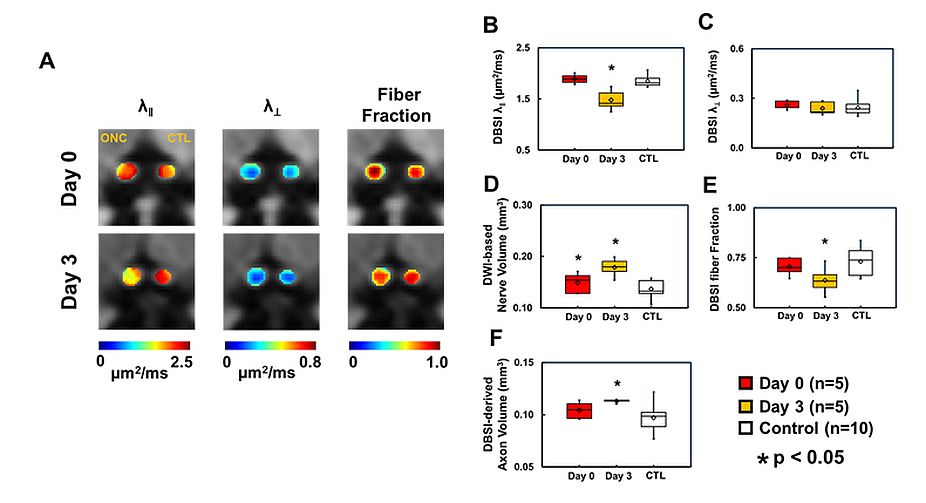
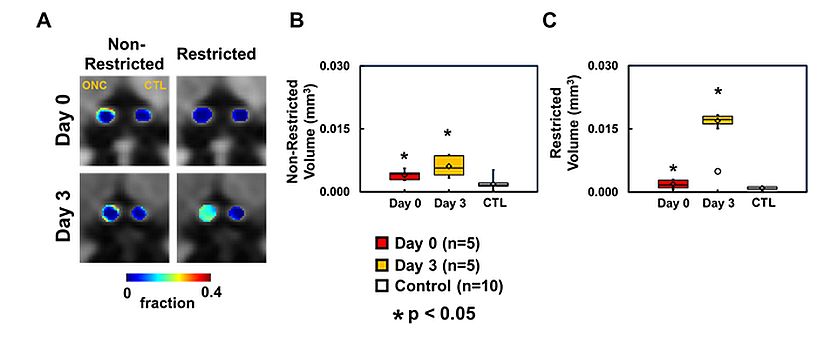
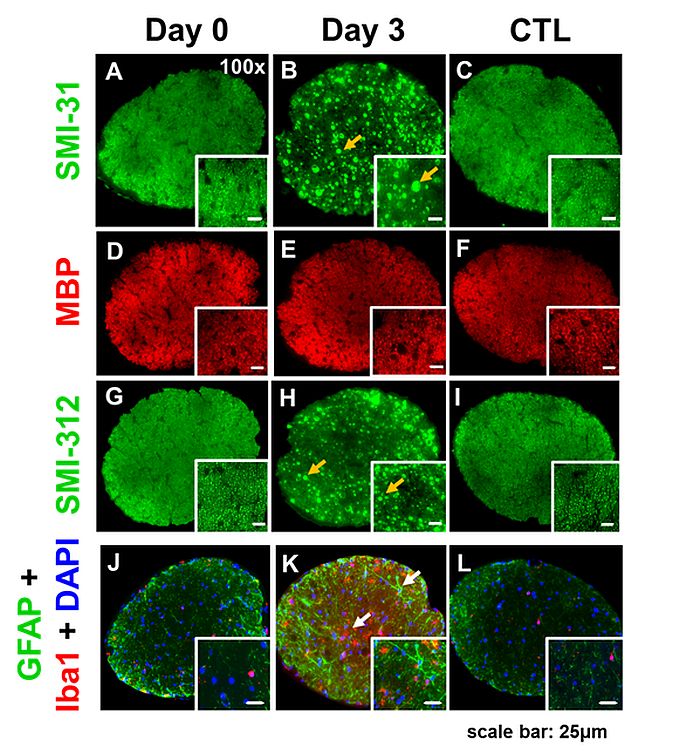
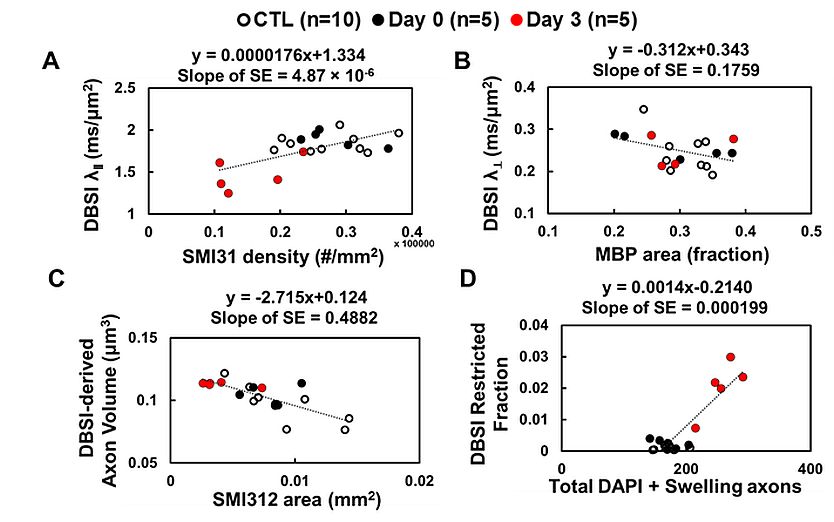
At Day 0 and 3 after ONC, optic nerves developed significant swelling (Fig. 2 D). Significantly higher intensity was seen in Day 3 after ONC (vs. control, p < 0.05) at b > 1,900 and 100 s/mm2 for DWI⊥ and DWI∥, respectively (Fig.1 B and D, red), suggesting decreased ADC⊥ and ADC∥. Axonal injury and inflammation was detected by DBSI as decreased λǁ and increased non-restricted and restricted volume in Day 3 after ONC (Fig. 2B and 3). Increased cross-section area (Fig. 4, yellow arrows) and less positive intensity in SMI-31 and SMI-312 staining suggested axonal injury/beading and loss. More activated astrocytes, microglia, and cell nuclei were confirmed by increased positive staining of GFAP/Iba1/DAPI (Fig. 4 K). Day 0-ONC demonstrated slightly but significant higher diffusion signals in DWI⊥ (b > 1,400 s/mm2, p < 0.05) while no changes in DWI∥ (vs. control) respectively suggesting small portion of decreased ADC⊥. The DBSI results of Day 0-ONC suggested no axonal injury (no DBSI λǁ decrease) but increased inflammatory edema and cellularity reflected as increased non-restricted and restricted volume (Fig. 3). The IHC results of Day 0-ONC were comparable to those of control nerves and suggested that DBSI detected acute axonal swelling resulting from inflammation before injury. This was also reflected by the overlapped DWI∥ intensity between Day 0 and control nerves. No myelin injury was seen in either Day 0- or Day 3-ONC nerve (Fig. 2C and 4D – F). Increased DBSI-derived axonal volume (nerve volume × fiber fraction) were seen in Day 0- and Day 3-ONC (Fig. 2D – F), correlating with SMI-312 (total axons) negatively. This further suggests acute inflammatory axonal swelling might mask axonal loss (Fig. 5C).Conclusion
Coexisting white matter pathology affects ADCs. DBSI-derived multi-metrics are capable to detect multiple pathologies even before IHC change. DBSI-derived axon volume reflected chronic axonal loss but might be masked acutely by axonal swelling associated with cytotoxic edema or axonal beading.Acknowledgements
Supported in part by NIH R01-NS047592, P01-NS059560, and NMSS RG 5258-A-5, RG 1507-05315References
1. O'Donnell LJ, Westin CF. An introduction to diffusion tensor image analysis. Neurosurgery clinics of North America 2011;22:185-196, viii.
2. Lin T, Hallman M, Cusick MF, et al. Axon Loss as an Outcome Measure for Assessing Therapeutic Efficacy. Proc Intl Soc Mag Reson Med 24 (2016) 2016;0245.
3. Wang Y, Wang Q, Haldar JP, et al. Quantification of increased cellularity during inflammatory demyelination. Brain : a journal of neurology 2011;134:3590-3601.
4. Wang Y, Sun P, Wang Q, et al. Differentiation and quantification of inflammation, demyelination and axon injury or loss in multiple sclerosis. Brain : a journal of neurology 2015;138:1223-1238.
5. Chiang CW, Wang Y, Sun P, et al. Quantifying white matter tract diffusion parameters in the presence of increased extra-fiber cellularity and vasogenic edema. NeuroImage 2014;101:310-319.
6. Tu TW, Budde MD, Xie M, et al. Phase-aligned multiple spin-echo averaging: a simple way to improve signal-to-noise ratio of in vivo mouse spinal cord diffusion tensor image. Magnetic resonance imaging 2014;32:1335-1343.
Figures