1090
A 3D electron microscopy segmentation pipeline for hyper-realistic diffusion simulations1Oxford Centre for Functional MRI of the Brain, University of Oxford, Oxford, United Kingdom, 2Sir William Dunn School of Pathology, University of Oxford, Oxford, United Kingdom, 3Department of Anatomy, Donders Institute for Brain, Cognition & Behaviour, Radboud University Medical Center, Nijmegen, Netherlands
Synopsis
Simulations of the diffusion signal can shed light on how the MR signal is generated from particular tissue microstructure. In our approach we use microscopy data to generate a realistic ground truth for investigating diffusion properties. We have developed a method to automatically segment large volumes of 3D electron microscopy data into individual axons for diffusion simulations. From these segmentations, we can also derive benchmark tissue microstructure characteristics such as axonal diameter, g-ratio and other compartment properties.
Purpose
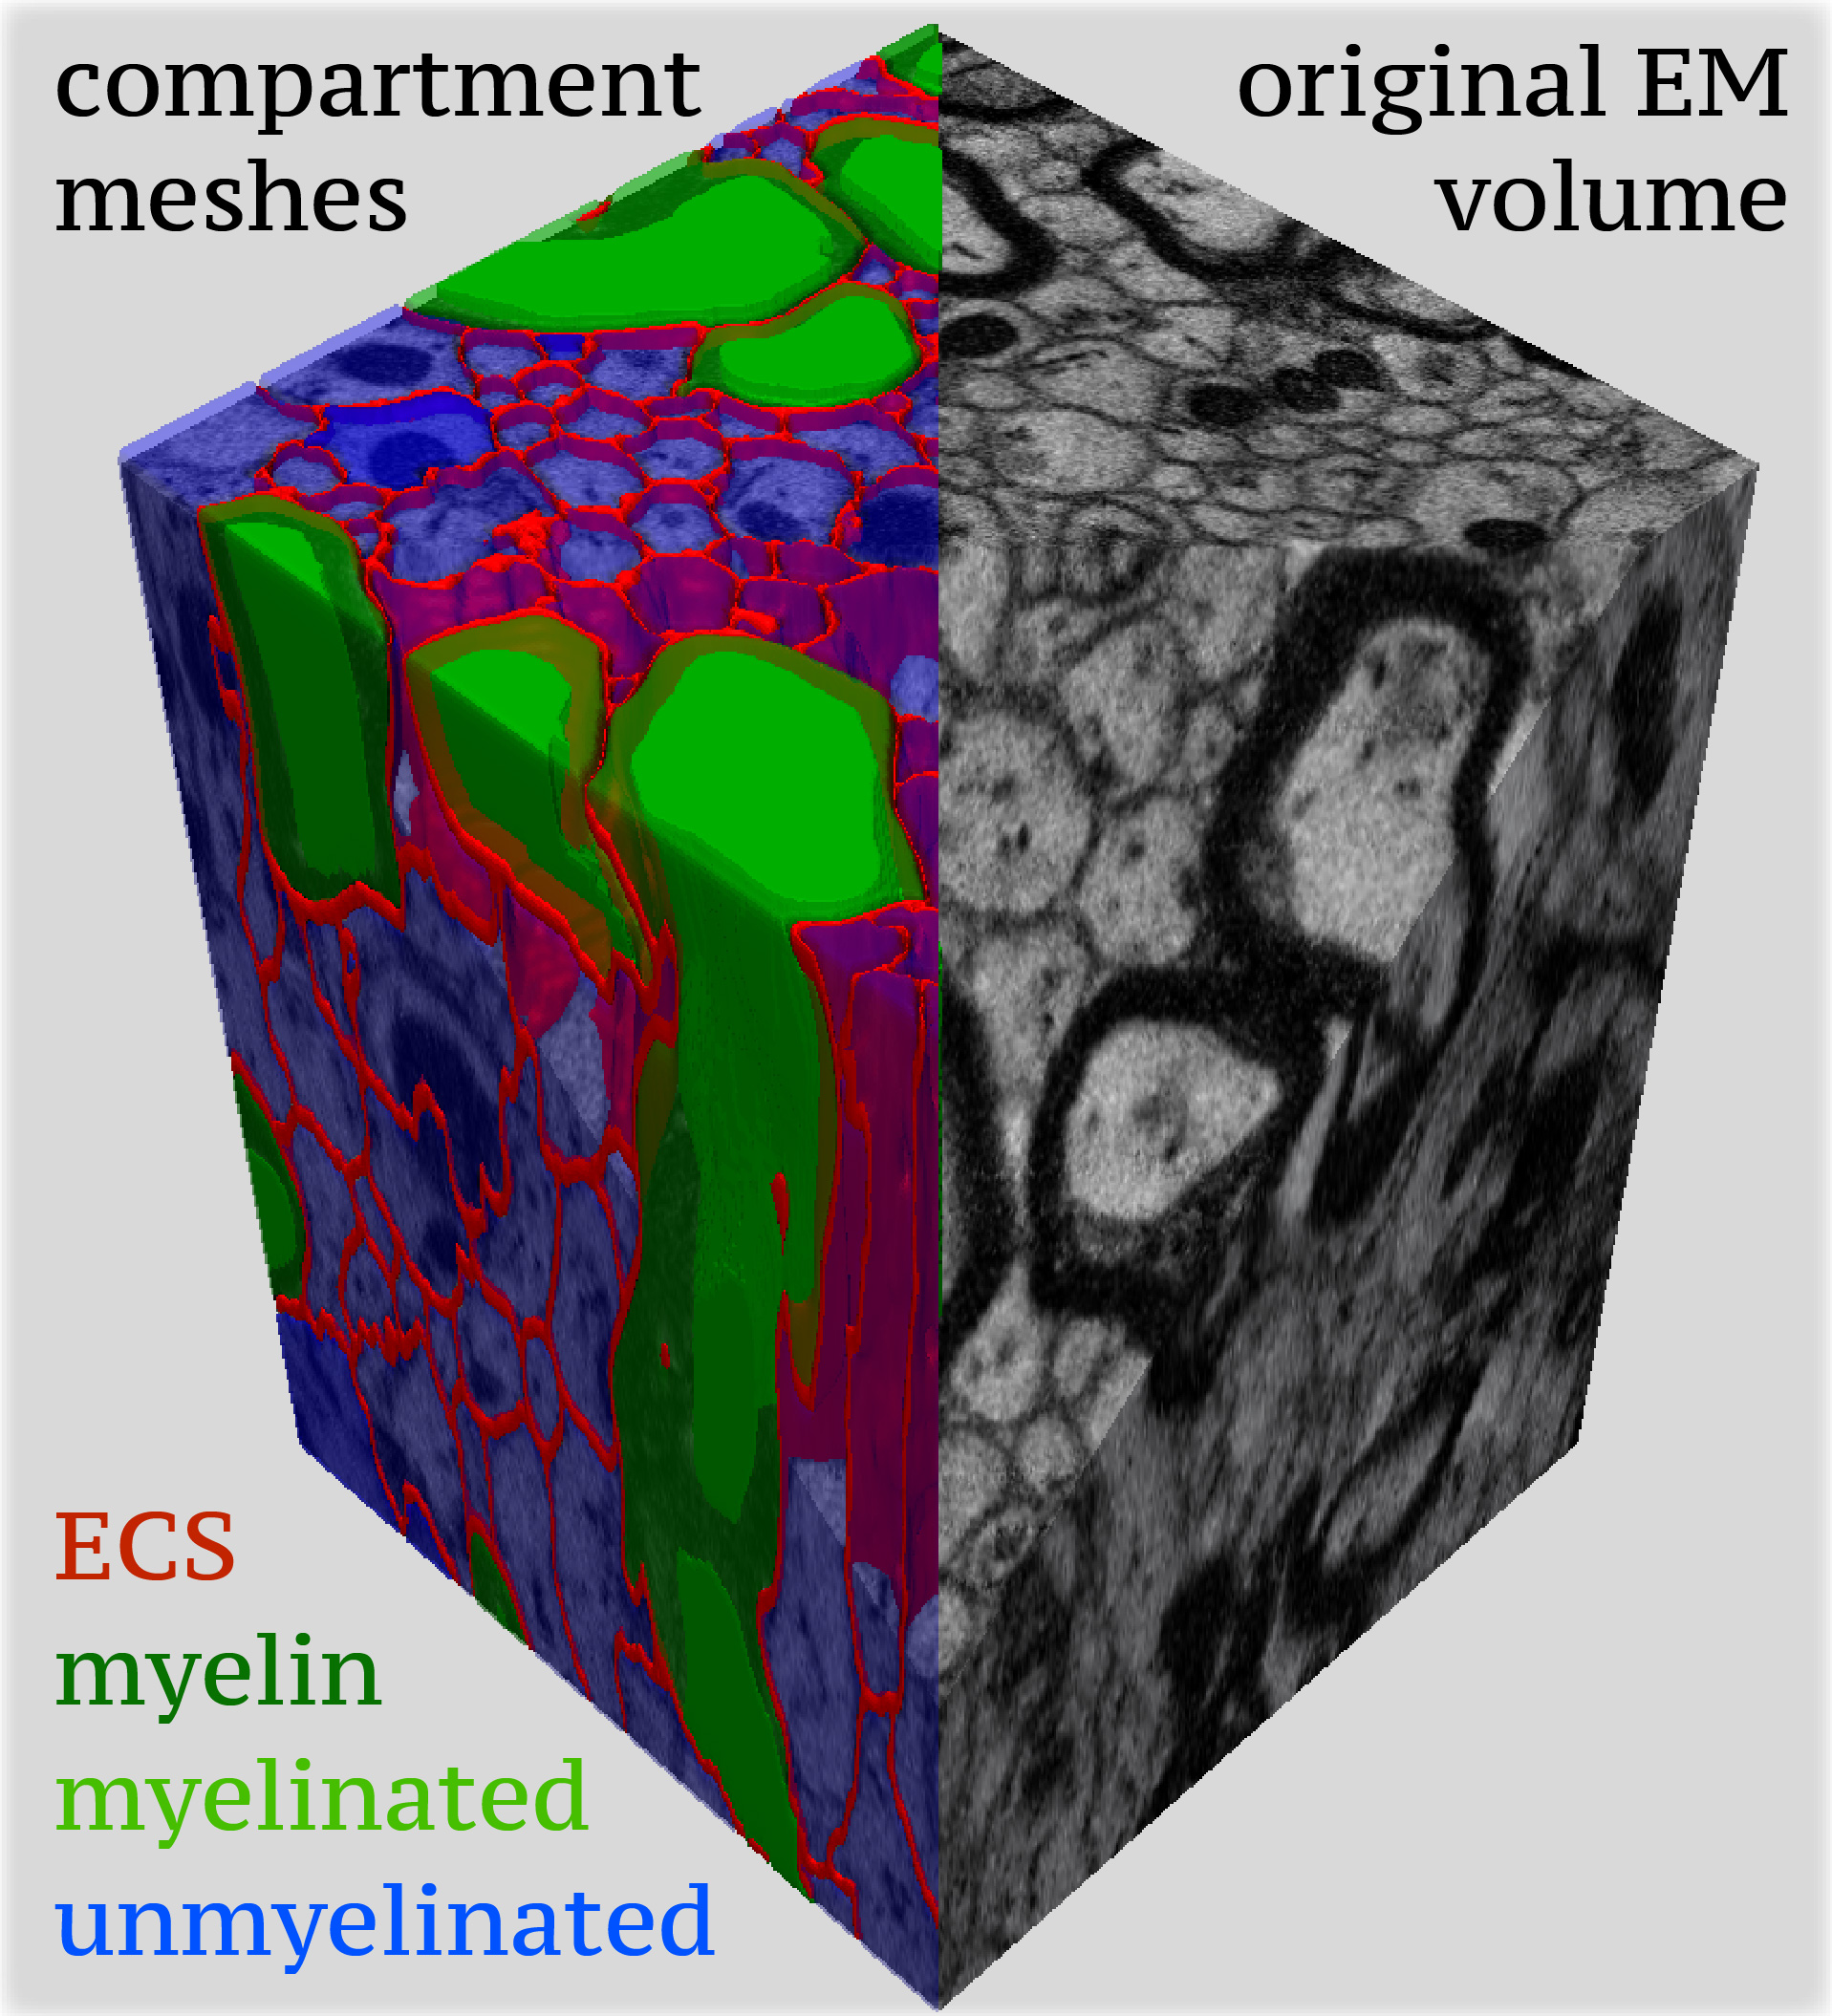
The microstructural complexity of white matter (WM) tissue is often not captured in models for diffusion MRI. This might skew interpretations of the microstructural underpinnings of the MR signal. We aim to address this shortcoming by using hyper-realistic simulations based on ground-truth microscopy data. Here, we present a pipeline for generating realistic mesh models based on 3D electron microscopy data. Additionally, we provide reference data for tissue WM microstructure, in particular on myelination characteristics.Methods
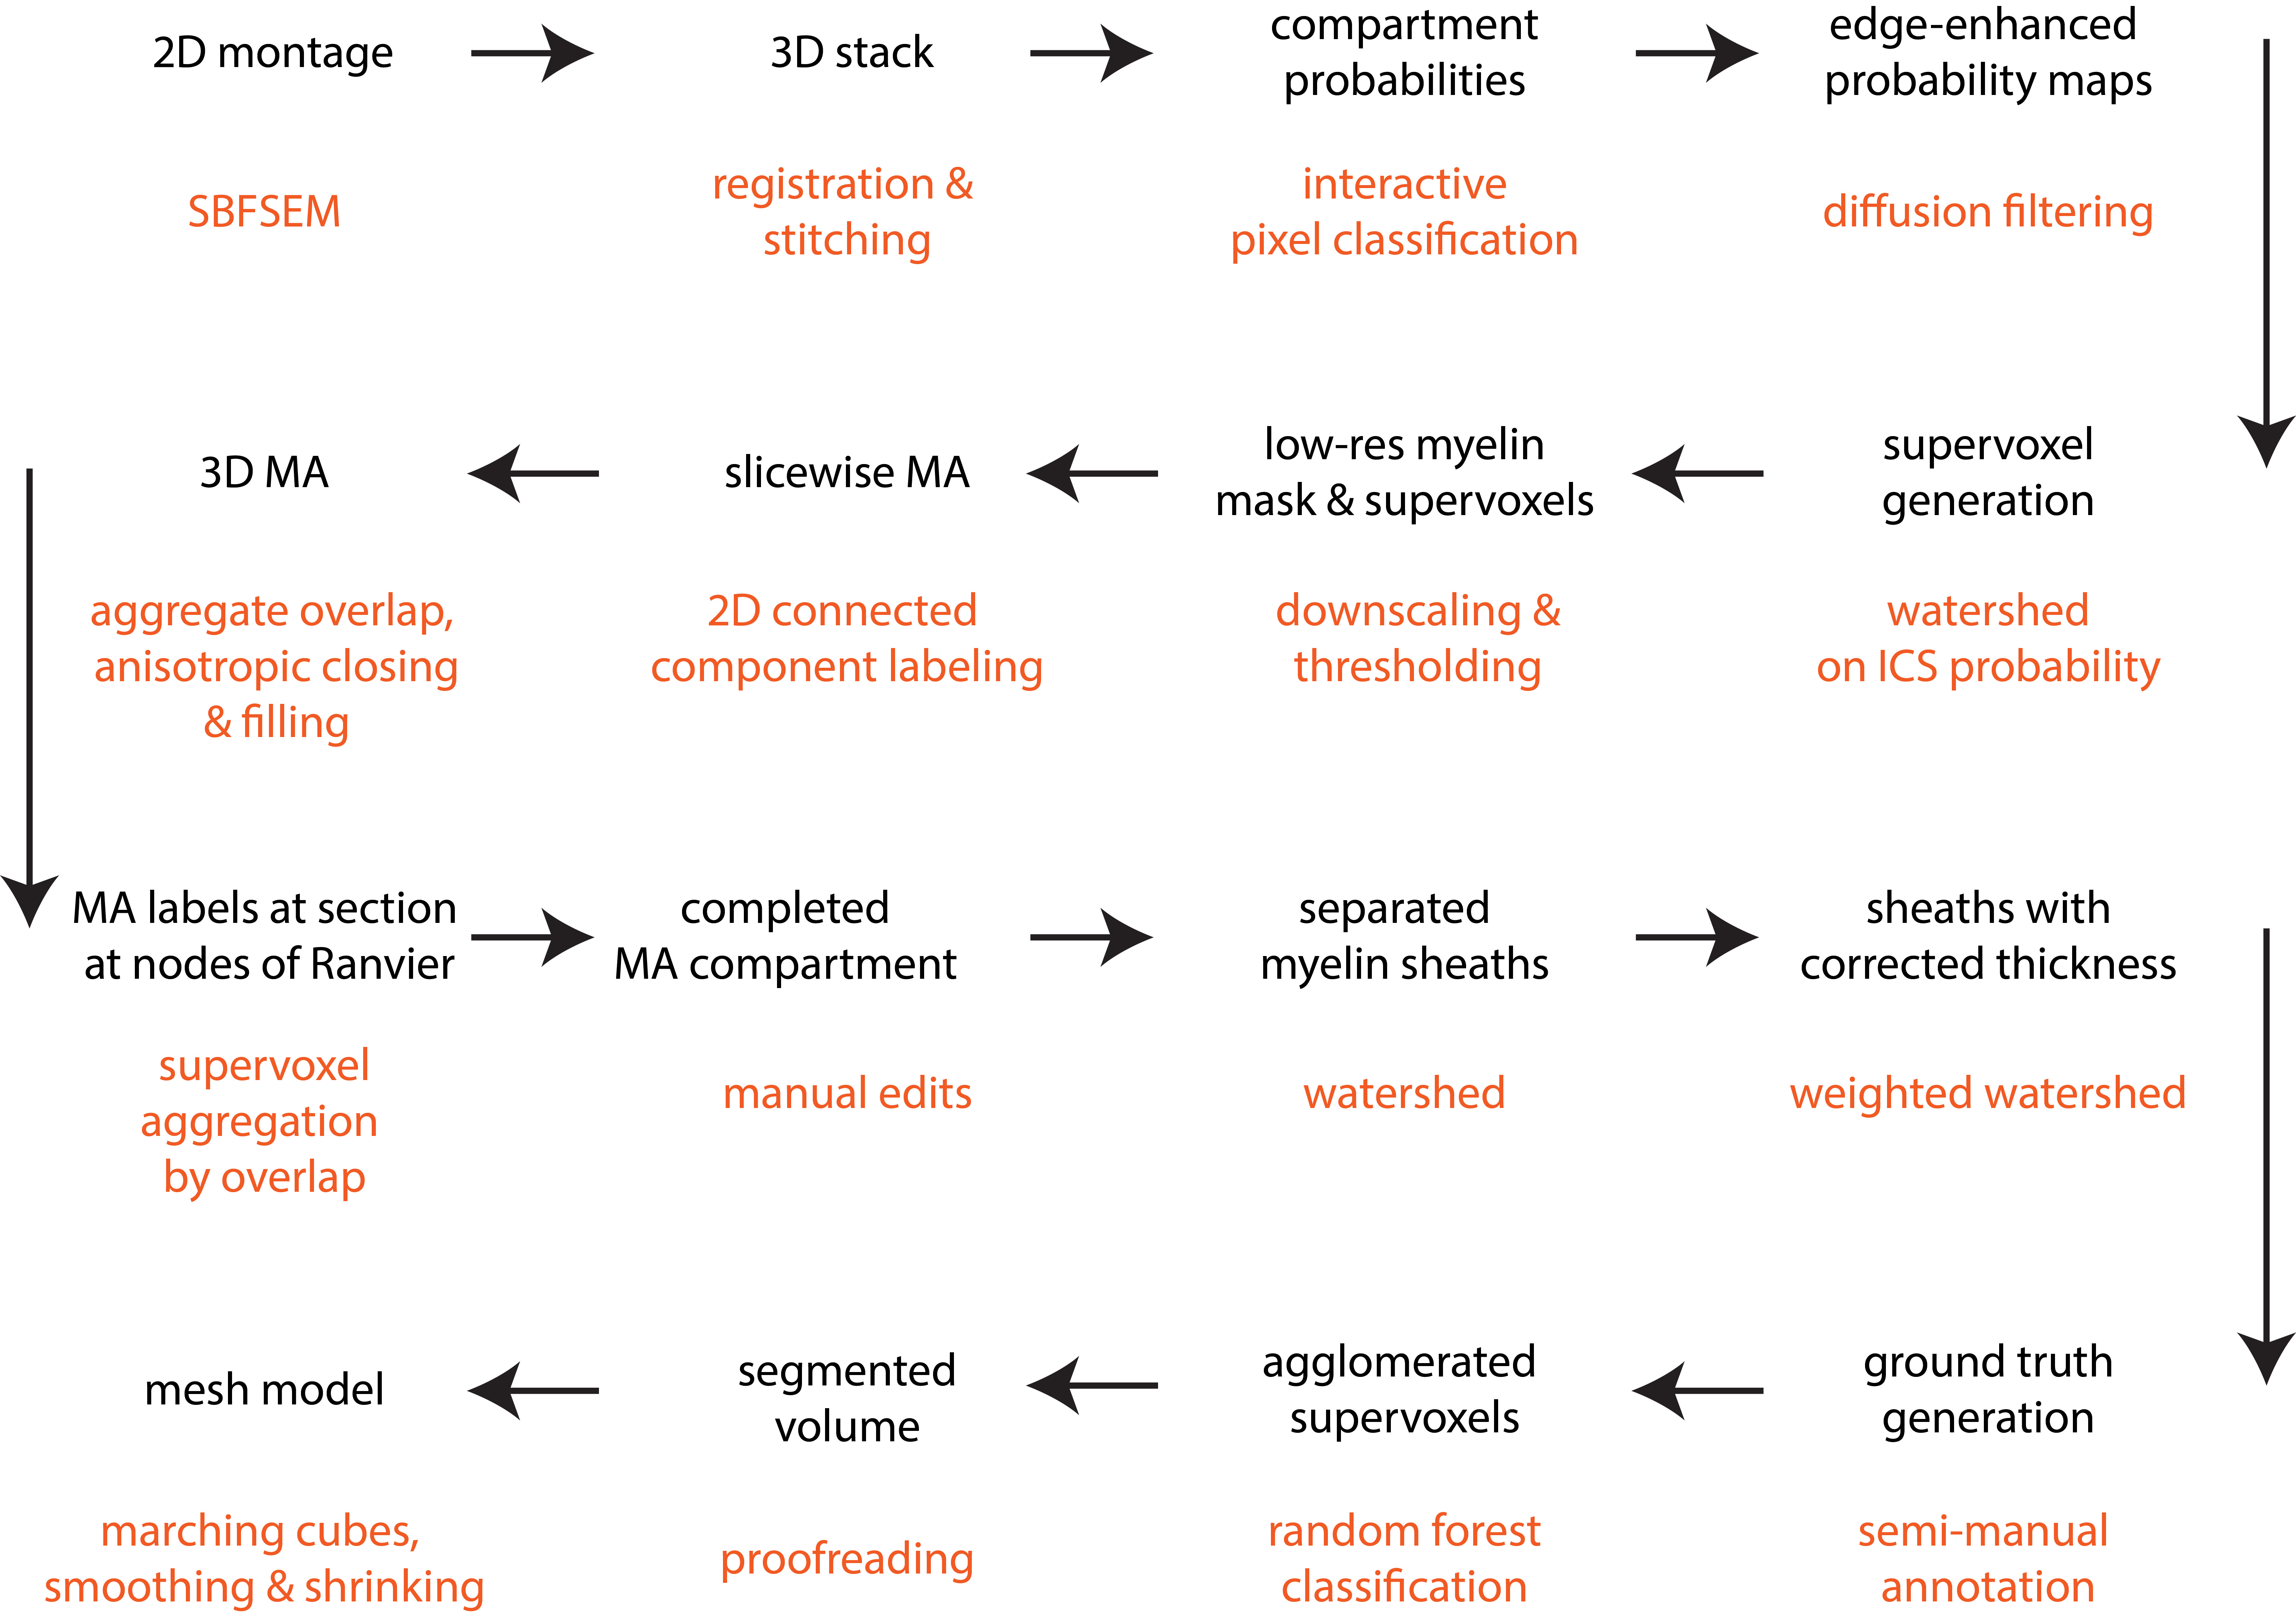
Our pipeline (Figure 1) was tested on a serial blockface scanning electron microscopy1 dataset (2x2 montage with 10% overlap, each with matrix 4000x4000x460, resolution 7.3x7.3x50 nm, FOV ~60x60x23 μm) acquired from the genu of the corpus callosum of a mouse brain in sagittal sections (prepared according to 2) with a Zeiss Merlin Compact Scanning Electron Microscope + Gatan 3View system. The most essential components of the segmentation pipeline are:
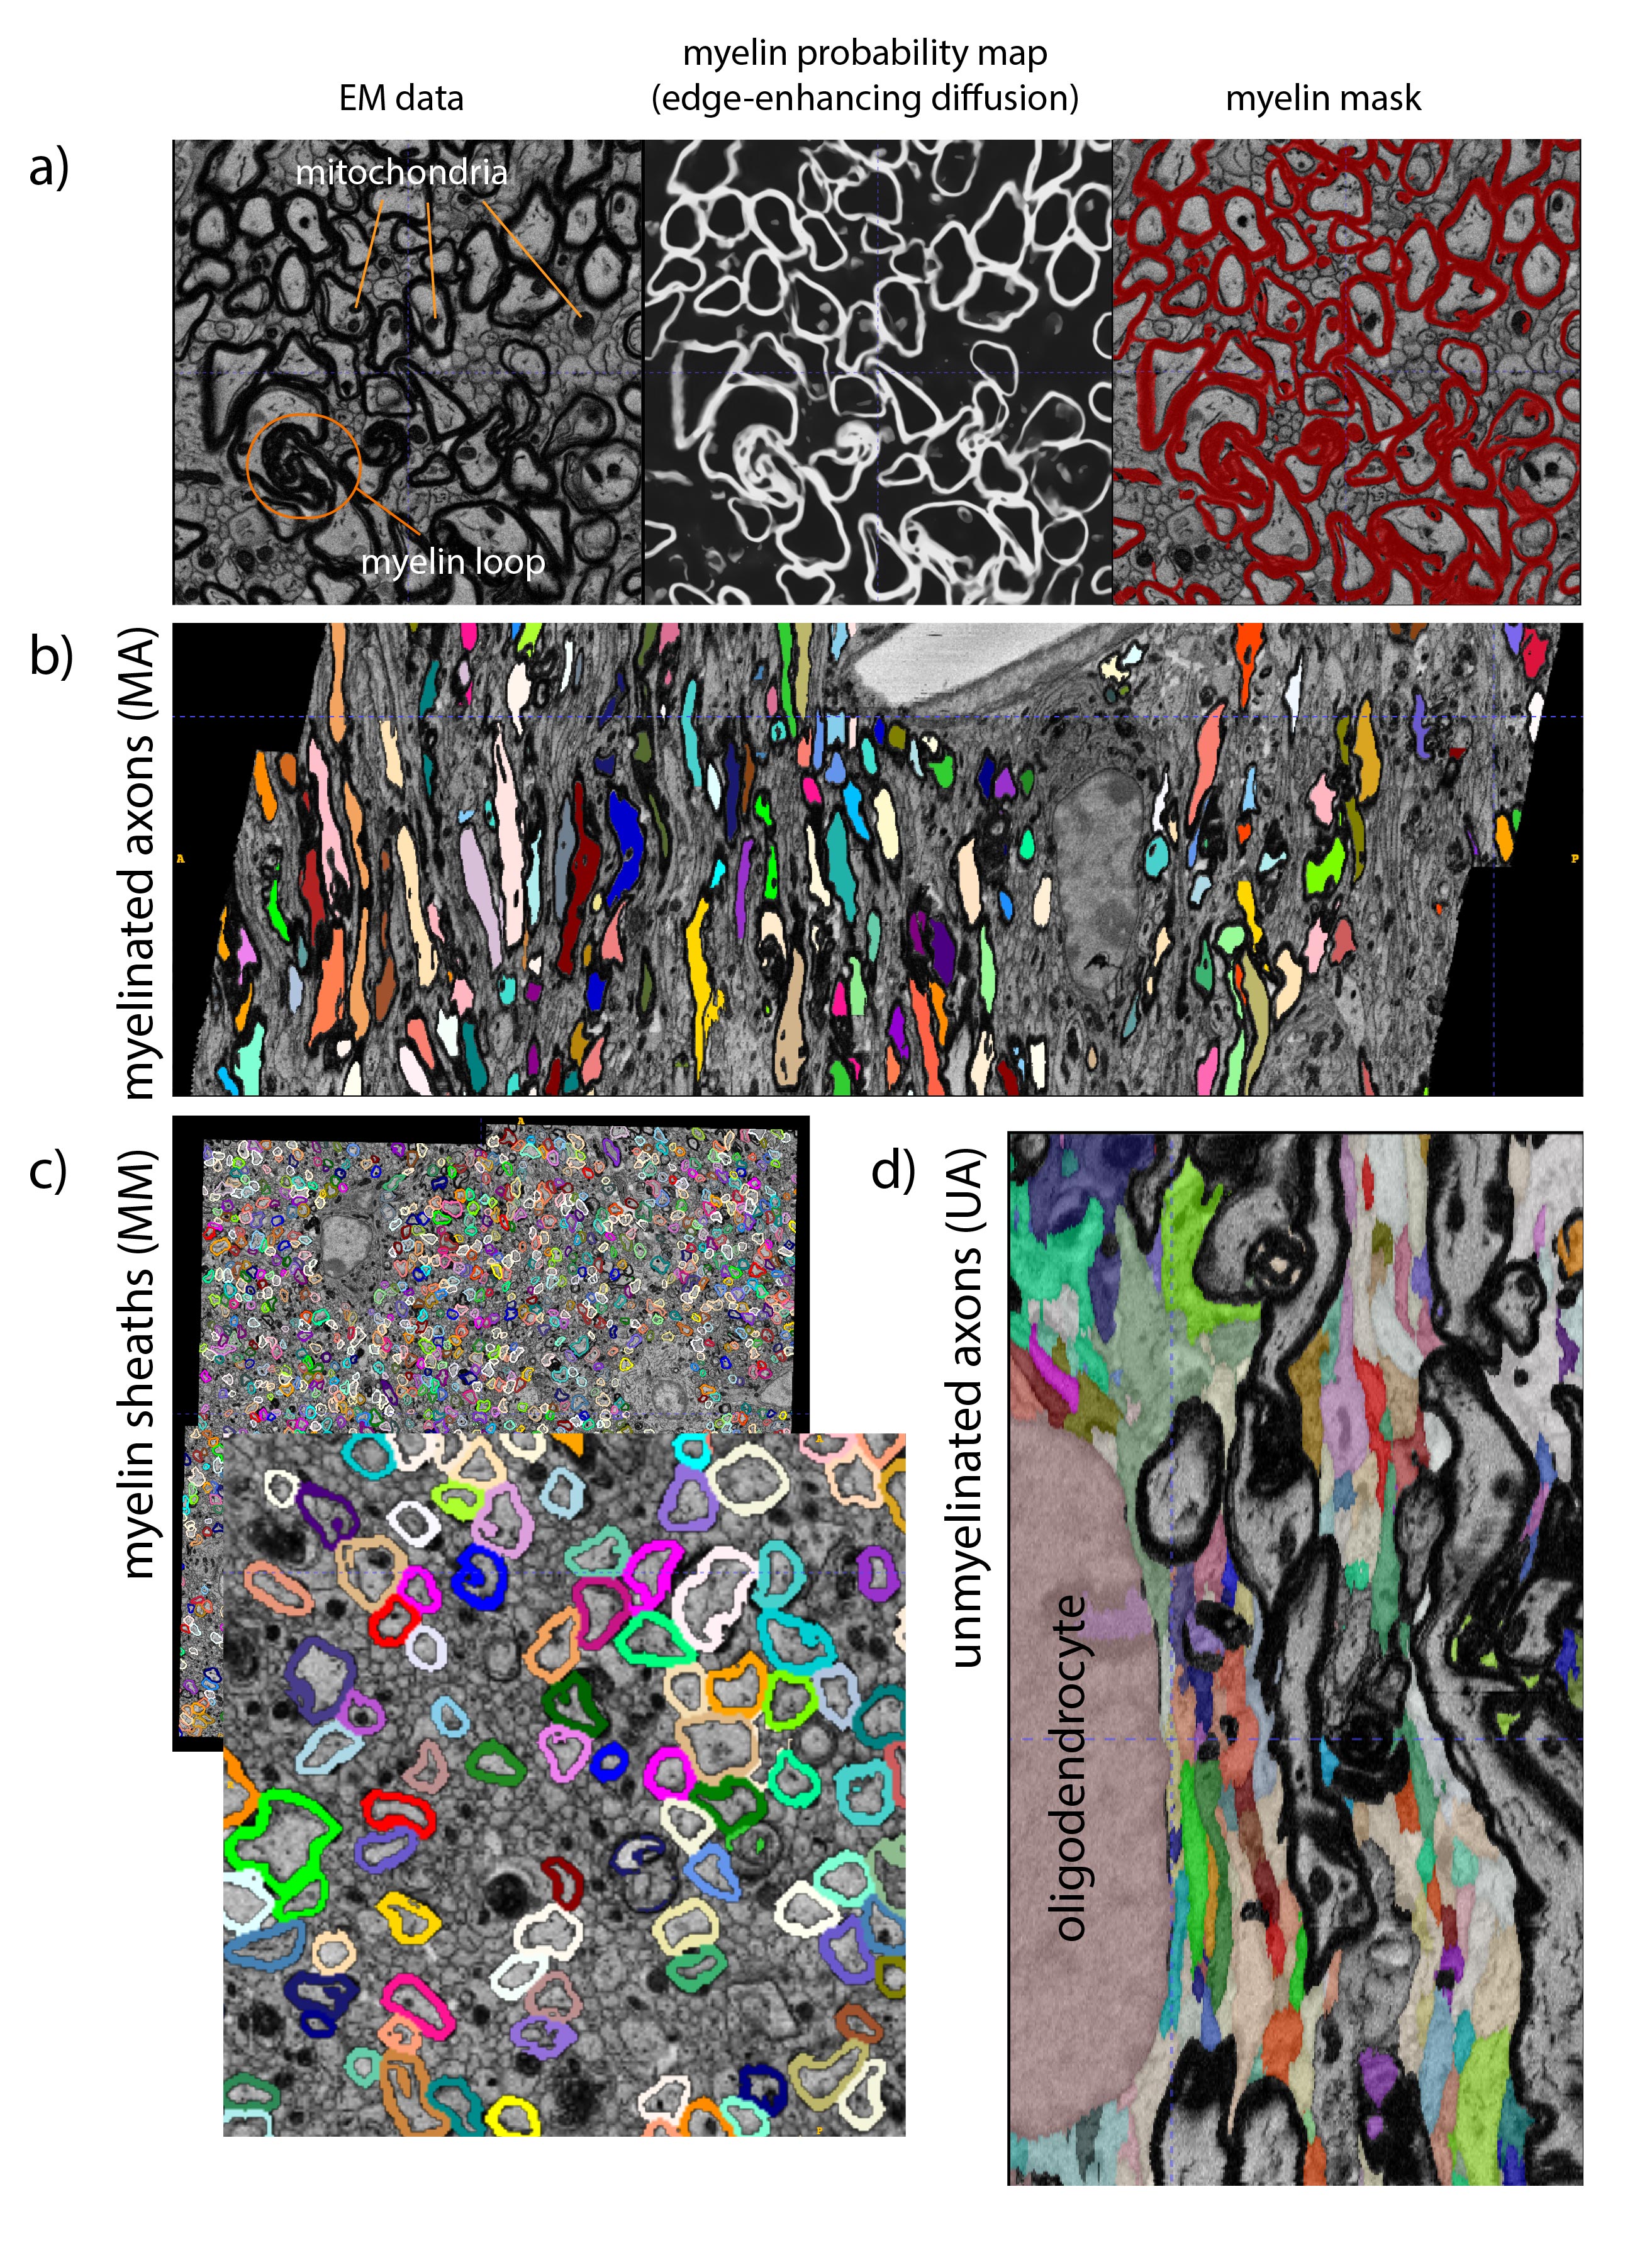
[1] Generating compartment probability maps by interactive pixel classification (Ilastik3).
[2] Labeling of all myelinated axons (MA). Connected component labeling is performed slicewise in 2D on an isotropically downsampled version of a myelin mask created by thresholding the myelin probability map at P>0.2 (acceptance criteria: 10px<area<1500 px; euler number≥0; area/areaboundingbox>0.30, area/areaconvexhull>0.50). The 3D MA compartment is then generated by aggregating labels along the slice direction (2D labels with 50% overlapping pixels), where gaps are filled by an anisotropic closing operation covering 6 slices. Morphological image closing and hole-filling are performed to include mitochondria in the MA compartment. This stage labeling is completed by manual editing to correct residual errors in the 3D MA compartment.
[3] Individual myelin sheaths (MM) are generated by watershed of the distance transform of the MA mask. A first pass is performed constrained to a part of the myelin mask extending no more than 0.25 μm from the MA mask (this excludes most mitochondria that are often included in the myelin mask). In order to better capture the boundary between neighbouring axons with different sheath thickness, a second pass is performed where the distance transform is weighted by a sigmoid function representing the per-axon median thickness.
[4] The remaining tissue compartments, mainly unmyelinated axons (UA), are segmented by automated classification (Neuroproof4). First, supervoxels are generated by watershed of the probability map for intracellular space. Next, a random forest classifier is trained on a semi-manually annotated training dataset. Finally, the supervoxels are agglomerated to form the processes of unmyelinated axons and glia (GP), glial bodies (GB) and blood vessels (BV). This stage also requires proofreading to correct split/merge errors.
Results
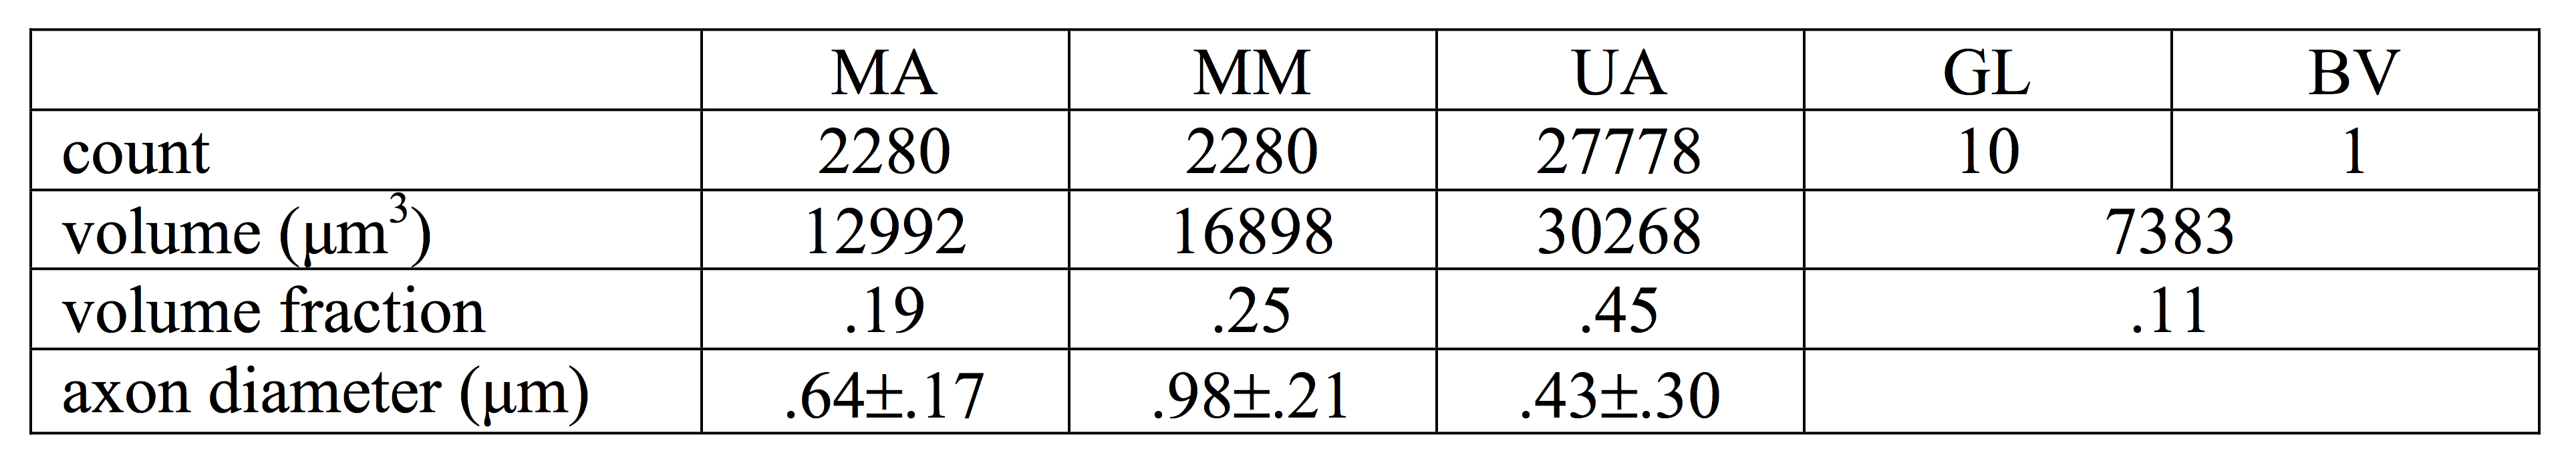
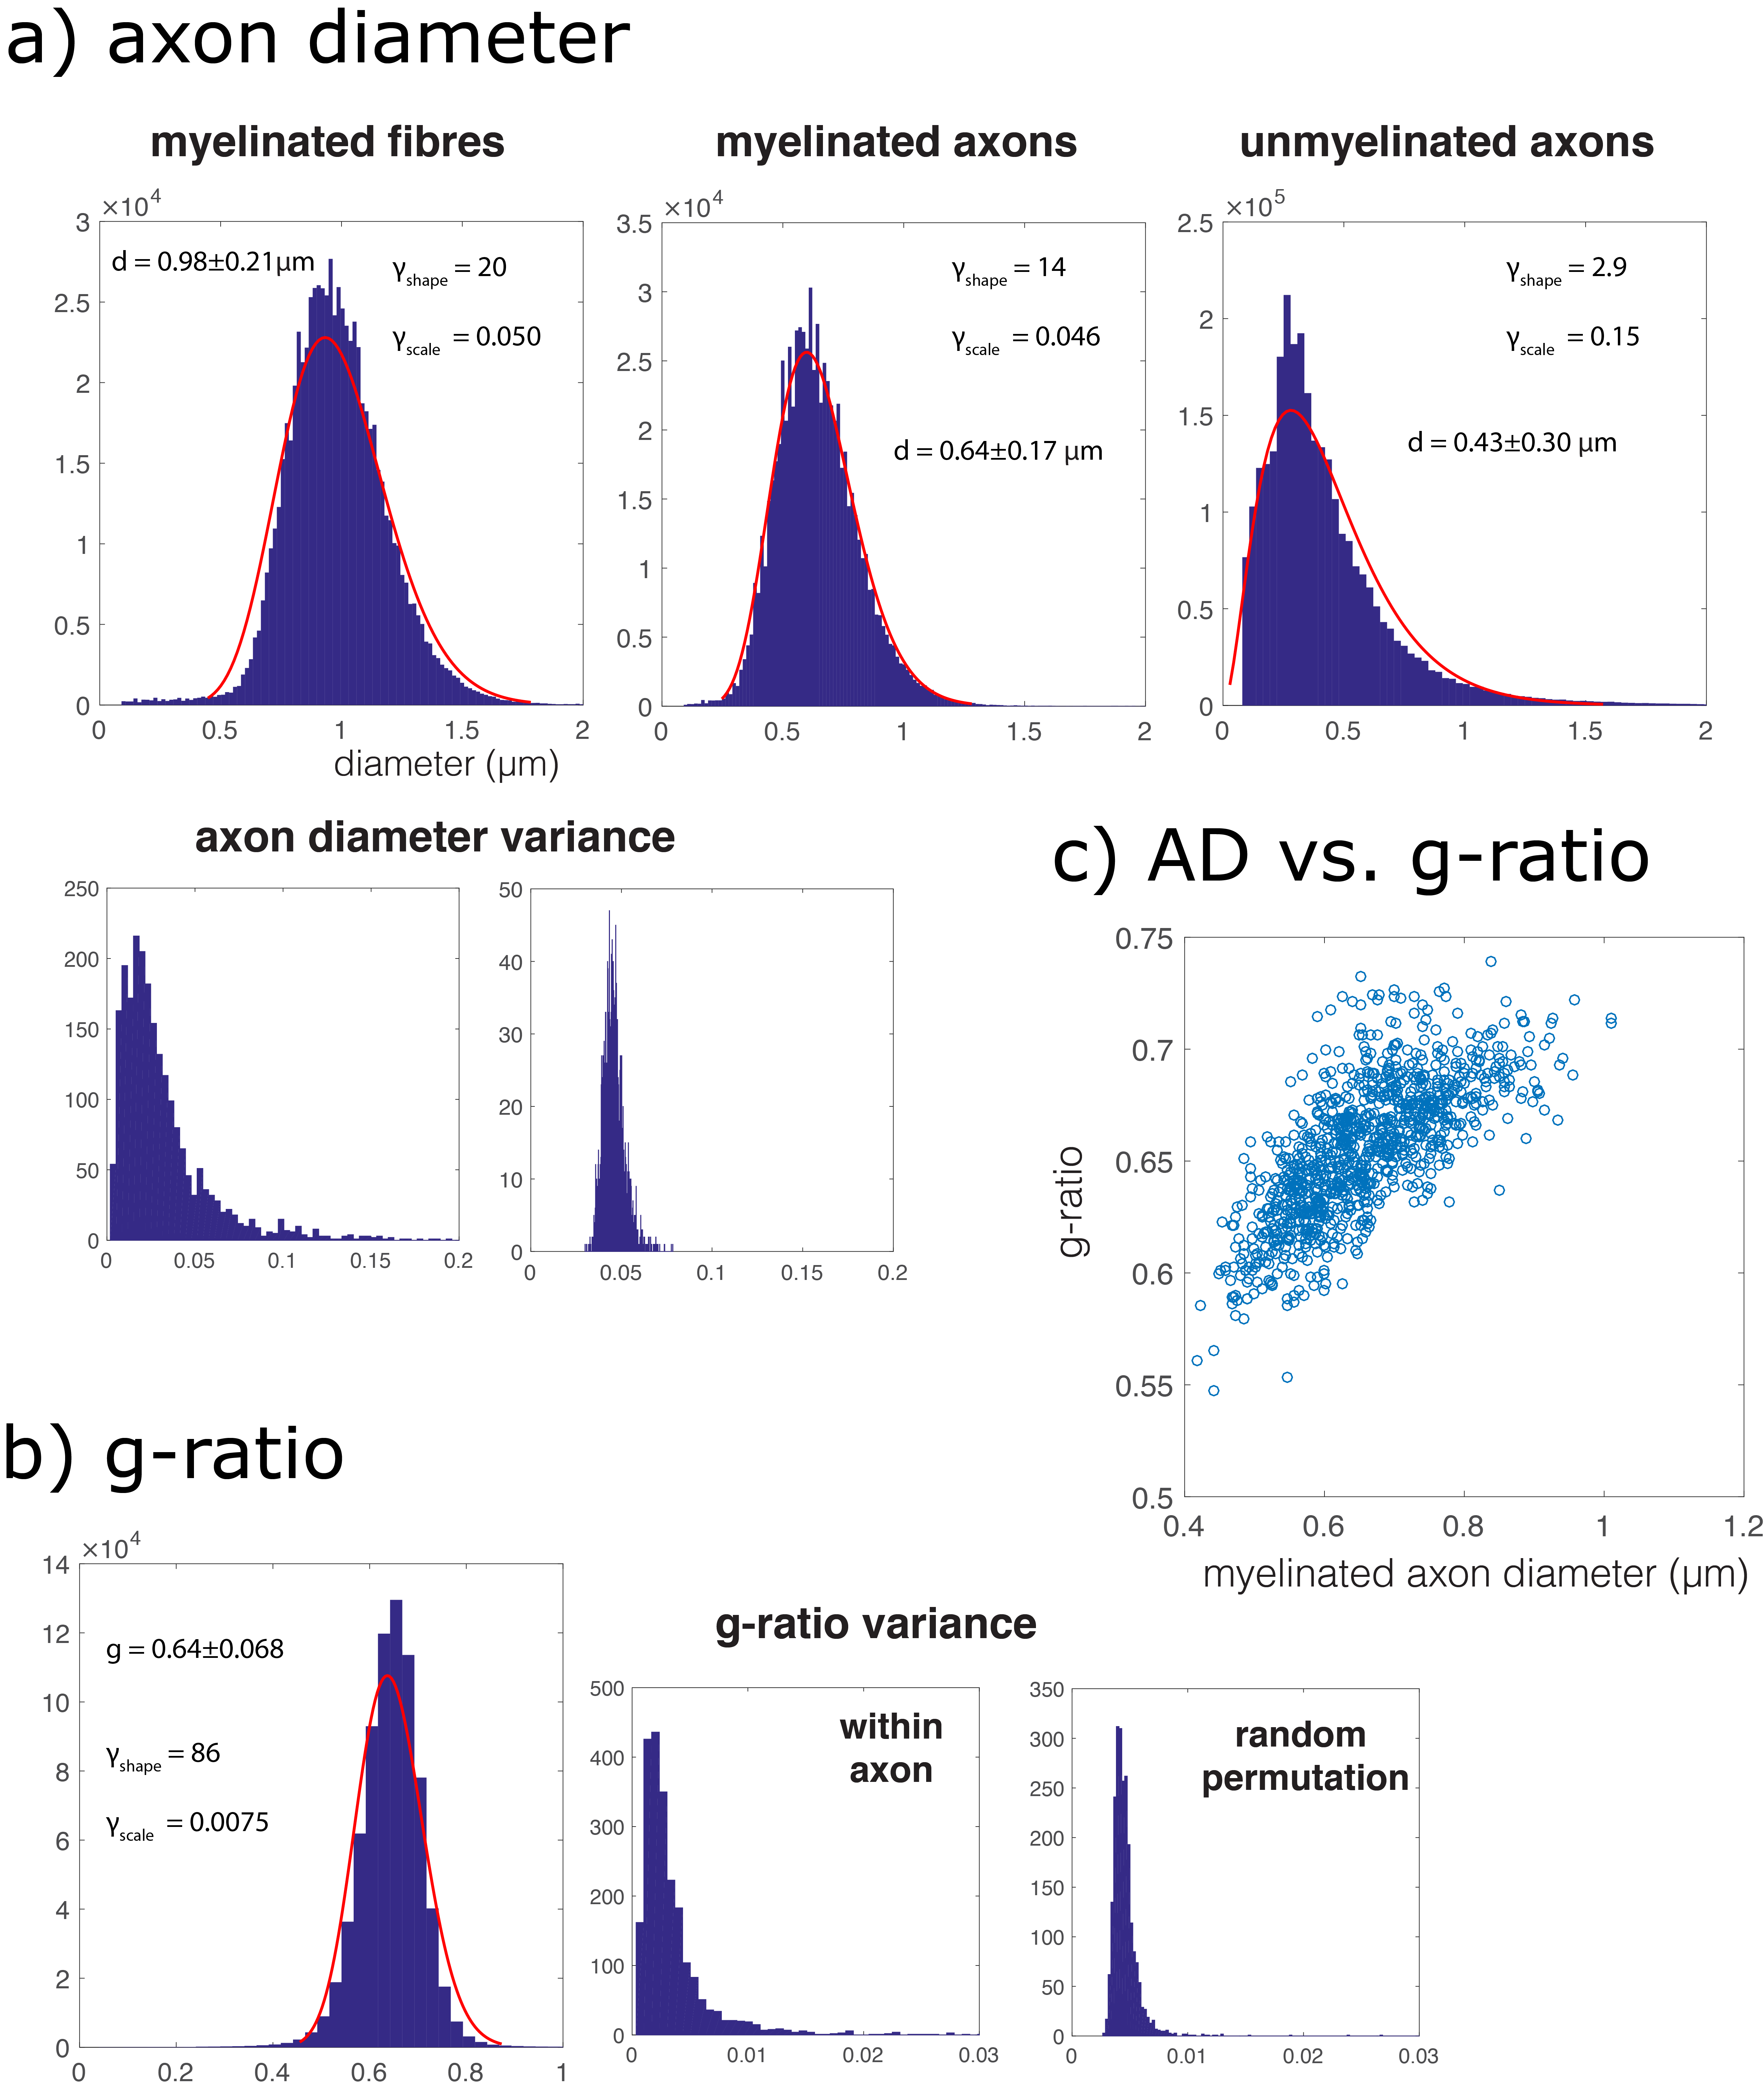
Myelinated axons and myelinsheaths were sufficiently large to be reliably segmented at an isotropic resolution of 50 nm (Figure 2), greatly facilitating computation and manual editing/proofreading speed (estimated ~1 week for the present dataset). Myelin sheaths are accurately separated where the geometry is simple, but in locations where oligodendrocyte processes form loops the automated segmentation fails. The machine learning method of neuron classification has residual errors were cellular processes are erroneously split or merged. However, it is sufficient for our purpose, as it does capture the structure and compartment size of the tissue. A summary of tissue properties derived from the segmentation is provided in Table 1 and Figure 3. The volume of 67505 μm3 contained 2280 myelinated axon segments, 27778 unmyelinated processes, (parts of) 10 cell bodies and 1 blood vessel. The average g-ratio was lower than expected. The within-axon variance of axon diameter was found to be larger than the between-axon variance. A near-linear correlation was observed between the g-ratio and axon diameter.Discussion and conclusion
We have developed a method for segmenting large 3D electron microscopy datasets of the white matter that requires minimal manual intervention. While most EM segmentation approaches focus on grey matter, we have specifically aimed to provide a method that accurately segments individual myelin sheaths as well as neuronal processes and cell bodies. This paves the way for informative hyper-realistic simulations of diffusion MRI (Figure 5). The approach is general in that it easily allows for incorporation of other compartments, such as mitochondria. The 2D nature of the myelin segmentation has the benefit that nodes of Ranvier (Figure 2) are automatically annotated which opens the possibility to simulate exchange at these locations. The locations where the oligodendrocyte processes form myelin loops in between multiple axons (Figure 2) presents a remaining difficulty, as the myelin loop is not easily assigned to a single axon. Apart from a basis for diffusion MRI simulation, this approach provides informative benchmark statistics of tissue microstructure and a way to robustly quantify subtle changes in myelination.Acknowledgements
No acknowledgement found.References
1. Denk W, Horstmann H. Serial block-face scanning electron microscopy to reconstruct three-dimensional tissue nanostructure. PLoS Biol. 2004;2:e329.
2. Wilke, S.A., Antonios, J.K., Bushong, E.A., Badkoobehi, A., Malek, E., Hwang, M., Terada, M., Ellisman, M.H. and Ghosh, A., 2013. Deconstructing complexity: serial block-face electron microscopic analysis of the hippocampal mossy fiber synapse. The Journal of Neuroscience, 33(2), pp.507-522.
3. Sommer C, Strähle C, Köthe U, Hamprecht FA. ilastik: Interactive Learning and Segmentation Toolkit. Eighth IEEE International Symposium on Biomedical Imaging (ISBI) Proceedings 2011; 230-233.
4. Parag T, Chakraborty A, Plaza S, Scheffer L. A Context-Aware Delayed Agglomeration Framework for Electron Microscopy Segmentation. PLoS ONE 2015; 10(5): e0125825.
5. West KL, Kelm ND, Carson RP, Does MD. Quantitative analysis of mouse corpus callosum from electron microscopy images. Data in Brief. 2015;5:124-128.
6. Stikov N, Campbell JSW, Stroh T, et al. In vivo histology of the myelin g-ratio with magnetic resonance imaging. Neuroimage 2015;118:397–405.
Figures