1089
Diffusion anisotropy in breast cancer tissue corresponds to spatial patterns of collagen alignment from structure tensor analysis of histology1Centre for Medical Image Computing, University College London, London, United Kingdom, 2Institute of Neurology, University College London, London, United Kingdom, 3Centre for Advianced Biomedical Imaging, University College London, London, United Kingdom, 4Imaging, Francis Crick Insitute, London, United Kingdom, 5Breast Research Pathology, King's College London and Guy's Hospital, London, United Kingdom
Synopsis
Directional and anisotropy measures from a diffusion model composed of VERDICT compartments were compared with directional and anisotropy measures from structure tensor analysis of registered histology images. A significant positive correlation was found between the direction of the Zeppelin component of the diffusion model (assumed to represent the extracellular space) and the predominant direction of the structure tensor from the stroma, where the primary feature is aligned collagen. The correlation of anisotropy measures was weak, which may be due to difficulties in detecting alignment in regions with densely-packed collagen, which have nearly uniform intensity on H&E staining.
Purpose
Diffusion tensor imaging results in breast have been conflicting1–3 and the source of potential anisotropy is unknown. Some4 suggest a relationship to the breast ducts, while preclinical and ex vivo studies suggest an association with the stroma5 and collagen/hypoxia6. We hypothesize that the diffusion orientations will reflect those derived from structure tensor (ST) analysis of histology and clarify the origin of diffusion anisotropy in breast. This study examined ex vivo breast tissue using a model of tissue microstructure based on VERDICT MRI9 and quantitatively compared diffusion orientations with ST from histology.Methods
MR acquisition and fitting
Seven formalin-fixed tissue samples containing invasive breast cancers were rehydrated with saline and scanned at 9.4 T (Varian Inc). The protocol10 consisted of 42 diffusion-weighted images (0.25 x 0.25 x 0.5 mm3, 3 gradient directions + 1 unweighted), bmax=21 960 s/mm2 and gradient separations from 10-80 ms. Two DTIs (42 directions + 6 unweighted), b=1000 and 1500 s/mm2 were also acquired. A fast spin echo (fSE, 0.125 x 0.125 x 0.5 mm3) was acquired for registration. Data were fitted voxelwise to a Zeppelin-Sphere model (cylindrically symmetric tensor + restricted isotropic diffusion)9.
Histology and structure tensor analysis
Three micron slices were cut every 100 µm and stained with H&E. Slides were digitised (Hamamatsu Nanozoomer) at 20x magnification.
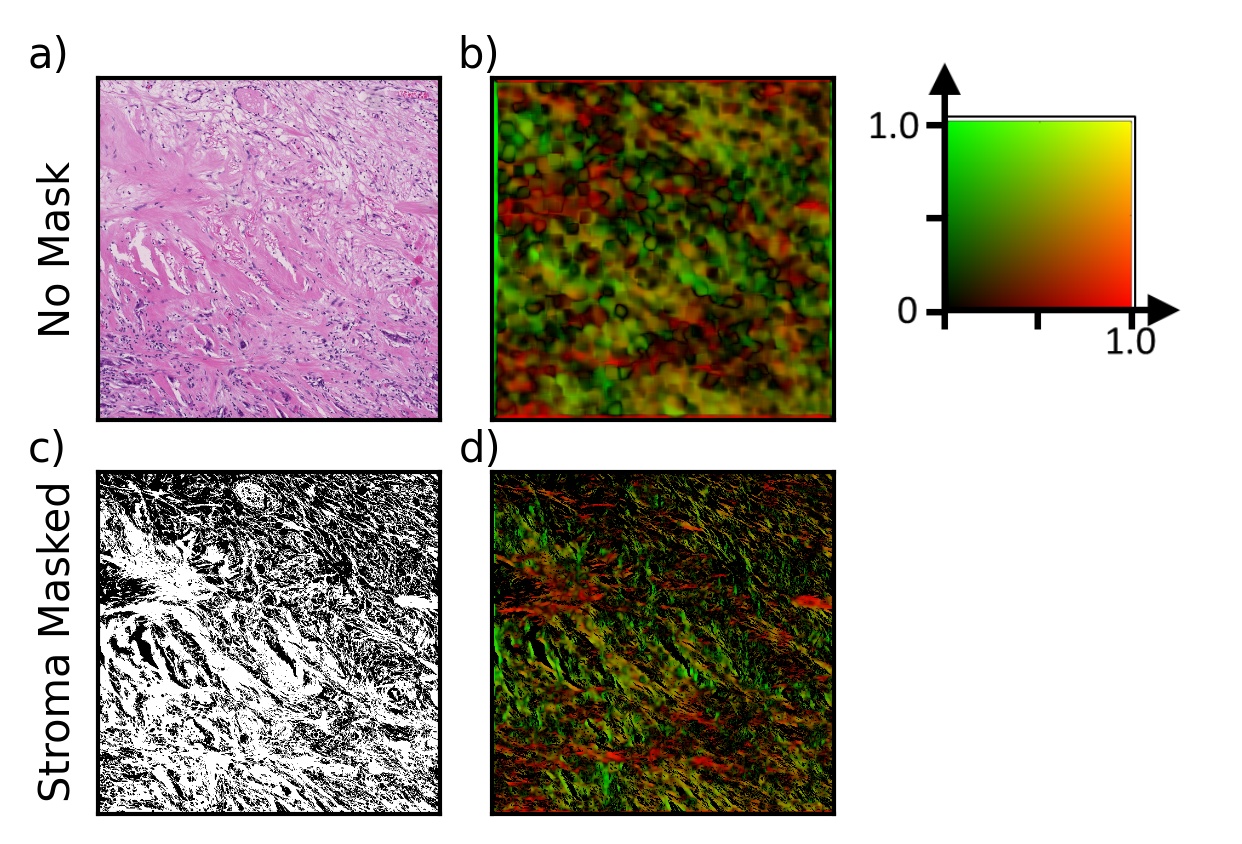
ST analysis was conducted at 5x magnification using the freely available Structure Tensor Toolbox8. The ST describes the local image-texture orientation by convolving the image with a 2D Gaussian weighting function over a neighbourhood7,8. The Gaussian full width at half maximum used was 15 µm, approximately the distance a water molecule is expected to diffuse over a 30 ms experiment. Analysis was restricted to the extracellular space by a mask of the stroma obtained via k-means clustering.
An anisotropy index was calculated using the eigenvalues λ1≥λ2 of the structure tensor: $$$AI=\frac{\lambda_1-\lambda_2}{\lambda_1+\lambda_2}$$$. The eigenvector of λ2 gives the dominant direction.
Image registration and correlation
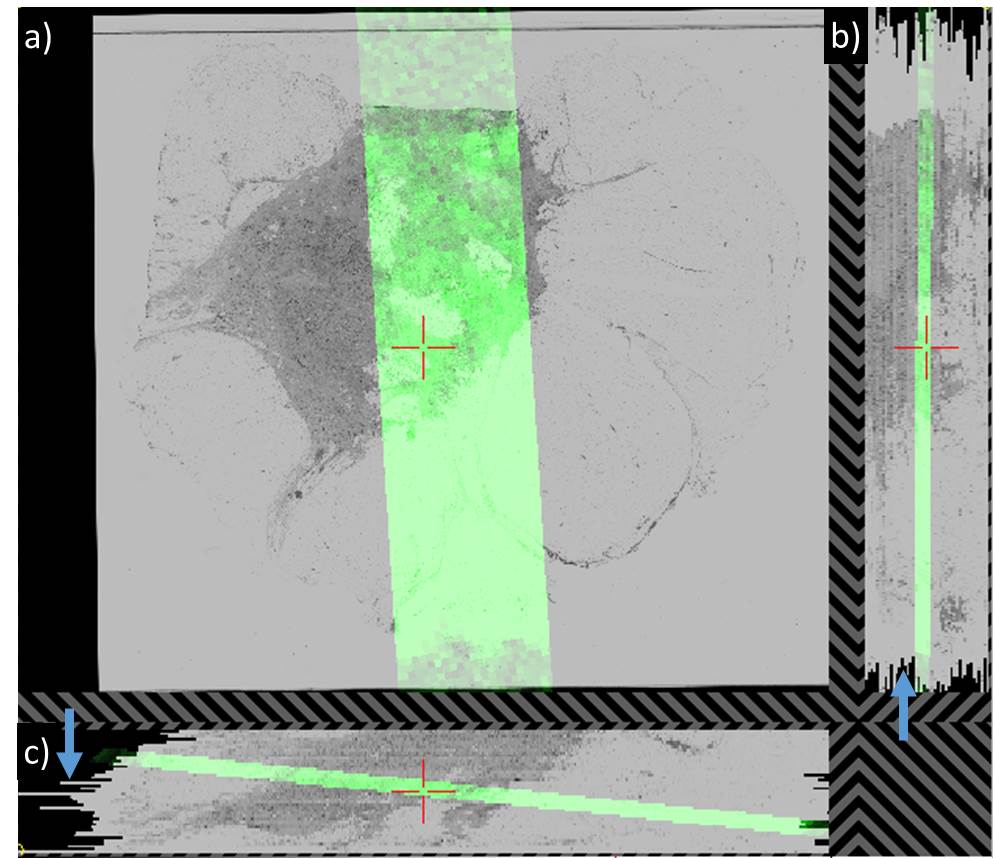
Adjacent slices were stacked at 100 µm intervals into a 3D volume using 2D pairwise rigid registration with a block-matching strategy11,12 and correlation coefficient as similarity measure. The 3D stack was registered to the fSE volume using an intensity-based affine registration from ITK13 with normalized mutual information as similarity metric. The resulting transformation was applied to the diffusion parametric maps and directional vectors.
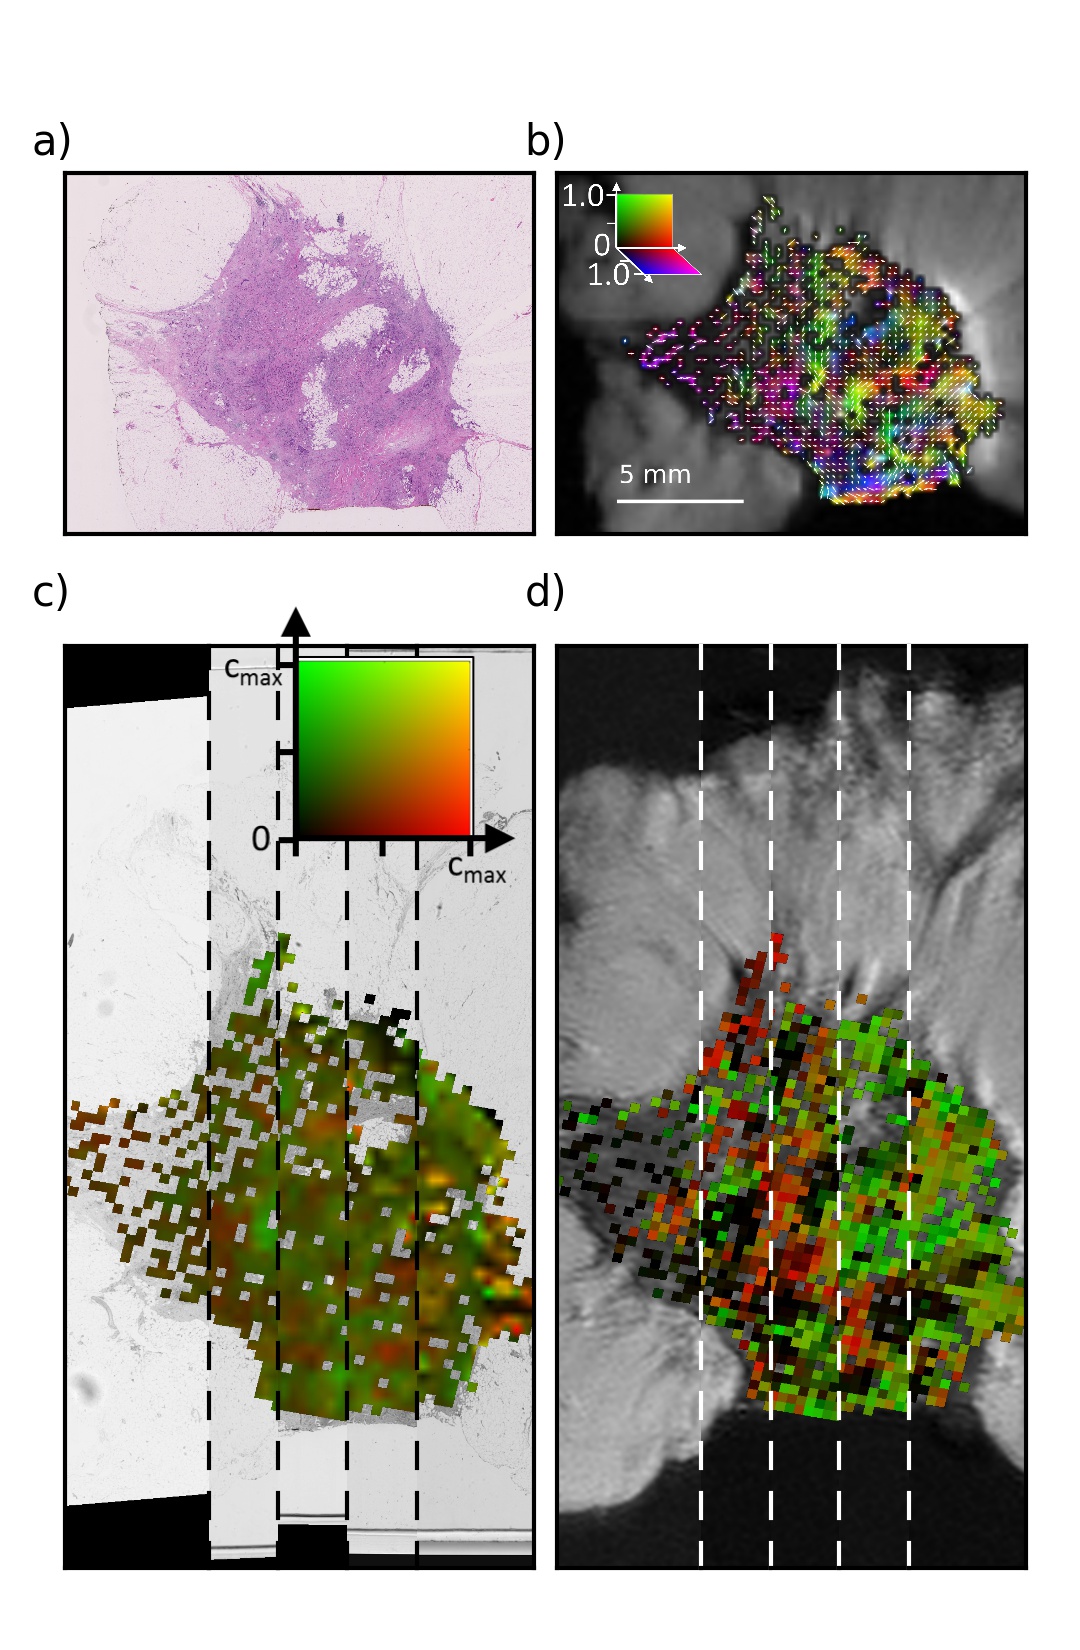
ST results were downsampled to the MRI resolution, normalizing AI by stromal area to reflect extracellular anisotropy. The Zeppelin component of the diffusion model was assumed to represent the extracellular space. The 3D MRI vectors were projected into the 2D histological plane (from registration) for comparison.
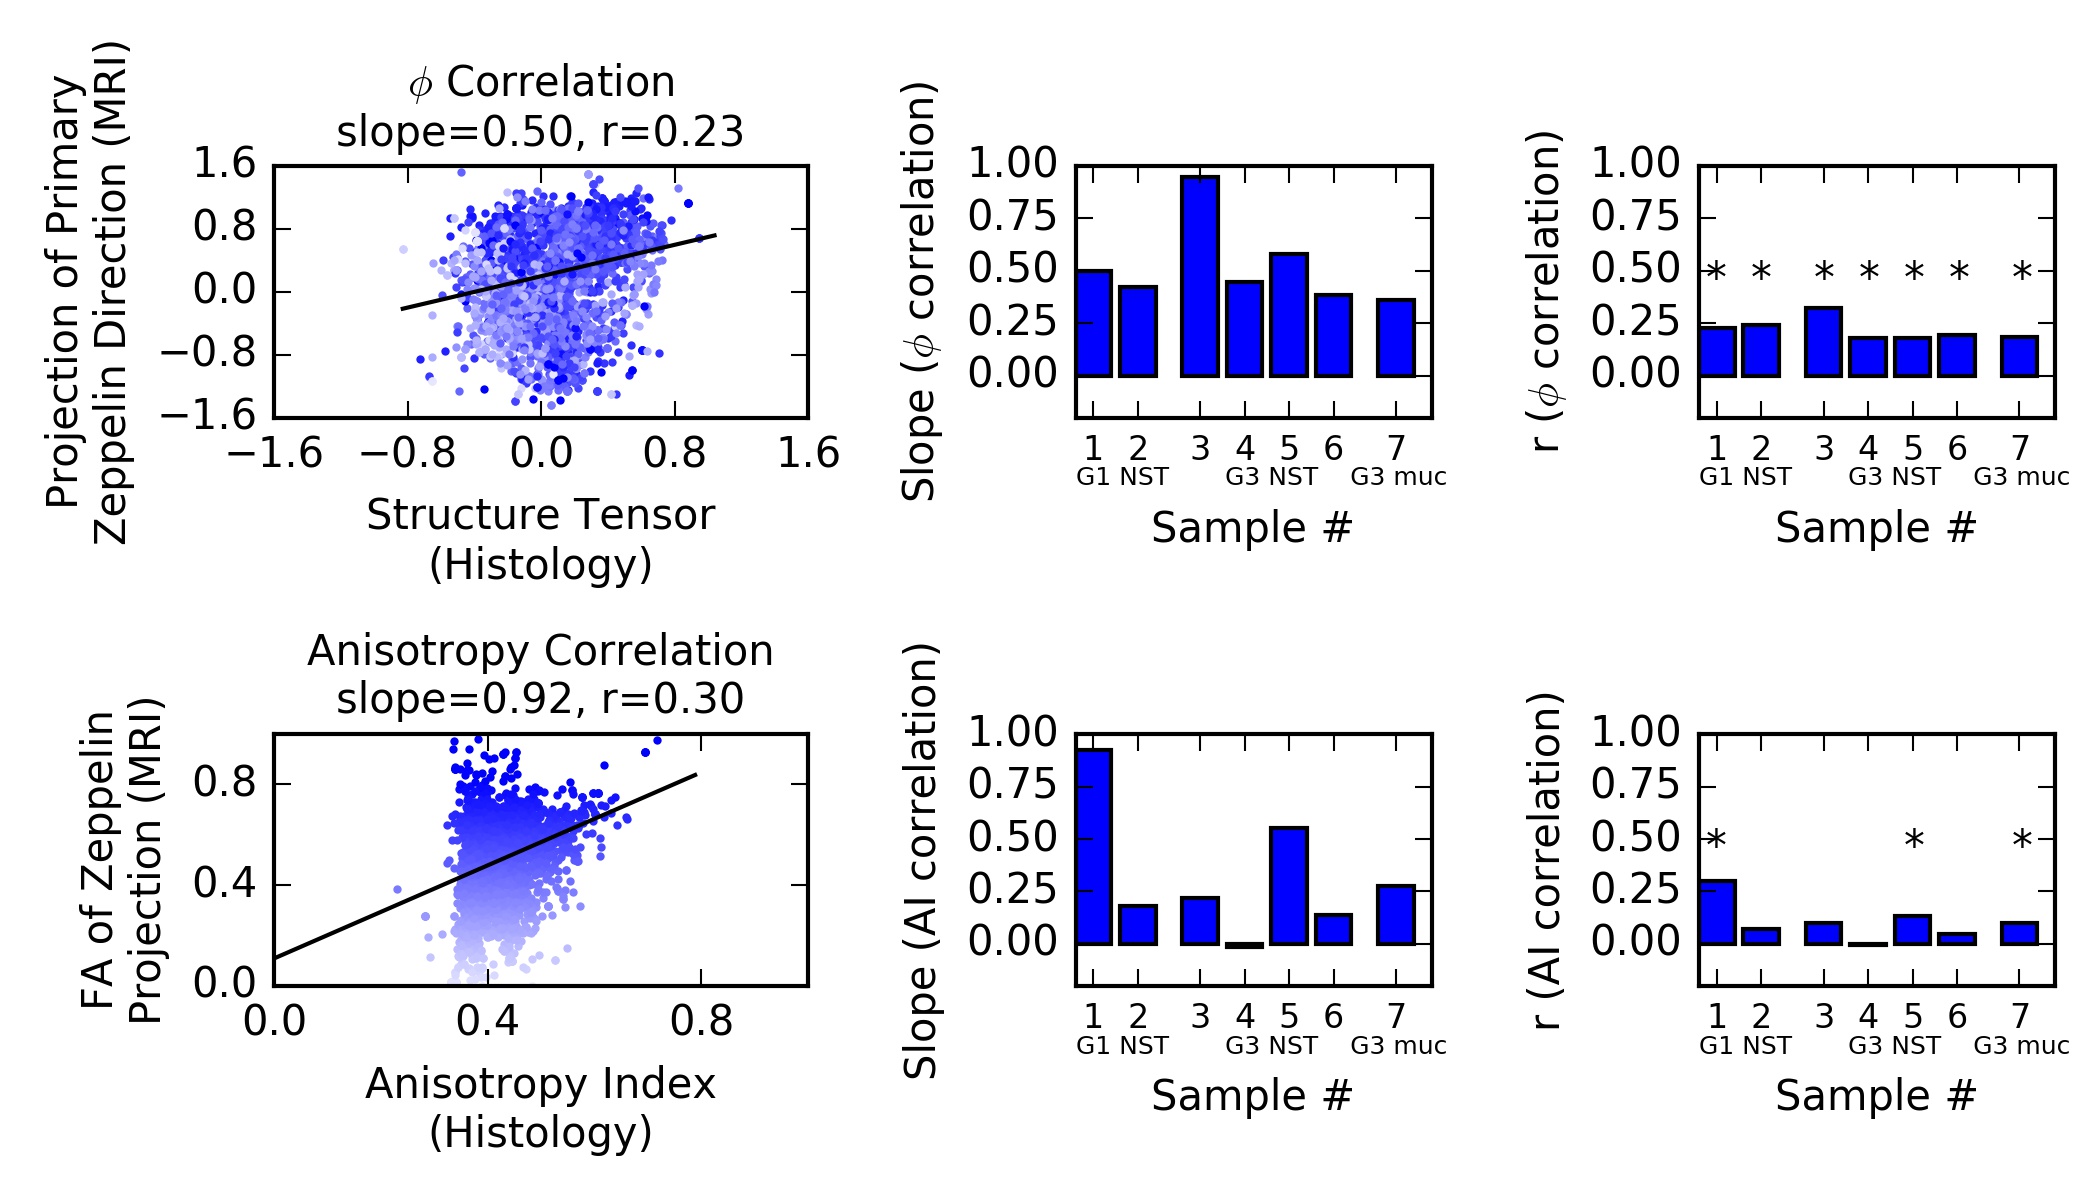
Direction of the Zeppelin projection (φ) and fractional anisotropy (FA) were compared to ST direction and AI, averaging over a 5x5 window around each pixel. Pearson correlation coefficients were calculated, weighting the direction regression by the FA from MRI to limit the influence of nearly isotropic pixels with uncertain directions.
Results and Discussion
Figure 1 shows the registration.
Figure 2 demonstrates the results of the structure tensor analysis.
Registered sections of the ST and diffusion directional analysis are shown in Figure 3 for one sample.
Figure 4 depicts the correlations between MRI and histology for both the direction and anisotropy measures. There is a significant positive correlation between the dominant directions directions of MRI and ST. The correlation plots demonstrate quite large variance. This is likely due to errors in the registration, which affect both the pixel locations for comparison and the pixel value φ, calculated when the transformation is applied to the diffusion vectors.
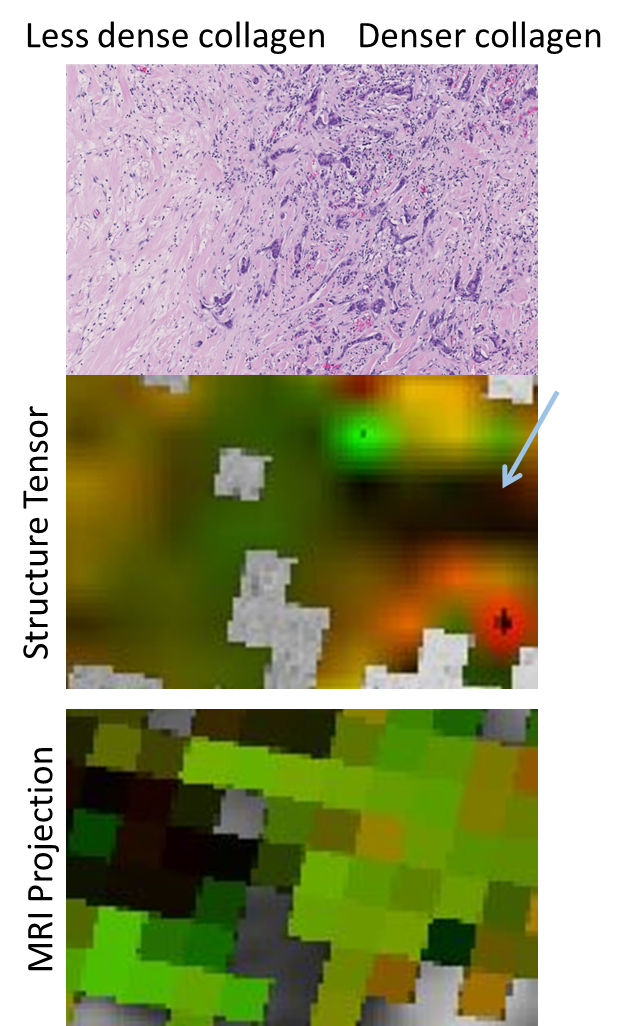
The anisotropy correlation is weaker. This may be due to difficulties capturing orientation of dense collagen (Figure 5). Tightly packed collagen demonstrates less intensity variation in the histology images, producing AI estimates that may be low even when collagen anisotropy is high (visible as the spread in AI as FA increases in the bottom left plot of Figure 4). Additionally, AI measures the gradient in the stroma, where the dominant feature is collagen orientation, while FA measures the hindrance of water, which may result from structures other than collagen.
Conclusion
Structure tensor analysis on histological images was compared to directional and anisotropy parameters from a VERDICT model in ex vivo breast tissue. The primary diffusion direction of the anisotropic MRI compartment has a significant positive correlation with the primary direction from ST in the stroma. This is evidence of diffusion anisotropy even in the absence of ductal structures. If this is confirmed in more samples, high-resolution VERDICT measurements may provide a method of detecting collagen realignment, a valuable biomarker for hypoxia5 and tumour progression14.Acknowledgements
This work was supported by funding from MIMIC (EP/K020439/1), the VPH-PRISM EU project (FP7-ICT-2011-9, 601040), the CRUK-EPSRC Cancer Imaging Centre at KCL/UCL, Horizon2020-EU.3.1 CDS-QUAMRI (ref: 634541) and by EPSRC fellowship EP/N021967/1.References
1. Eyal, E. et al. Parametric diffusion tensor imaging of the breast. Invest. Radiol. 47, 284–91 (2012).
2. Partridge, S. C. et al. Diffusion tensor MRI: preliminary anisotropy measures and mapping of breast tumors. J. Magn. Reson. Imaging 31, 339–47 (2010).
3. Tsougos, I. et al. The contribution of diffusion tensor imaging and magnetic resonance spectroscopy for the differentiation of breast lesions at 3T. Acta Radiol. 55, 14–23 (2014).
4. Furman-Haran, E., Grobgeld, D., Nissan, N., Shapiro-Feinberg, M. & Degani, H. Can diffusion tensor anisotropy indices assist in breast cancer detection? J. Magn. Reson. Imaging 1–9 (2016).
5. Norddin, N. et al. Microscopic diffusion properties of fixed breast tissue: Preliminary findings. Magn. Reson. Med. 74, 1733–1739 (2015).
6. Kakkad, S. et al. Collagen fibers mediate MRI-detected water diffusion and anisotropy in breast cancers. Neoplasia 18, 585–593 (2016).
7. Bigun, J. & Granlund, G. H. Optimal Orientation Detection of Linear Symmetry. Proc. IEEE First Int. Conf. Comput. Vis. 54, 433–438 (1987).
8. Grussu, F. et al. A framework for optimal whole-sample histological quantification of neurite orientation dispersion in the human spinal cord. J. Neurosci. Methods 273, 20–32 (2016).
9. Panagiotaki, E. et al. Noninvasive quantification of solid tumor microstructure using VERDICT MRI. Cancer Res. 74, 1902–1912 (2014).
10. Bailey, C. et al. Modelling vasculature and cellular restriction in breast tumours using diffusion MRI. in Proc. Intl. Soc. Mag. Reson. Med. 23 1082 (2015).
11. Mertzanidou, T. et al. in Breast Imaging: 12th International Workshop, IWDM 2014, Gifu City, Japan. Proceedings. 674–680
12. Ourselin, S., Roche, A., Subsol, G., Pennec, X. & Ayache, N. Reconstructing a 3D structure from serial histological sections. Image Vis. Comput. 19, 25–31 (2001).
13. Yoo, T. S. et al. Engineering and algorithm design for an image processing API: a technical report on ITK--the Insight Toolkit. Stud. Health Technol. Inform. 85, 586–92 (2002).
14. Conklin, M. W. & Keely, P. J. Why the stroma matters in breast cancer: insights into breast cancer patient outcomes through the examination of stromal biomarkers. Cell Adh. Migr. 6, 249–60 (2012).
Figures