1088
Diffusion MRI of axonal degeneration in areas of fiber crossing: Histological correspondence.1Institute of Neurobiology, Universidad Nacional Autonoma de Mexico, Queretaro, Mexico, 2Computer Science, Centro de Investigación en Matemáticas, Guanajuato, Mexico
Synopsis
The tensor model has been widely used to infer characteristics of white matter through diffusion MRI. Unfortunately, this model does not provide reliable information about crossing fiber regions. Several models have been proposed that seem to overcome the limitations of the tensor. However, biological interpretations of such models are limited by the lack of histological conformation. Using an animal model of axonal degeneration, we compare histology to data derived from two approaches (CSD and multi-tensor), in an effort to provide validation of metrics that can bring substantial and clinically useful information about crossing fiber regions.
Background
Diffusion-weighted magnetic resonance imaging (dMRI) is extensively used to study white matter microstructure.1,2 The tensor model3 has provided an intuitive mechanism to query specific aspects of tissue micro-architecture (e.g., axonal density, myelin content).4–7 A major shortcoming of said model is its assumption of a single fiber population within a voxel, which is incorrect in the majority of human white matter.8 Alternatives to the tensor model are capable, in theory, to overcome this problem.9,10 Advanced dMRI models provide information in regions of crossing fibers that corresponds well to quantitative histology.11 However, it is often crucial to provide microstructural information of each fiber system in a crossing region. Available methods lack histological validation, which is explored herein for constrained spherical deconvolution (CSD)12 and a multi-tensor model.13Methods
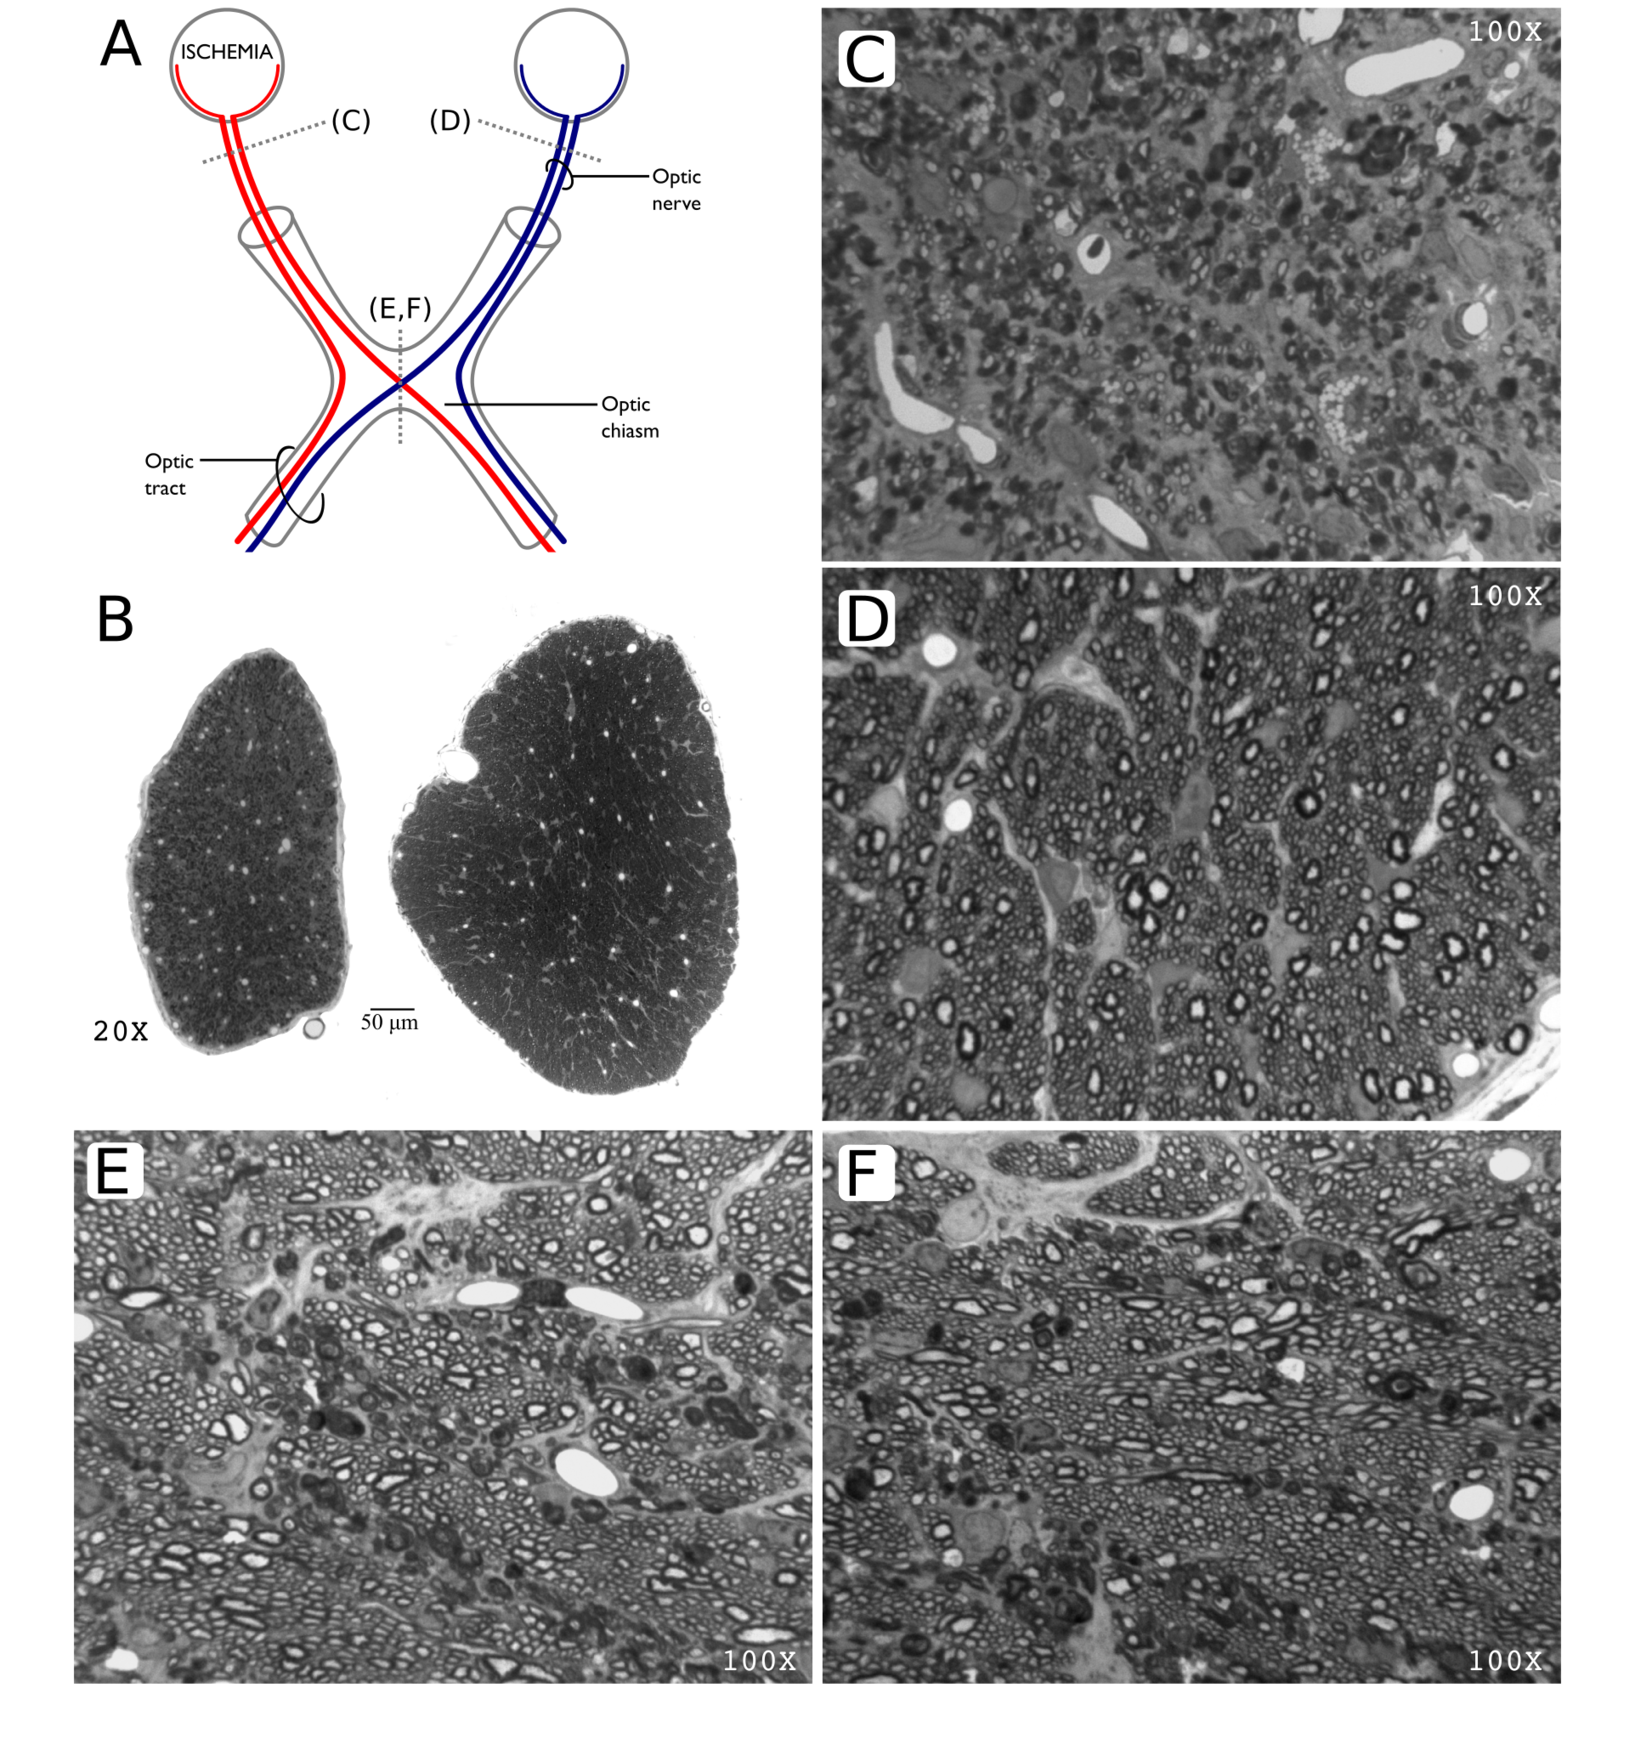
Animal preparation: We used a model of axonal degeneration through retinal ischemia.6,14 Analysis of the optic chiasm allows for the evaluation crossing fibers, as axons from the nasal hemi-retina in each eye cross the midline at this level. Thus, unilateral retinal ischemia results in degeneration of half of the axons in the chiasm. Six adult rats were studied. Retinal ischemia was induced through cannulation of the anterior chamber of one eye and intraocular pressure was elevated to 120 mmHg and maintained for 20 minutes in one animal (Rat A) and 90 minutes in the other five. Animals were sacrificed five weeks after treatment, and intracardially perfused with PFA and glutaraldehyde doped with Gadolinium (0.2 mM). Brains were carefully extracted with the optic nerves intact and placed in a vial filled with perfluoropolyether oil. Imaging: Brains were scanned at 21 °C using a 7 T Bruker Pharmascan 70/16 with 720 mT/m maximum gradient amplitude and a 2⨯2 array surface coil. Following B0 shimming, dMRI were acquired with 125⨯125⨯125 mm3 resolution. We acquired dMRI in 80 directions, each with a b value of 2000 and 2500 s/mm2. (δ/Δ=3.1/10 ms), and 10 non-diffusion weighted images, using a segmented 3D echo-planar acquisition. TR/TE=250/21 ms; NEX=1. Total scanning time: 15 hours. Histology: After scanning, rat A (20 min ischemia), and rat B (90 min ischemia) were processed for histology, and 1 mm-thick sections at the level of the optic nerves and chiasm were stained with toluidine blue. dMRI processing: Images were denoised15,16 and corrected for bias field inhomogeneities and eddy current distortions. CSD with maximum harmonic order of 6 was performed on the b=2500 s/mm2 images following iterative estimation of the single fiber response function.17 Lobes of the fiber orientation distribution functions (fODF) were segmented to obtain fiber-specific metrics i.e., fixel-based analysis.18–20 To quantify the degeneration using the well-known tensor metrics at multi-fiber voxels, we first compute the number and orientations of the axon packs with a multi-resolution discrete search method (MRDS),13 then the axial/radial diffusivities (λ|, λ⟂) and compartment sizes are computed independently per bundle with Levenberg-Marquardt non-linear optimization. The new estimated diffusivities are used in the MRDS framework to re-compute accurate orientations. The two stages are iterated until convergence. The number of tensors per voxel is computed by F-Test. Bundles were clustered into "normal" and "affected" based on their crossing orientation (using k-means).Results and Discussion
Histology showed a dramatic reduction in the number of axons in the optic nerve of the affected eye in rat B (90 min ischemia; Figure 1), but not rat A (20 min ischemia, not shown), in line with previous reports showing that optic nerve degeneration only occurs after prolonged ischemia.14 The degenerated nerve of rat B was atrophied and showed few normal axons, the majority of which were collapsed. The optic chiasm of rat B showed healthy axons interdigitated with degenerated axons similar to those in the affected nerve. Compared to the non-lesioned rat (Figure 2), CSD showed clear degeneration of the affected optic nerve through small and wide FODs resulting in reduced apparent fiber density and increased dispersion (Figure 3). Using a 25-voxel ROI at the center of each chiasm, we found fewer voxels (11±6) containing more than a single fiber population in the chiasms of rats with 90 min ischemia, as compared to rat A (22). Complexity of the affected chiasms was reduced (0.17±0.14) as compared to rat A (0.61) (Table 1). Figure 4 demonstrates how the multi-tensor model captures axonal degeneration in the optic nerves and chiasm, showing clear changes in FA and radial diffusivity with respect to healthy tissue. Diffusivity profiles explain most of the tissue damage, as compartment sizes/fraction per bundle were similar for damaged and affected nerves (both around 0.5, not shown).Acknowledgements
We thank Juan Ortiz for technical assistance for MRI scanning, Gema Martínez-Cabrera for assistance with histology. LC was partially funded by PAPIIT/DGAPA (IG200117). ARM and JLM were partially supported by SNI-CONACYT, Mexico, (Grants 169338 and 6243). GRV and RCL were supported by scholarships from CONACYT, Mexico.References
1. Concha L. A macroscopic view of microstructure: Using diffusion-weighted images to infer damage, repair, and plasticity of white matter. Neuroscience. 2014;276:14–28.
2. Assaf Y, Pasternak O. Diffusion Tensor Imaging (DTI)-based White Matter Mapping in Brain Research: A Review. J. Mol. Neurosci. 2008;34(1):51–61.
3. Basser PJ, Mattiello J, LeBihan D. MR diffusion tensor spectroscopy and imaging. Biophys. J. 1994;66(1):259–67.
4. Beaulieu C. The basis of anisotropic water diffusion in the nervous system - a technical review. NMR Biomed. 2002;15(7–8):435–55.
5. Concha L, Livy DJ, Beaulieu C, Wheatley BM, Gross DW. In Vivo Diffusion Tensor Imaging and Histopathology of the Fimbria-Fornix in Temporal Lobe Epilepsy. J Neurosci. 2010;30(3):996–1002.
6. Song SK, Sun SW, Ju WK, et al. Diffusion tensor imaging detects and differentiates axon and myelin degeneration in mouse optic nerve after retinal ischemia. Neuroimage. 2003;20(3):1714–22.
7. Budde MD, Kim JH, Liang H-F, et al. Toward accurate diagnosis of white matter pathology using di?usion tensor imaging. Magn Reson Med. 2007;57(4):688-695.
8. Jeurissen B, Leemans A, Tournier J-D, Jones DK, Sijbers J. Investigating the prevalence of complex fiber configurations in white matter tissue with diffusion magnetic resonance imaging. Hum. Brain Mapp. 2013;34(11):2747–66.
9. Tournier J-D, Mori S, Leemans A. Diffusion tensor imaging and beyond. Magn. Reson. Med. 2011;65(6):1532–1556.
10. Daducci A, Canales-Rodriguez EJ, Descoteaux M, et al. Quantitative Comparison of Reconstruction Methods for Intra-Voxel Fiber Recovery From Diffusion MRI. IEEE Trans. Med. Imaging. 2014;33(2):384–399.
11. Budde MD, Annese J. Quantification of anisotropy and fiber orientation in human brain histological sections. Front. Integr. Neurosci. 2013;7:3.
12. Tournier JD, Calamante F, Gadian DG, Connelly A. Direct estimation of the ?ber orientation density function from di?usion-weighted MRI data using spherical deconvolution. Neuroimage. 2004;23(3):1176?85.
13. Coronado-Leija R, Ramírez-Manzanares A, Marroquín JL, Biscay R-J. Accurate Multi-resolution Discrete Search Method to Estimate the Number and Directions of Axon Packs from DWMRI. Int. Soc. Magn. Reson. Med. 2015;565.
14. Adachi M, Takahashi K, Nishikawa M, Miki H, Uyama M. High intraocular pressure-induced ischemia and reperfusion injury in the optic nerve and retina in rats. Graefes Arch. Clin. Exp. Ophthalmol. Albrecht Von Graefes Arch. Für Klin. Exp. Ophthalmol. 1996;234(7):445–451.
15. Veraart J, Novikov DS, Christiaens D, et al. Denoising of diffusion MRI using random matrix theory. NeuroImage. 2016;S1053-8119(16)30394-9.
16. Manjón JV, Coupé P, Concha L, et al. Diffusion Weighted Image Denoising Using Overcomplete Local PCA. PLoS ONE. 2013;8(9):e73021.
17. Tax CMW, Jeurissen B, Vos SB, Viergever MA, Leemans A. Recursive calibration of the fiber response function for spherical deconvolution of diffusion MRI data. NeuroImage. 2014;86:67–80.
18. Raffelt D, Tournier J-D, Rose S, et al. Apparent Fibre Density: A novel measure for the analysis of diffusion-weighted magnetic resonance images. NeuroImage. 2012;59(4):3976–3994.
19. Dell’Acqua F, Simmons A, Williams SCR, Catani M. Can spherical deconvolution provide more information than fiber orientations? Hindrance modulated orientational anisotropy, a true-tract specific index to characterize white matter diffusion. Hum. Brain Mapp. 2012;34(10):2464-83.
20. Riffert TW, Schreiber J, Anwander A, Knösche TR. Beyond fractional anisotropy: Extraction of bundle-specific structural metrics from crossing fiber models. NeuroImage. 2014;100:176–191.
Figures