1087
Can we detect the effect of spines, leaflets and beads on the diffusion of brain intracellular metabolites? A confrontation between high b-values and high-frequencies diffusion-weighted MRS in the mouse brain in vivo.1Molecular Imaging Research Center (MIRCen), Commissariat à l'Energie Atomique, Fontenay-aux-Roses, France
Synopsis
Prior models used to clarify which aspects of tissue microstructure mostly affect intracellular diffusion and corresponding diffusion-weighted magnetic resonance signal have focused on relatively simple geometrical descriptions of the cellular microenvironment (spheres, randomly oriented cylinders, etc...), neglecting finer morphological details which may have an important role. Neuritis may exhibit beading; some types of neurons present high density of spines; and astrocytes and macroglial cells processes present leaflets, which may all slow impact the diffusion process. Here we use numerical simulations to interpret metabolites diffusion-weighted MRS data in the mouse brain in terms of such fine secondary structures.
Purpose
Prior models used to clarify which aspects of tissue microstructure mostly affect intracellular diffusion and corresponding diffusion-weighted magnetic resonance (DW-MR) signal have focused on relatively simple geometrical descriptions of the cellular microenvironment (spheres, randomly oriented cylinders, etc...)1, neglecting finer morphological details which may have an important role. Neuritis may exhibit beading; some types of neurons present high density of spines; and astrocytes and macroglial cells processes present leaflets, which may all slow impact the diffusion process.
The aim of this study is to use numerical simulations2 to interpret metabolites DW- MR spectroscopy (DW-MRS) data in the mouse brain in terms of such fine secondary structures.
Methods
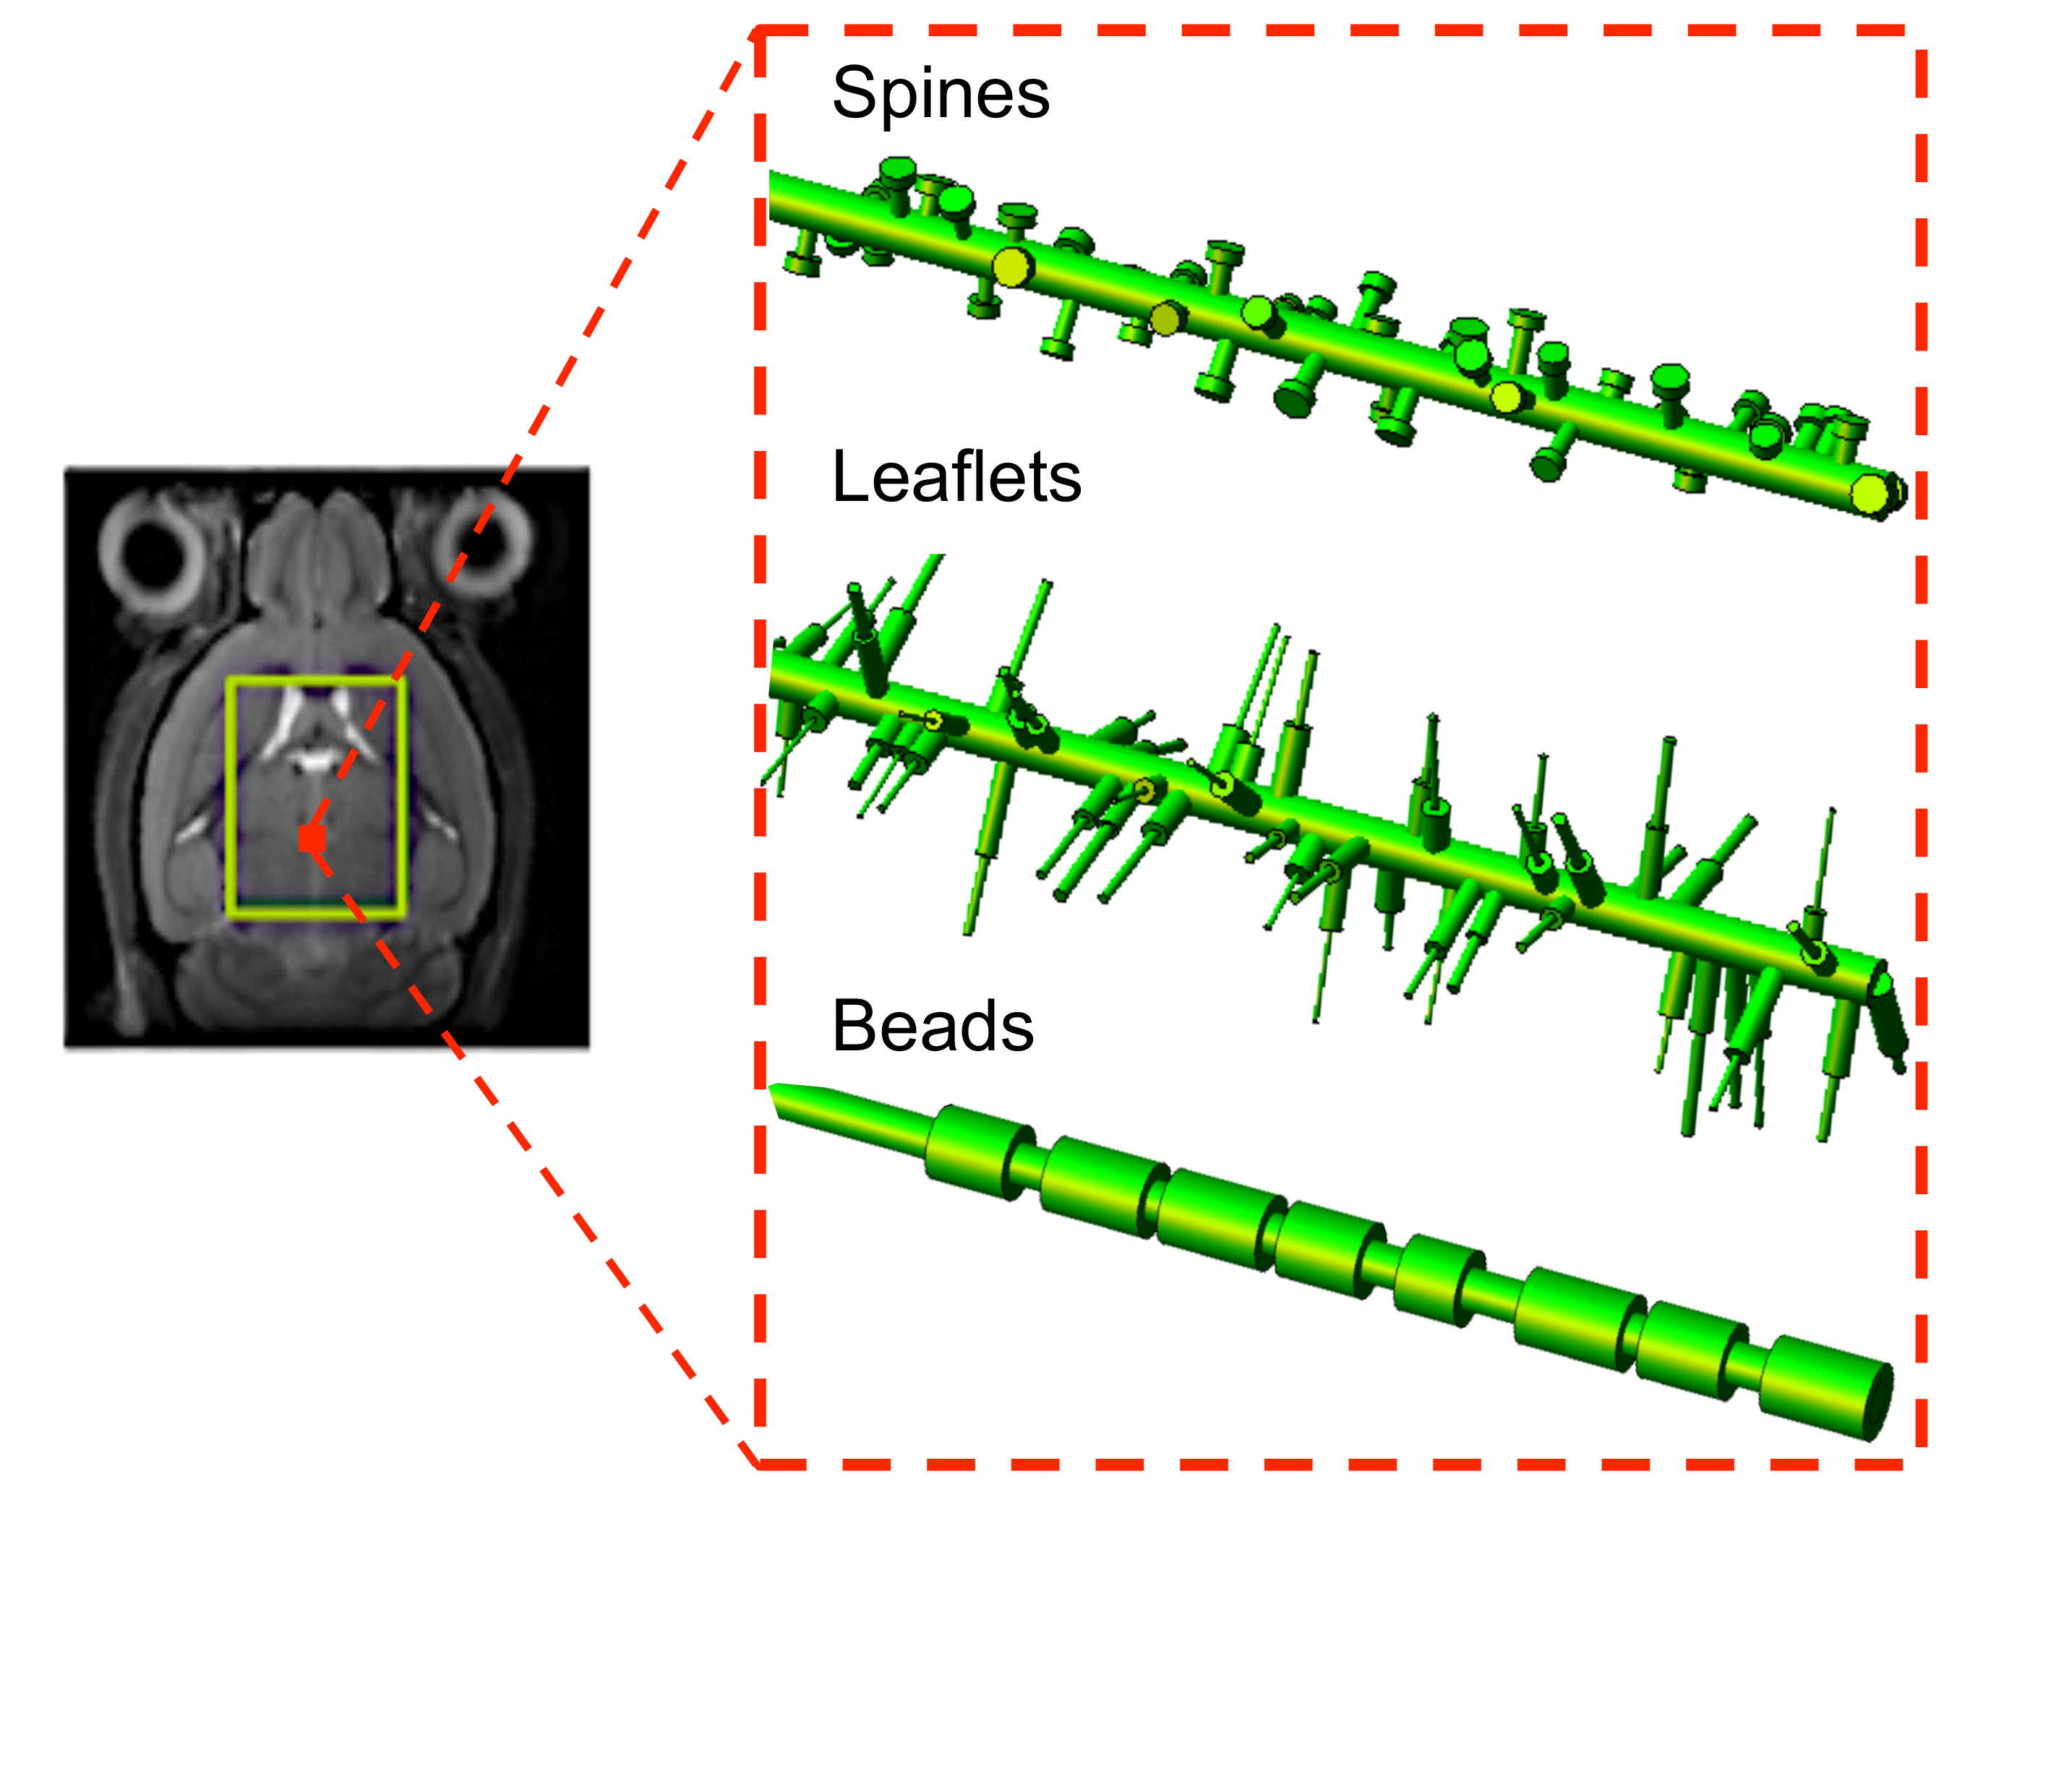
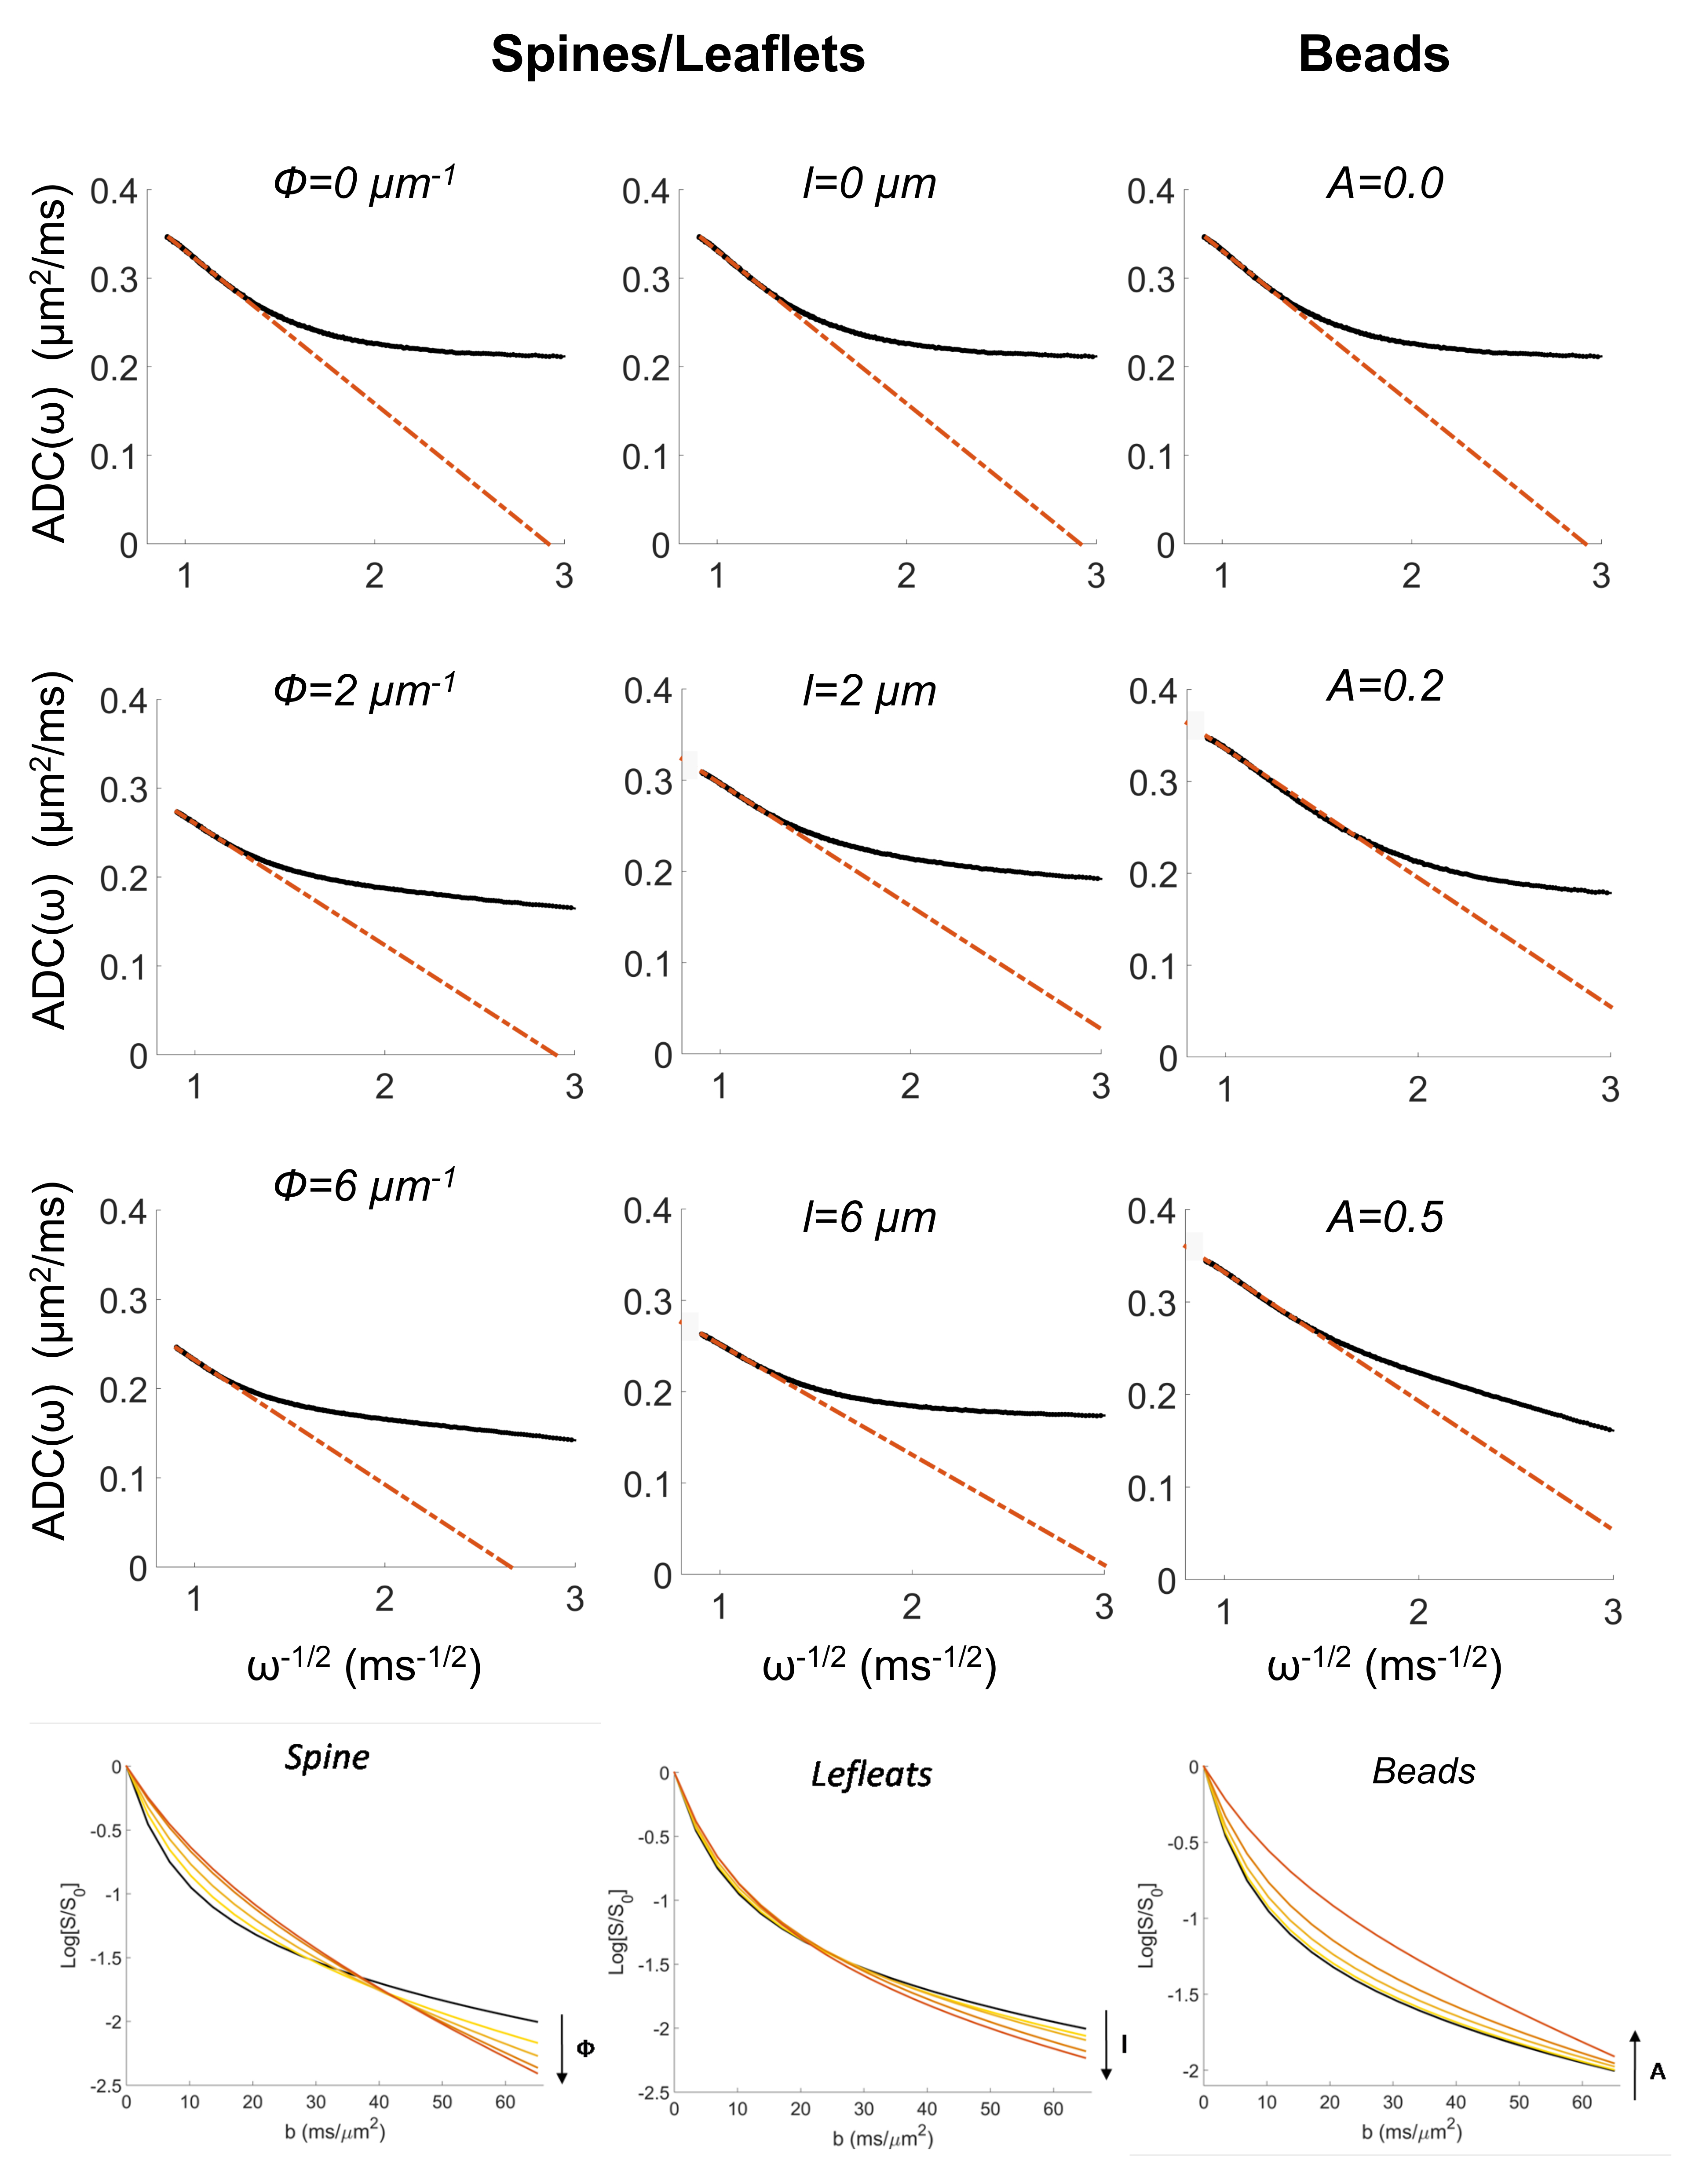
Numerical simulations: numerical simulations are deeply described in2. Briefly, many isotropically oriented cylinders of radius a0=1.0 µm represent branches of neuronal and glial cell processes within the large spectroscopy voxel. Many smaller cylinders are then connected to each branch in random radial directions to represent spines or leaflets, and along the main branch direction to represent beads (Figure1). The sizes and density of these structures were randomly varied within the range of published healthy physiological values3. We investigated the effect of varying spines/leaflets density Ф (0.0-6.0 µm-1) and total length l (0.0-6.0 µm), and varying beading amplitude A (0.0-0.5) on the metabolites diffusion process and corresponding DW-NMR signal. Monte Carlo simulations of diffusion inside each structure (with bulk diffusivity 0.5 µm2/ms) and phase accumulation approach (as further described in4) are used to simulate high b-values pulsed-gradient stimulated echo (PGSTE) and high frequency oscillating-gradients (OG) DW-MRS experiments.
DW-MRS: here we report DW-MRS data as recently published5,6. Briefly, acquisitions were performed in a large voxel of the mouse brain containing mostly gray matter (~80%), using a cryoprobe, at 11.7 T (Figure1). PGSTE experiments5 were performed at TE=33.4 ms and diffusion time 63.2 ms, up to qmax=1 µm-1 (bmax=60 ms/µm2). OG experiments were performed using the sequence described in6 (TE= 60 ms, gradient duration 20 ms for each waveform, b= 1.2 ms/µm²) from which the apparent diffusion coefficient (ADC) was measured up to 252 Hz. Individual scan phasing was performed and experimental macromolecule spectrum was included in the LCModel’s basis set.
Data fitting with analytical models of microstructure: The intracellular space was modeled by a collection of isotropically oriented cylinders. The analytical expression in the short gradient pulse approximation1 was fitted to the PGSTE signal attenuation as a function of b to estimate the intracellular space diffusivity, Dintra, the cylinder radius, a, and the apparent surface-to-volume ratio for cylinders, S/Vapp=2/a. From OG measurements of the ADC frequency dependence it is possible to estimate the apparent S/Vapp of the confining geometries and metabolites bulk diffusivity, D0, without any assumption on the compartment geometry, according to the universal high frequency limit behavior7.
Results and Discussion
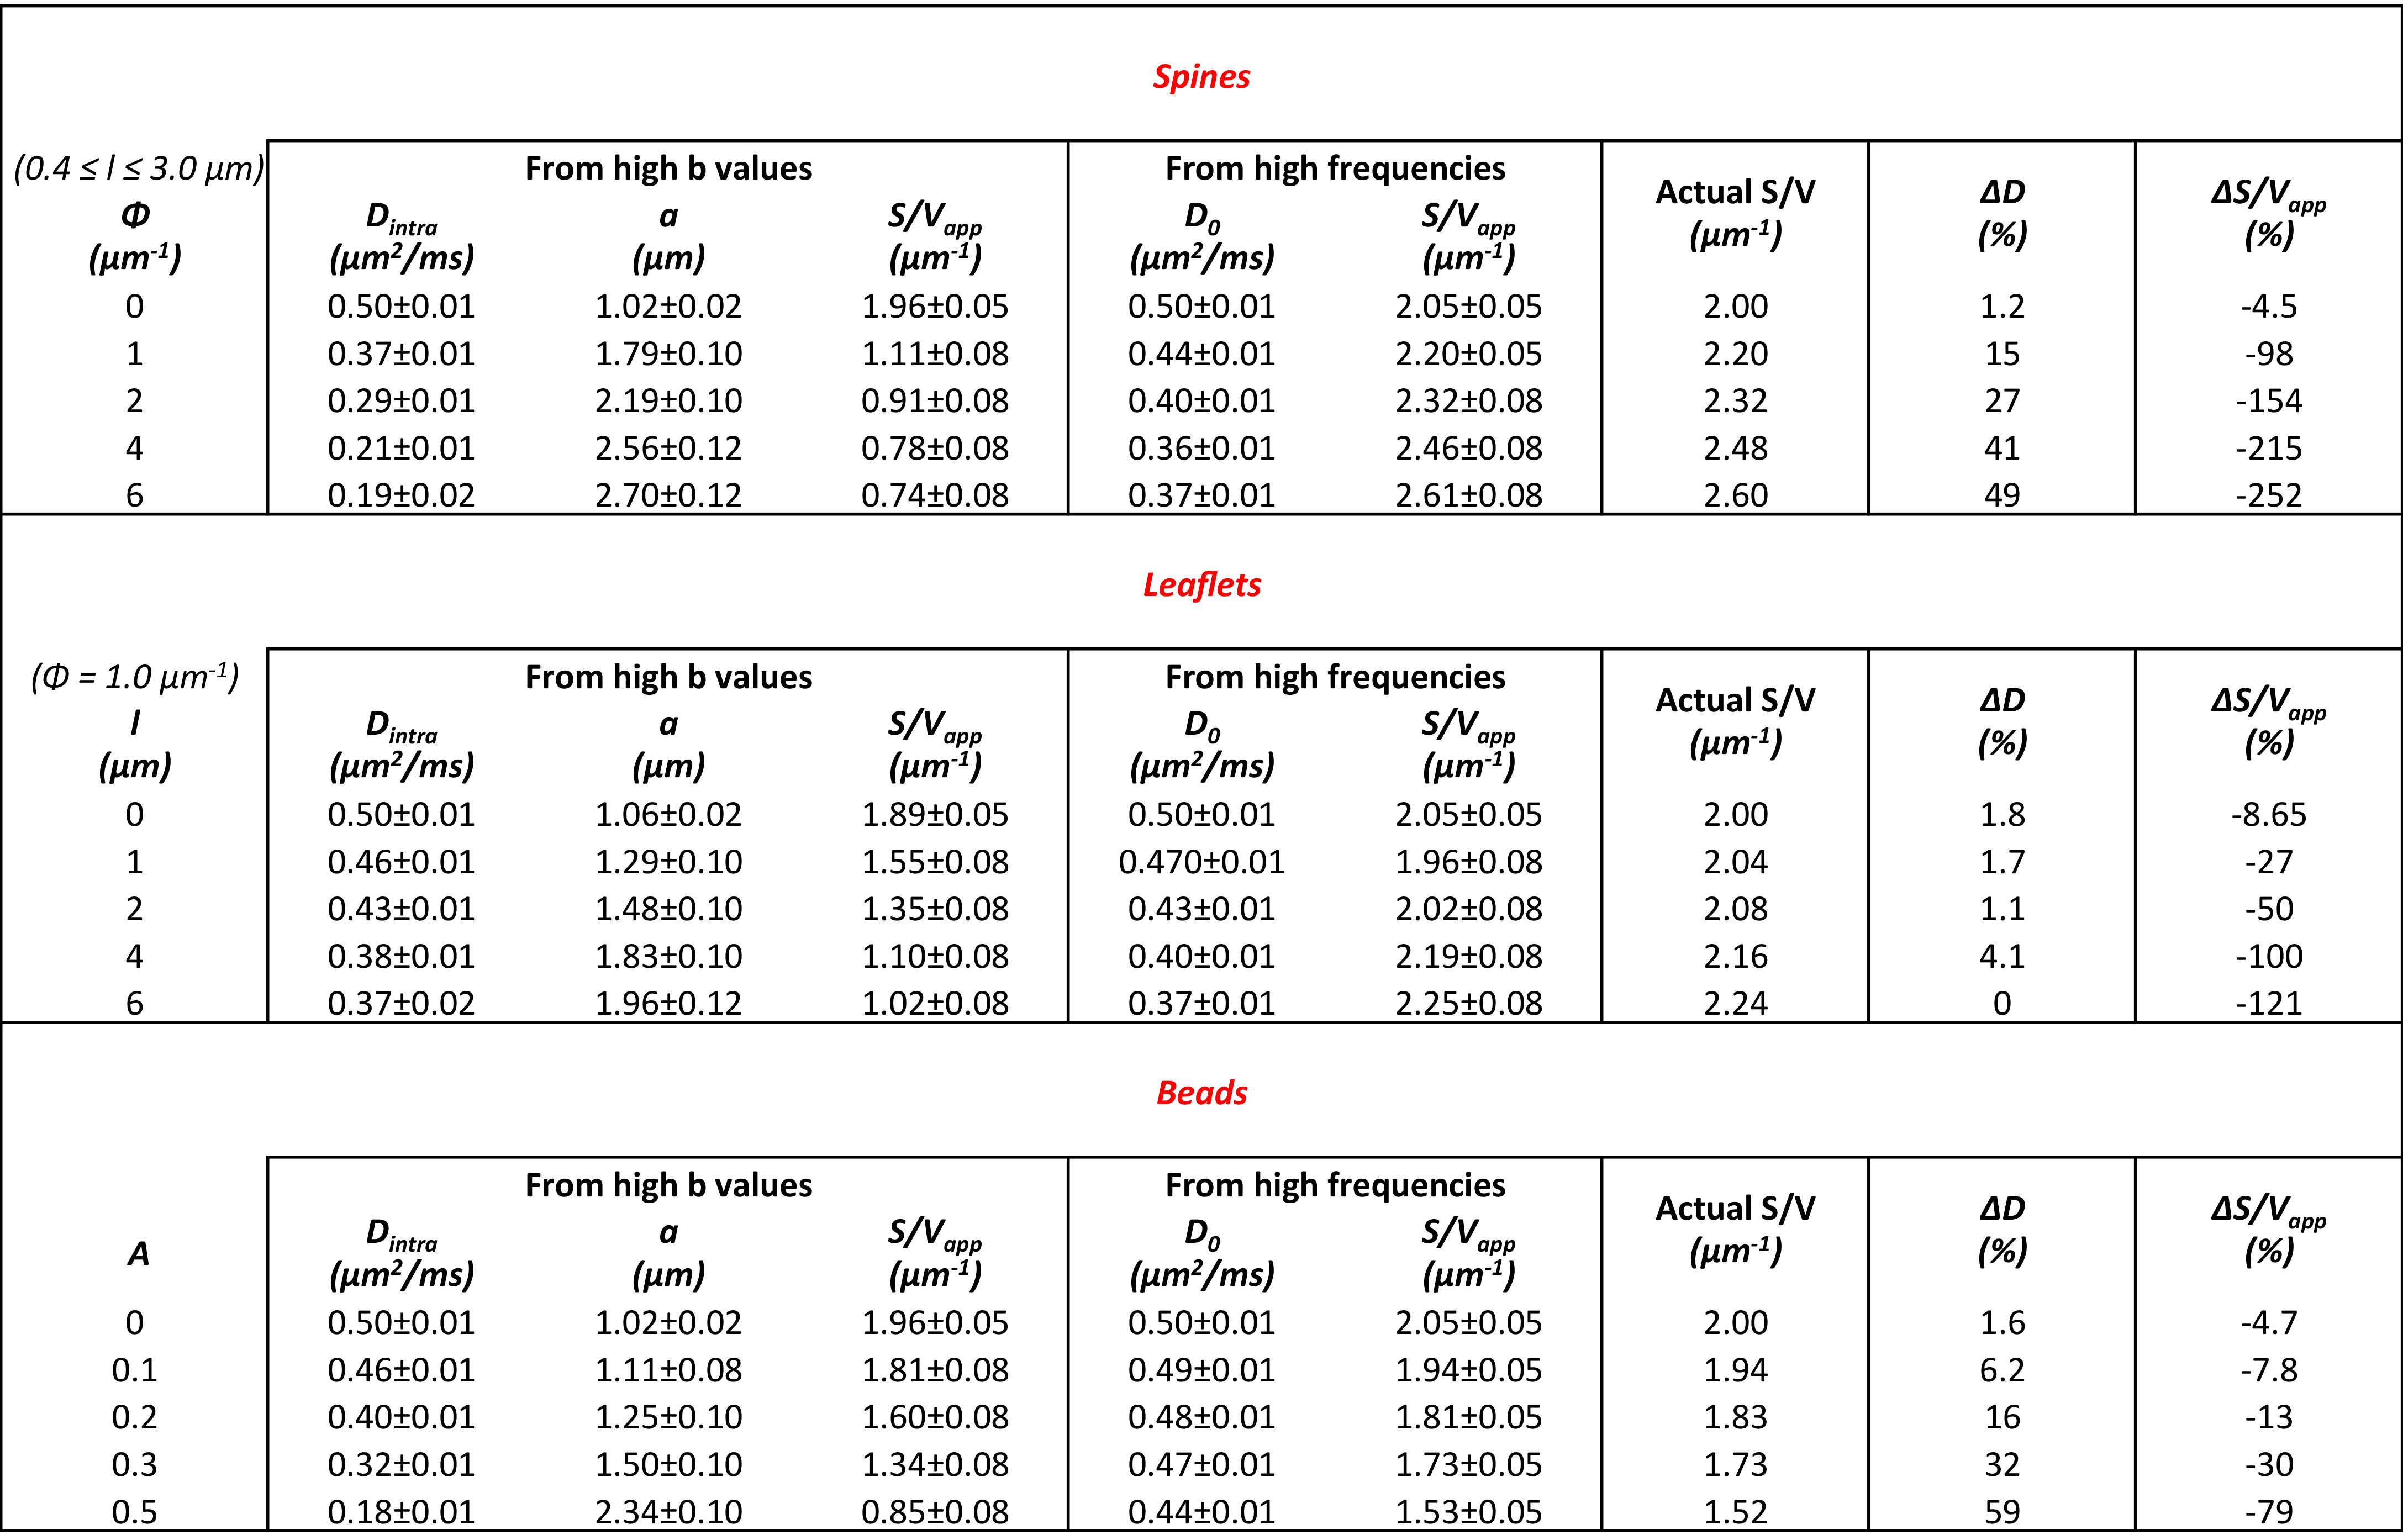
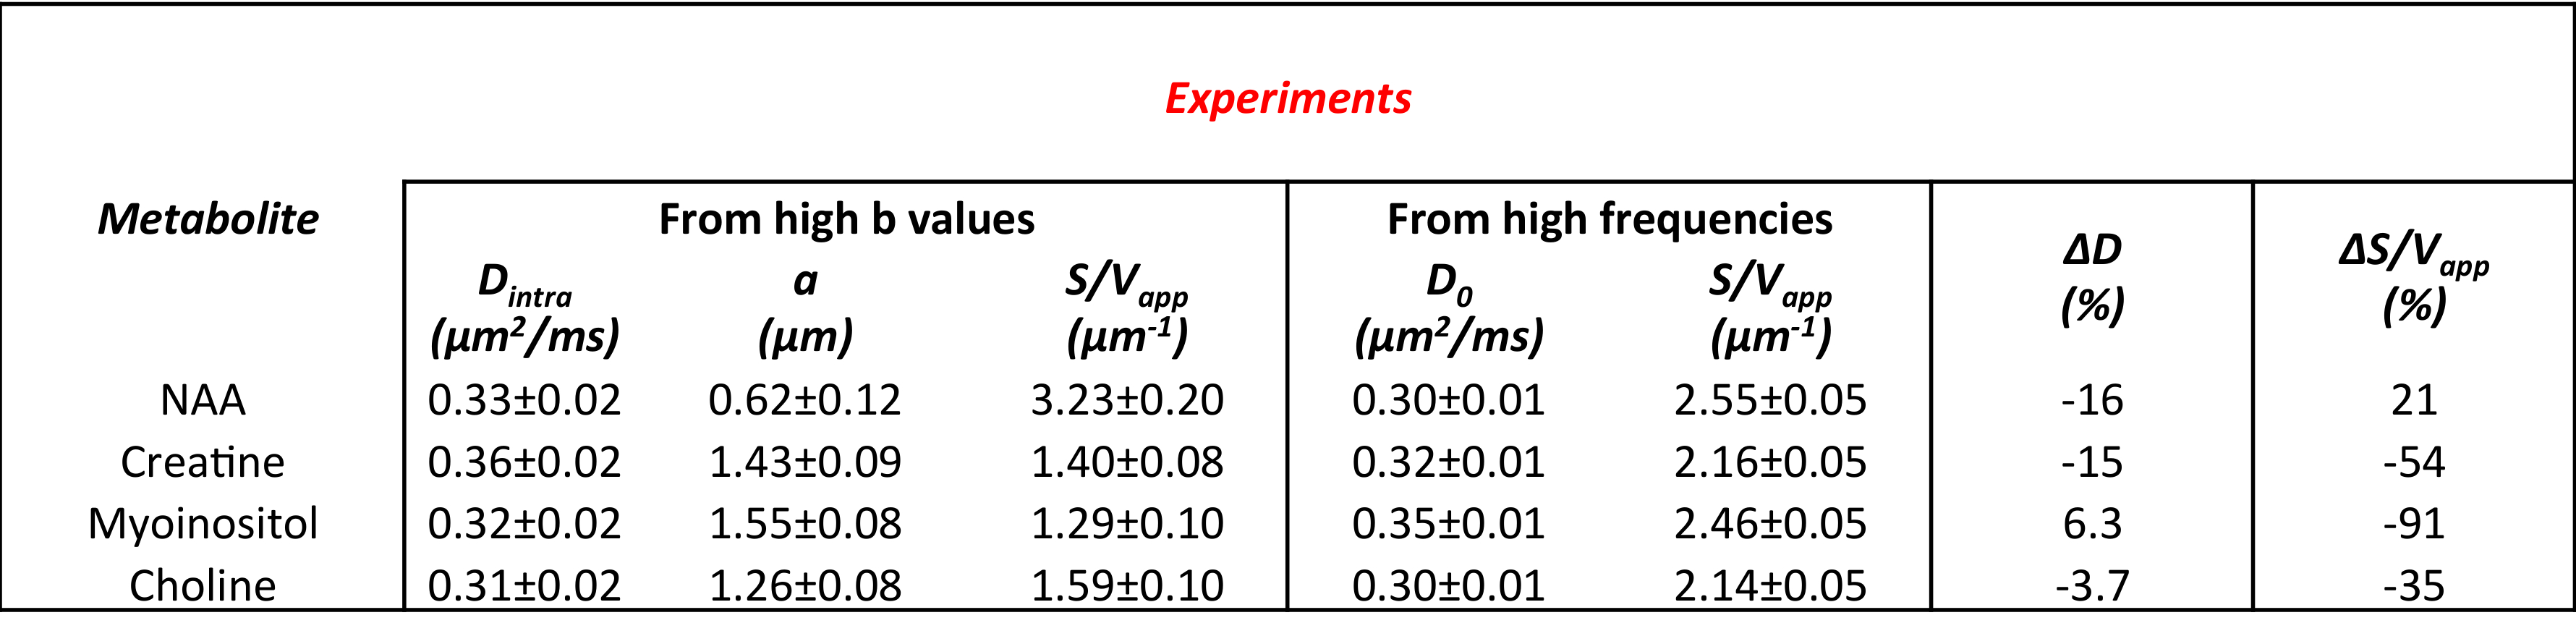
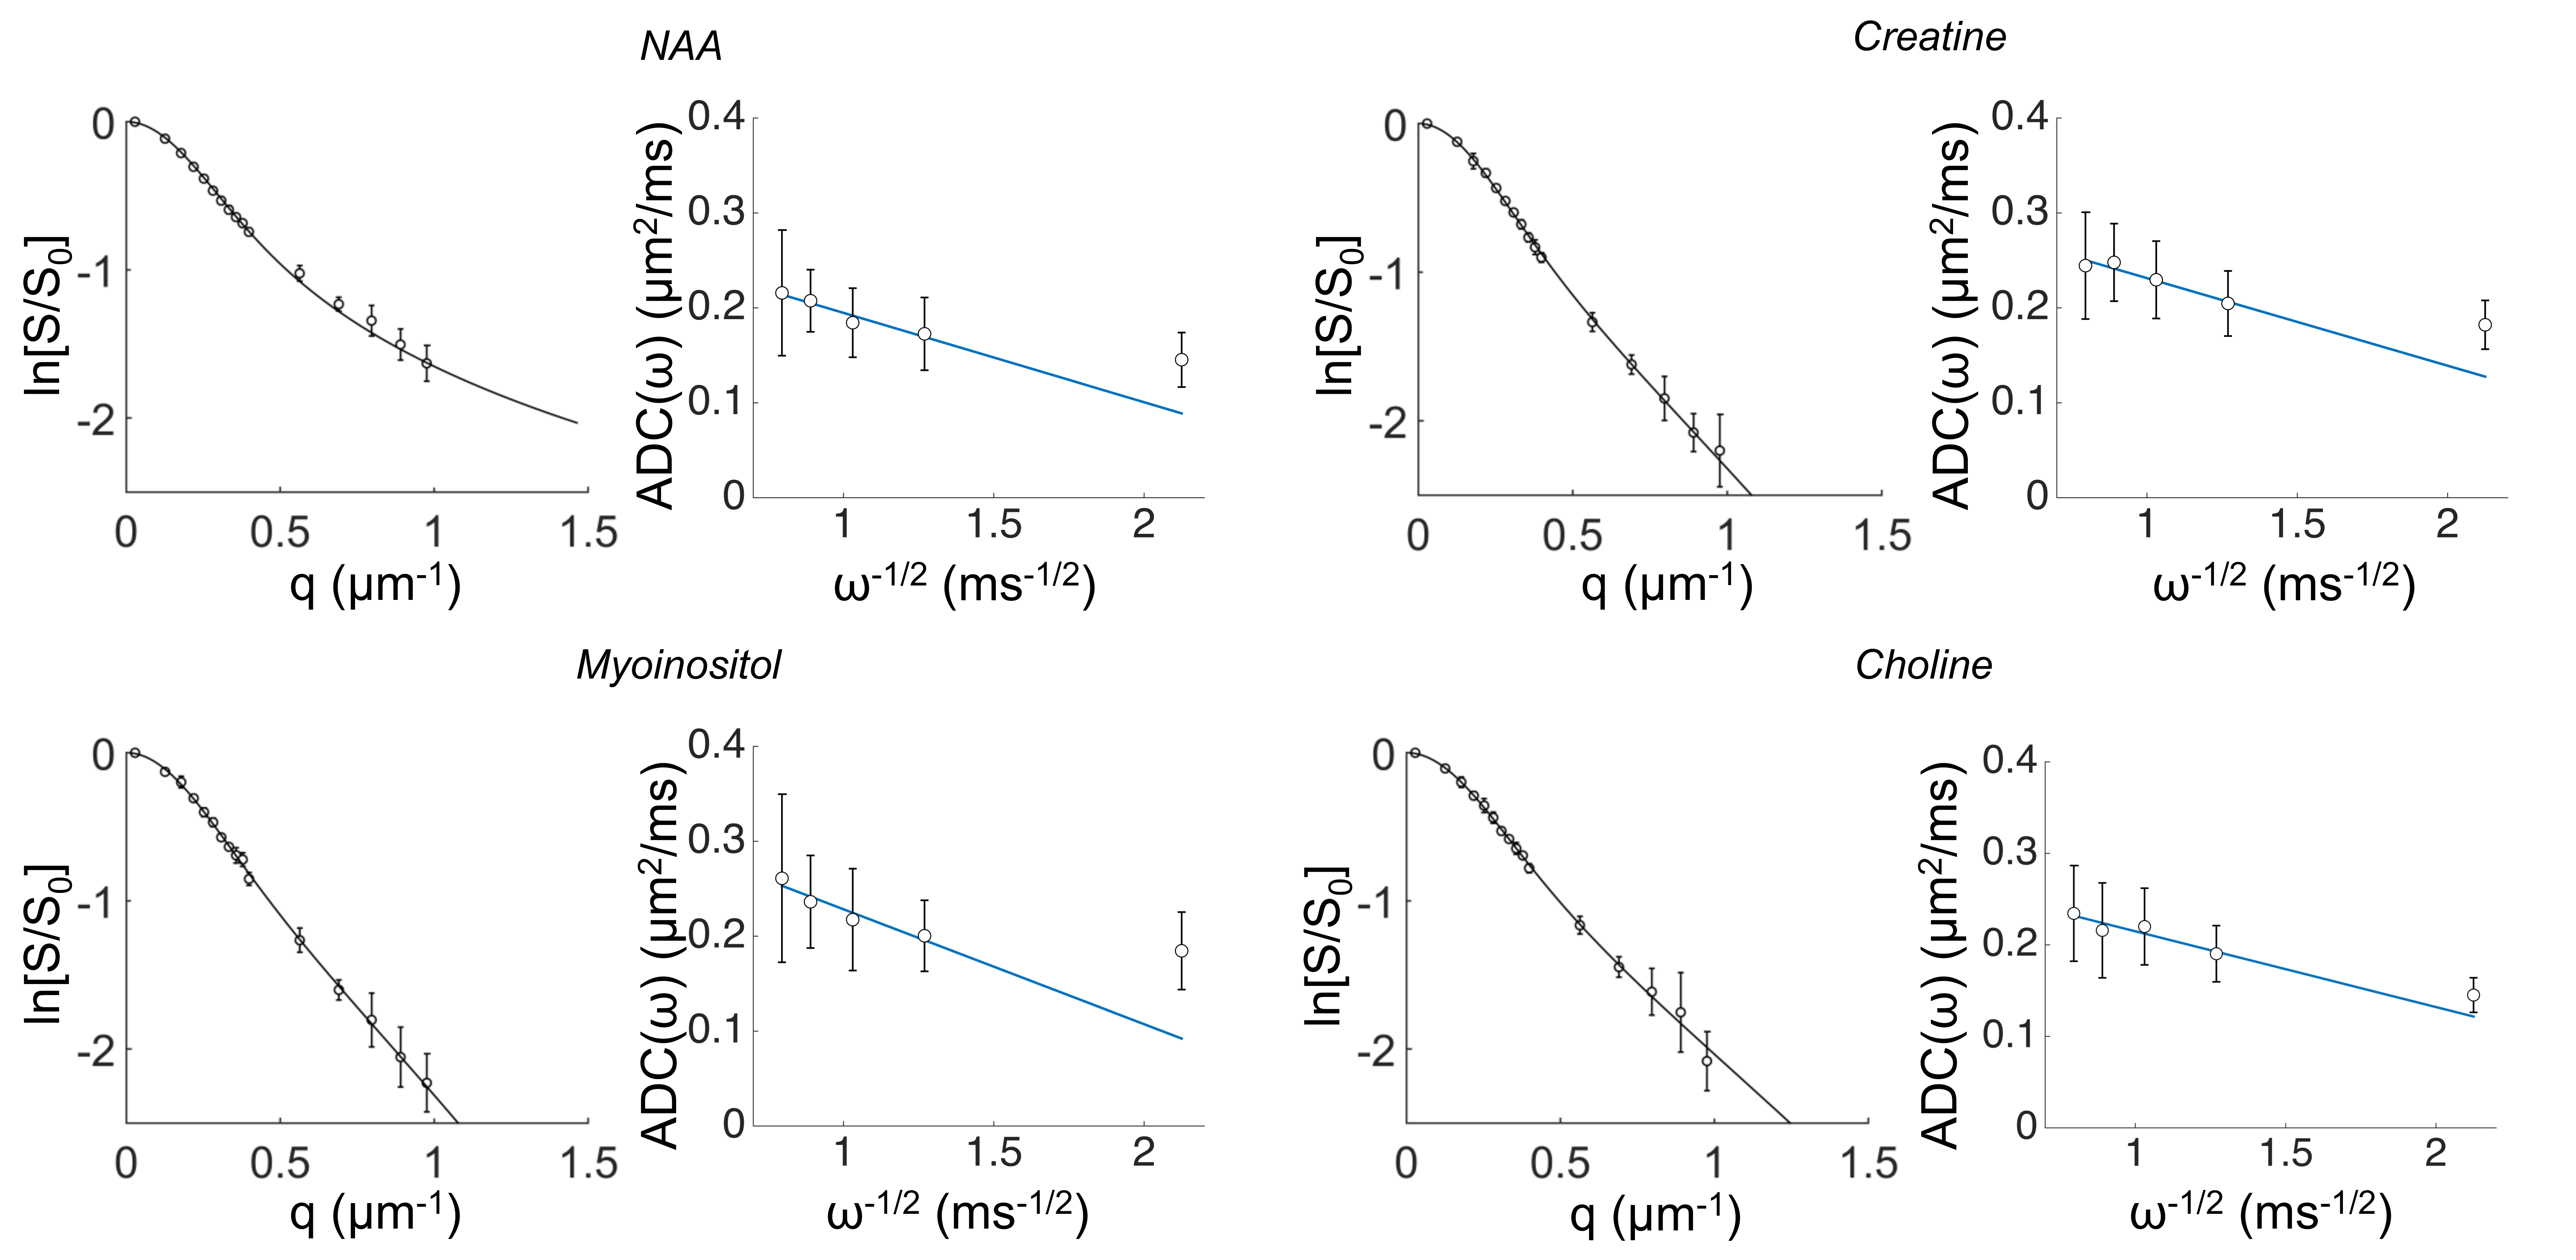
In Table 1 and 2 are reported (Dintra, a, S/Vapp) and (D0, S/Vapp) values obtained from numerical simulations2 and experiments5,6, respectively. Experimental data and some numerical simulations are shown together with the best fit curves in Figure 2 and 3, respectively. It can be seen in Table 1 that, when secondary structures are present, PGSTE and OG data do not yield the same values for diffusivities and, most strikingly, for S/Vapp. This difference can be quantified by computing the percentage difference in diffusivity and S/Vapp estimation, ΔD and ΔS/Vapp, between PGSTE and OG data. Doing the same for in vivo data, we notice that ΔD remains in general close to zero, while ΔS/Vapp is generally negative (from -34% to -91%). When compared to values obtained by fitting simulated data these ΔD and ΔS/Vapp values are coherent with a relatively low density of spines or leaflets (ϕ≤1.0 µm-1) of moderate length (l≤4.0 µm), which is reasonable according to histology3. The fact that in vivo data do not yield largely positive ΔD precludes the existence of significant beading, as expected in healthy conditions for the spectroscopic voxel considered. We should mention that for NAA we find a slightly positive ΔS/Vapp, which cannot be explained by secondary structures investigated here. However, as the uncertainty on S/Vapp estimated from high b for NAA is large, this positive ΔS/Vapp might be artefactual.Conclusion
Here we investigated the effect of fine secondary structures of cell morphology on metabolites diffusion. Comparison between multimodal DW-MRS experiments and numerical simulations shows that these fine structures may affect the DW-MRS signal and the derived diffusion metrics consistently with their expected density and geometrical features. This work also suggests that these finer structures may be measured by using multimodal DW-MRS approaches, stimulating future developments and applications.Acknowledgements
This work was funded by the European Research Council (grant #336331).References
1. Palombo M, Ligneul C, Valette J. Modeling diffusion of intracellular metabolites in the mouse brain up to very high diffusion-weighting: diffusion in long fibers (almost) accounts for non-monoexponential attenuation. Magn Reson Med 2016, DOI 10.1002/mrm.26548.
2. Palombo M, Hernandez-Garzon E, Ligneul C., Valette J. Effects of spines, leaflets and beads on intracellular diffusion and corresponding diffusion-weighted NMR signal: a numerical simulation study. Abstract submitted to this symposium.
3. Santamaria F, Wils S, De Schutter E, Augustine G J. Anomalous diffusion in Purkinje cell dendrites caused by spines. Neuron 2006; 52(4): 635-648.
4. Hall MG, Alexander DC. Convergence and parameter choice for Monte-Carlo simulations of diffusion MRI. IEEE Transactions on Medical Imaging 2009; 28(9): 1354-1364.
5. Ligneul C, Palombo M, Valette J. Metabolite diffusion up to very high b in the mouse brain in vivo: Revisiting the potential correlation between relaxation and diffusion properties. Magn Reson Med 2016; DOI: 10.1002/mrm.26217.
6. Ligneul C, Valette J, Probing metabolite diffusion at ultra-short time scales in the mouse brain using optimized oscillating gradients and “short” echo time diffusion-weighted MR spectroscopy, NMR Biomed 2016, in press.
7. Novikov DS, Kiselev VG. Surface-to-volume ratio with oscillating gradients. J Magn Reson 2011; 210(1): 141-145.
Figures