1084
Glutamate diffusion at high b-values in the rat brain in vivo under light and deep anesthesia conditions1McLean Hospital, Belmont, MA, United States
Synopsis
Magnetic resonance techniques are developed to measure brain glutamate (Glu) concentrations but still not able to detect synaptic Glu release. In the currently study, in vivo diffusion-weighted MRS using low to very high b-values was performed on rat brain prefrontal cortex under both light and deep anesthesia conditions. Significant Glu diffusion and concentration changes were observed under different anesthesia levels in the absence of similar changes in NAA or creatine. The slower diffusion and lower concentration under deep anesthesia may reflect more Glu packed into synaptic vesicles with reduced mobility and NMR visibility.
Introduction
Glutamate (Glu) is the most abundant neurotransmitter in the human central nervous system. MRI researchers have developed techniques to quantify brain Glu concentrations but none can specifically probe synaptic Glu release. The MR signal characteristics of Glu packed in synaptic vesicles (20-30% of total) would be dramatically different from the rest of brain Glu in metabolic pools. Diffusion weighted MR spectroscopy (DW-MRS) provides a noninvasive tool to obtain microstructural information (1), which has been used to probe axon abnormalities (2,3). Glu diffusion can be quantified using sophisticated DW-MRS up to high b-value (4,5). In addition, different anesthesia conditions modulate cerebral metabolism and brain activity in rats (6). In the current study, in vivo DW-MRS using low to very high b-values was performed on rat brain prefrontal cortex under both light and deep anesthesia conditions to examine Glu diffusion and concentration changes, in order to detect possible Glu pool size changes under down-regulated neuronal activity.Methods
Experiments were performed on 11 healthy male Sprague-Dawley rats with weights around 380 g. MRI scans were performed on an Agilent 9.4 T scanner at McLean Hospital with a surface coil for both RF excitation and signal reception. The animals were induced by 2.5% inhaled isoflurane in pure oxygen and maintained at 1.5% during anatomy scans and DW-MRS under light anesthesia condition.
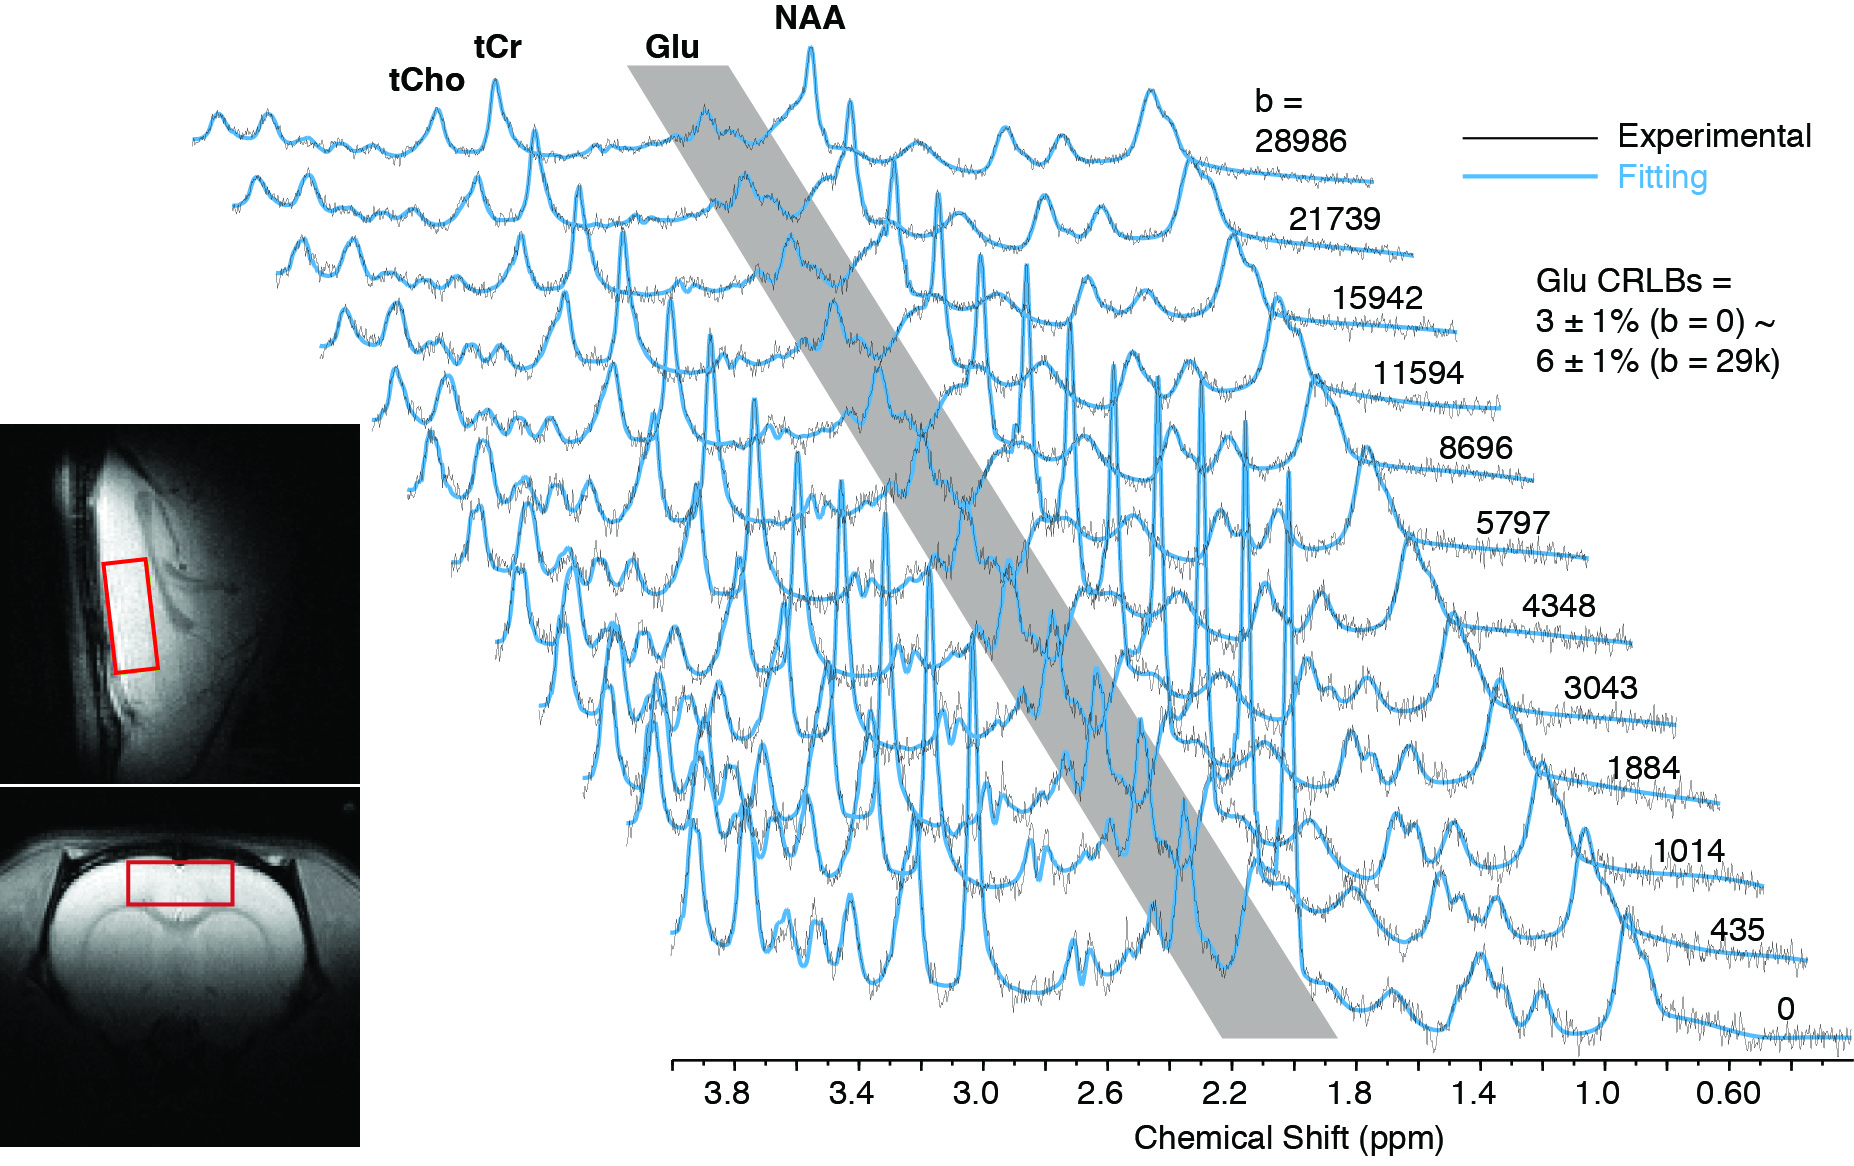
The DW-MRS sequence was modified based on a STEAM sequence with TE/TM/TR = 18/50/3000ms. Other than the b0 control scan, 11 b-values were acquired, with increased signal averages from b=500 to 30k s/mm2 to compensate for the reduced SNR. The b-values are corrected using an ethylene glycol phantom with known diffusion coefficient (in Ref. (4). In vivo DW-MRS was acquired in a large voxel of 5x 5x2 mm3 on the prefrontal cortex mainly covering grey matter (GM) (Fig. 1) with diffusion gradients parallel to the diagonal of 3 dimensions to achieve maximum strength. Every average was saved for offline phase, frequency and eddy current corrections. Averages were acquired interleaved with different b-values and the total scan time for DW-MRS is ~1 h.
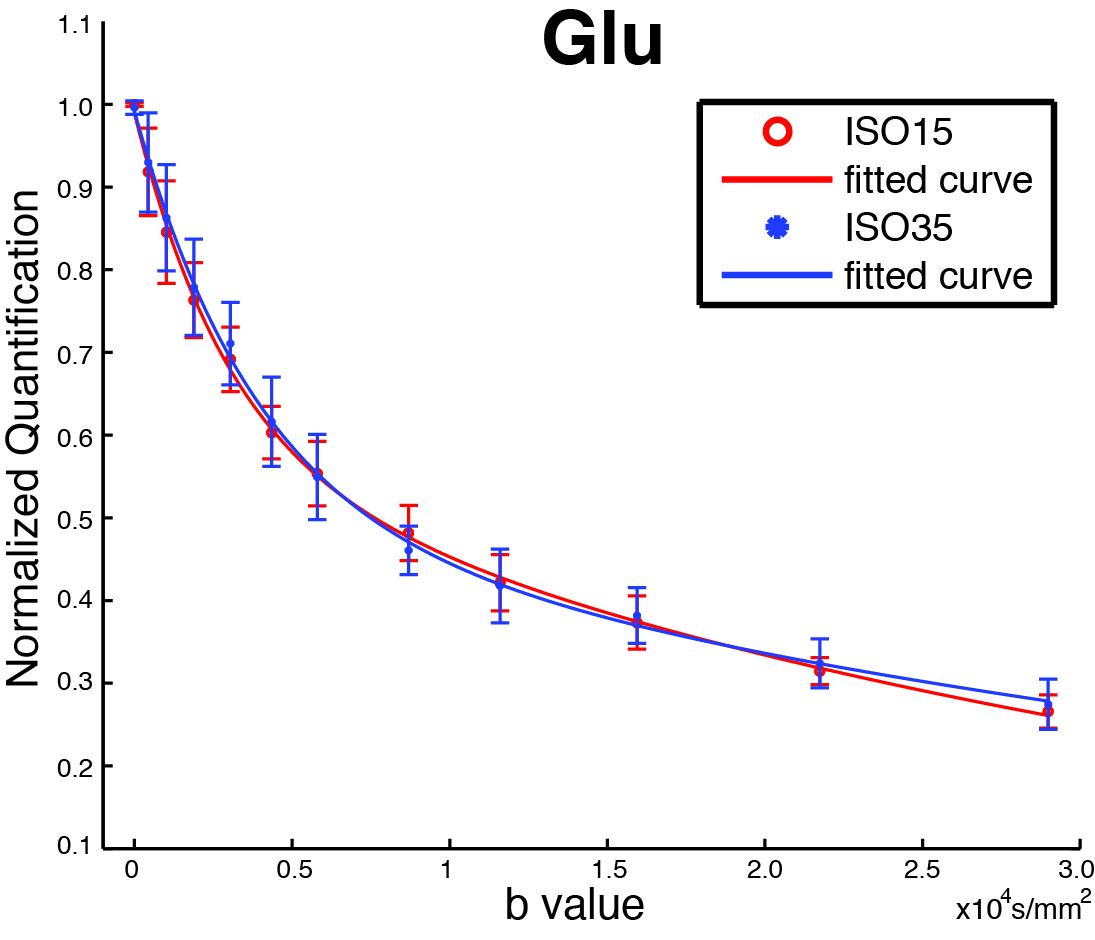
Then isoflurane level was switched to 3.5% with a stabilization time of 30 minutes. During the transition period, MRS with b = 0 was acquired and saved frame-by-frame, followed by another round of DW-MRS following the same strategy and with the same shimming conditions. All MRS spectra were preprocessed using FID-A (7) and quantified in LCModel (8). Bi-exponential decay fittings for diffusion were performed on Matlab and one way repeated measures ANOVA for concentrations were performed on OriginPro.
Results and Discussions
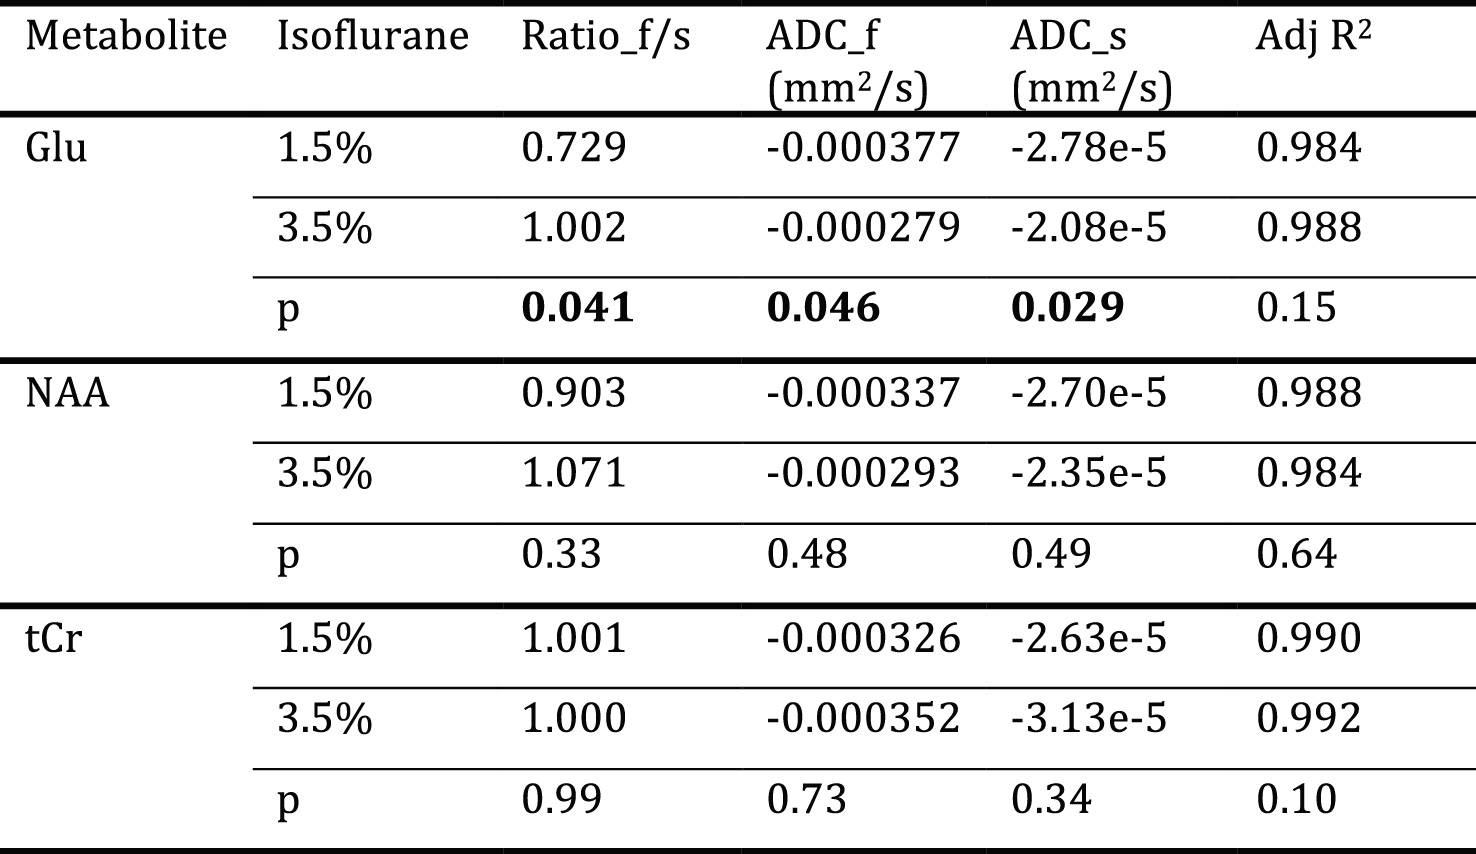
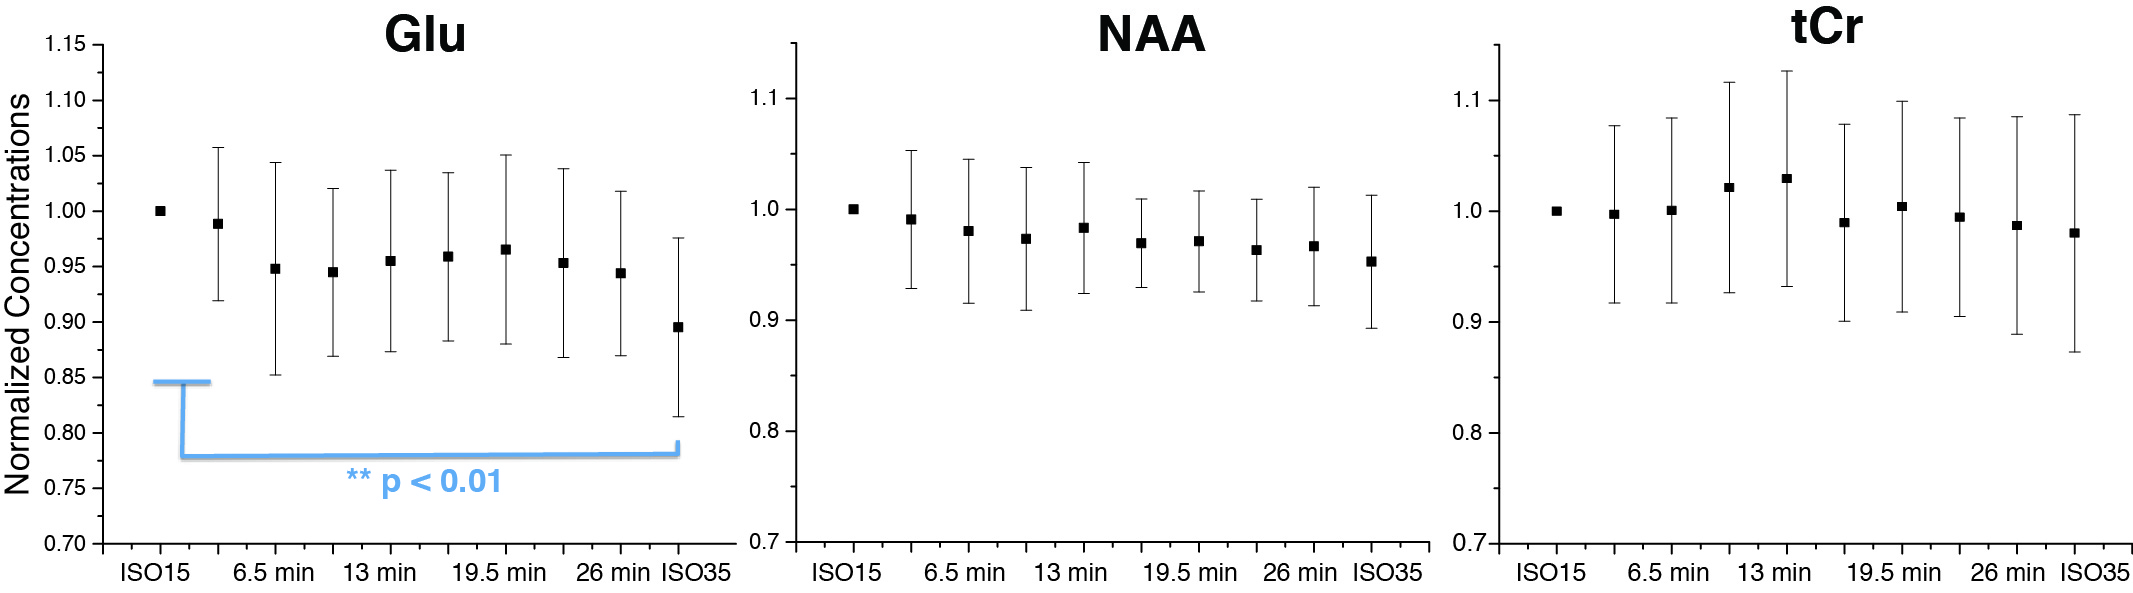
2 rats were excluded for low spectral quality (linewidth > 15 Hz at b-value = 0). No significant difference of SNR, linewidth and CRLBs between the two anesthesia conditions. The bi-exponential fitting result of Glu (Fig. 2), is presented in Table 1 along with those for NAA and total creatine (tCr) for comparison. It can be seen that the fast and slow components of 3 metabolites largely follow a 1:1 ratio, which is consistent with previous reports (4,5). Brain intracellular metabolites were reported to freely diffuse along cell fibers in GM (9). With diffusion gradients at a certain angle to a single fiber, the diffusion along the gradient can be divided into orthogonal components: parallel/perpendicular to cell fibers with unrestricted (fast)/restricted (slow) diffusions. In grey matter of rat brain, it is assumed that a lot of cell fibers are randomly oriented and the ratios between parallel/perpendicular components are tend to be averaged to 1:1 (4,10). Interestingly, only Glu shows significant changes in slow component ADC (ADC_s), fast component ADC (ADC_f), and its ratio of fast:slow (ratio_fs) when we compare superficial and deep anesthesia. Both ADC_s and ADC_f of Glu slowed down modestly in the high dose isoflurane condition. The unique modulation of Glu diffusion indicates that Glu diffusion not only reflects the two diffusion components with parallel/perpendicular to cell fibers, but also relates to Glu compartment pool sizes, which appear to change by anesthesia status. Furthermore, it was observed that there was a significant 10% difference in Glu concentration between the two anesthesia conditions in the absence of similar changes in NAA and tCr. The unique modulation of Glu concentration during anesthesia level changes also suggests differential modulation of this metabolite signal with synaptic activity.
Conclusions
In current study, significant Glu diffusion and concentration changes were observed under different anesthesia levels in the absence of similar changes in NAA or tCr. The slower ADCs and lower concentration under deep anesthesia may reflect more Glu packed into synaptic vesicles with reduced mobility and NMR visibility.Acknowledgements
The authors thank Dr Julien Vallette for his assistance in the experiments. This work was partially supported by grants from NARSAD (F.D.), R01MH105388 (DO)References
1. Ronen I, Ercan E, Webb A. Axonal and glial microstructural information obtained with diffusion-weighted magnetic resonance spectroscopy at 7T. Frontiers in integrative neuroscience 2013;7:13.
2. Du F, Cooper AJ, Thida T, Shinn AK, Cohen BM, Ongur D. Myelin and axon abnormalities in schizophrenia measured with magnetic resonance imaging techniques. Biological psychiatry 2013;74(6):451-457.
3. Du F, Ongur D. Probing myelin and axon abnormalities separately in psychiatric disorders using MRI techniques. Frontiers in integrative neuroscience 2013;7:24.
4. Ligneul C, Palombo M, Valette J. Metabolite diffusion up to very high b in the mouse brain in vivo: Revisiting the potential correlation between relaxation and diffusion properties. Magnetic resonance in medicine : official journal of the Society of Magnetic Resonance in Medicine / Society of Magnetic Resonance in Medicine 2016.
5. Pfeuffer J, Tkac I, Gruetter R. Extracellular-intracellular distribution of glucose and lactate in the rat brain assessed noninvasively by diffusion-weighted 1H nuclear magnetic resonance spectroscopy in vivo. Journal of cerebral blood flow and metabolism : official journal of the International Society of Cerebral Blood Flow and Metabolism 2000;20(4):736-746.
6. Du F, Zhang Y, Iltis I, Marjanska M, Zhu XH, Henry PG, Chen W. In vivo proton MRS to quantify anesthetic effects of pentobarbital on cerebral metabolism and brain activity in rat. Magnetic resonance in medicine : official journal of the Society of Magnetic Resonance in Medicine / Society of Magnetic Resonance in Medicine 2009;62(6):1385-1393.
7. Simpson R, Devenyi GA, Jezzard P, Hennessy TJ, Near J. Advanced processing and simulation of MRS data using the FID appliance (FID-A)-An open source, MATLAB-based toolkit. Magnetic resonance in medicine : official journal of the Society of Magnetic Resonance in Medicine / Society of Magnetic Resonance in Medicine 2015.
8. Provencher SW. Estimation of metabolite concentrations from localized in vivo proton NMR spectra. Magnetic resonance in medicine : official journal of the Society of Magnetic Resonance in Medicine / Society of Magnetic Resonance in Medicine 1993;30(6):672-679.
9. Najac C, Branzoli F, Ronen I, Valette J. Brain intracellular metabolites are freely diffusing along cell fibers in grey and white matter, as measured by diffusion-weighted MR spectroscopy in the human brain at 7 T. Brain Struct Funct 2014.
10. Palombo M, Ligneul C, Valette J. Modeling diffusion of intracellular metabolites in the mouse brain up to very high b: diffusion in long fibers (almost) accounts for non- monoexponential attenuation. Proc Intl Soc Mag Reson Med 2016;24.
Figures