1083
Accurate estimation of intra-axonal diffusivity and anisotropy of NAA in humans at 7T1Danish Research Centre for Magnetic Resonance, Centre for Functional and Diagnostic Imaging and Research, Copenhagen University Hospital Hvidovre, Copenhagen, Denmark, 2Department of Physical Therapy and Human Movement Sciences, Northwestern University, Chicago, IL, United States, 3Department of Applied Mathematics and Computer Science, Technical University of Denmark, Kongens Lyngby, Denmark, 4C. J. Gorter Center for High Field MRI, Department of Radiology, Leiden University Medical Center, Leiden, Denmark
Synopsis
Diffusion weighted spectroscopy offers a unique probe for tissue microstructure and recent studies demonstrate NAA diffusivity as an independent marker of axonal health. In this study we address the problem of macroscopic dispersion of fiber directions and suggest the use of high angular gradient resolution and powder averaging as an experimentally inexpensive and accurate way to solve this problem. We explore the limits of this approach in simulations and in experiments on humans at 7T.
Purpose
Diffusivity of the intra-axonal metabolite NAA (Dcytosol(NAA)) measured with diffusion weighted spectroscopy (DWS) is a promising marker for axonal health1,2,3. An unbendable problem in the unbiased estimation of Dcytosol(NAA) in large spectroscopic VOIs is the effect of fiber orientation dispersion on multiple length scales. We suggest powder averaged DWS as a simple method for investigating NAA diffusivity and demonstrate the limits of this approach in simulations and experiments on humans at 7T.Theory
Dispersion can be modeled with a priori distributions in brain regions with some alignment4. An alternative approach is to emulate a fully disperse sample with a powder average, i.e. the mean over multiple uniformly distributed gradient directions for each b-value. Assuming an axially symmetric diffusion tensor with longitudinal and transversal eigenvalues DL (here equivalent to Dcytosol(NAA)) and DT where the non-monoexponetial decay of its powder average is given by:
$$$S(b)=S_0\cdot e^{-b\cdot D_T}\frac{\sqrt{\pi}}{2}\frac{erf\left(\sqrt{b\cdot (D_L-D_T)}\right)}{\sqrt{b\cdot (D_L-D_T)}} $$$ (1)
Eqn. 1 has previously been used for analysis of DWS data with low angular resolution under the assumption of a highly disperse sample5,6,7 and used for powder averaged data from DWI8.
Methods
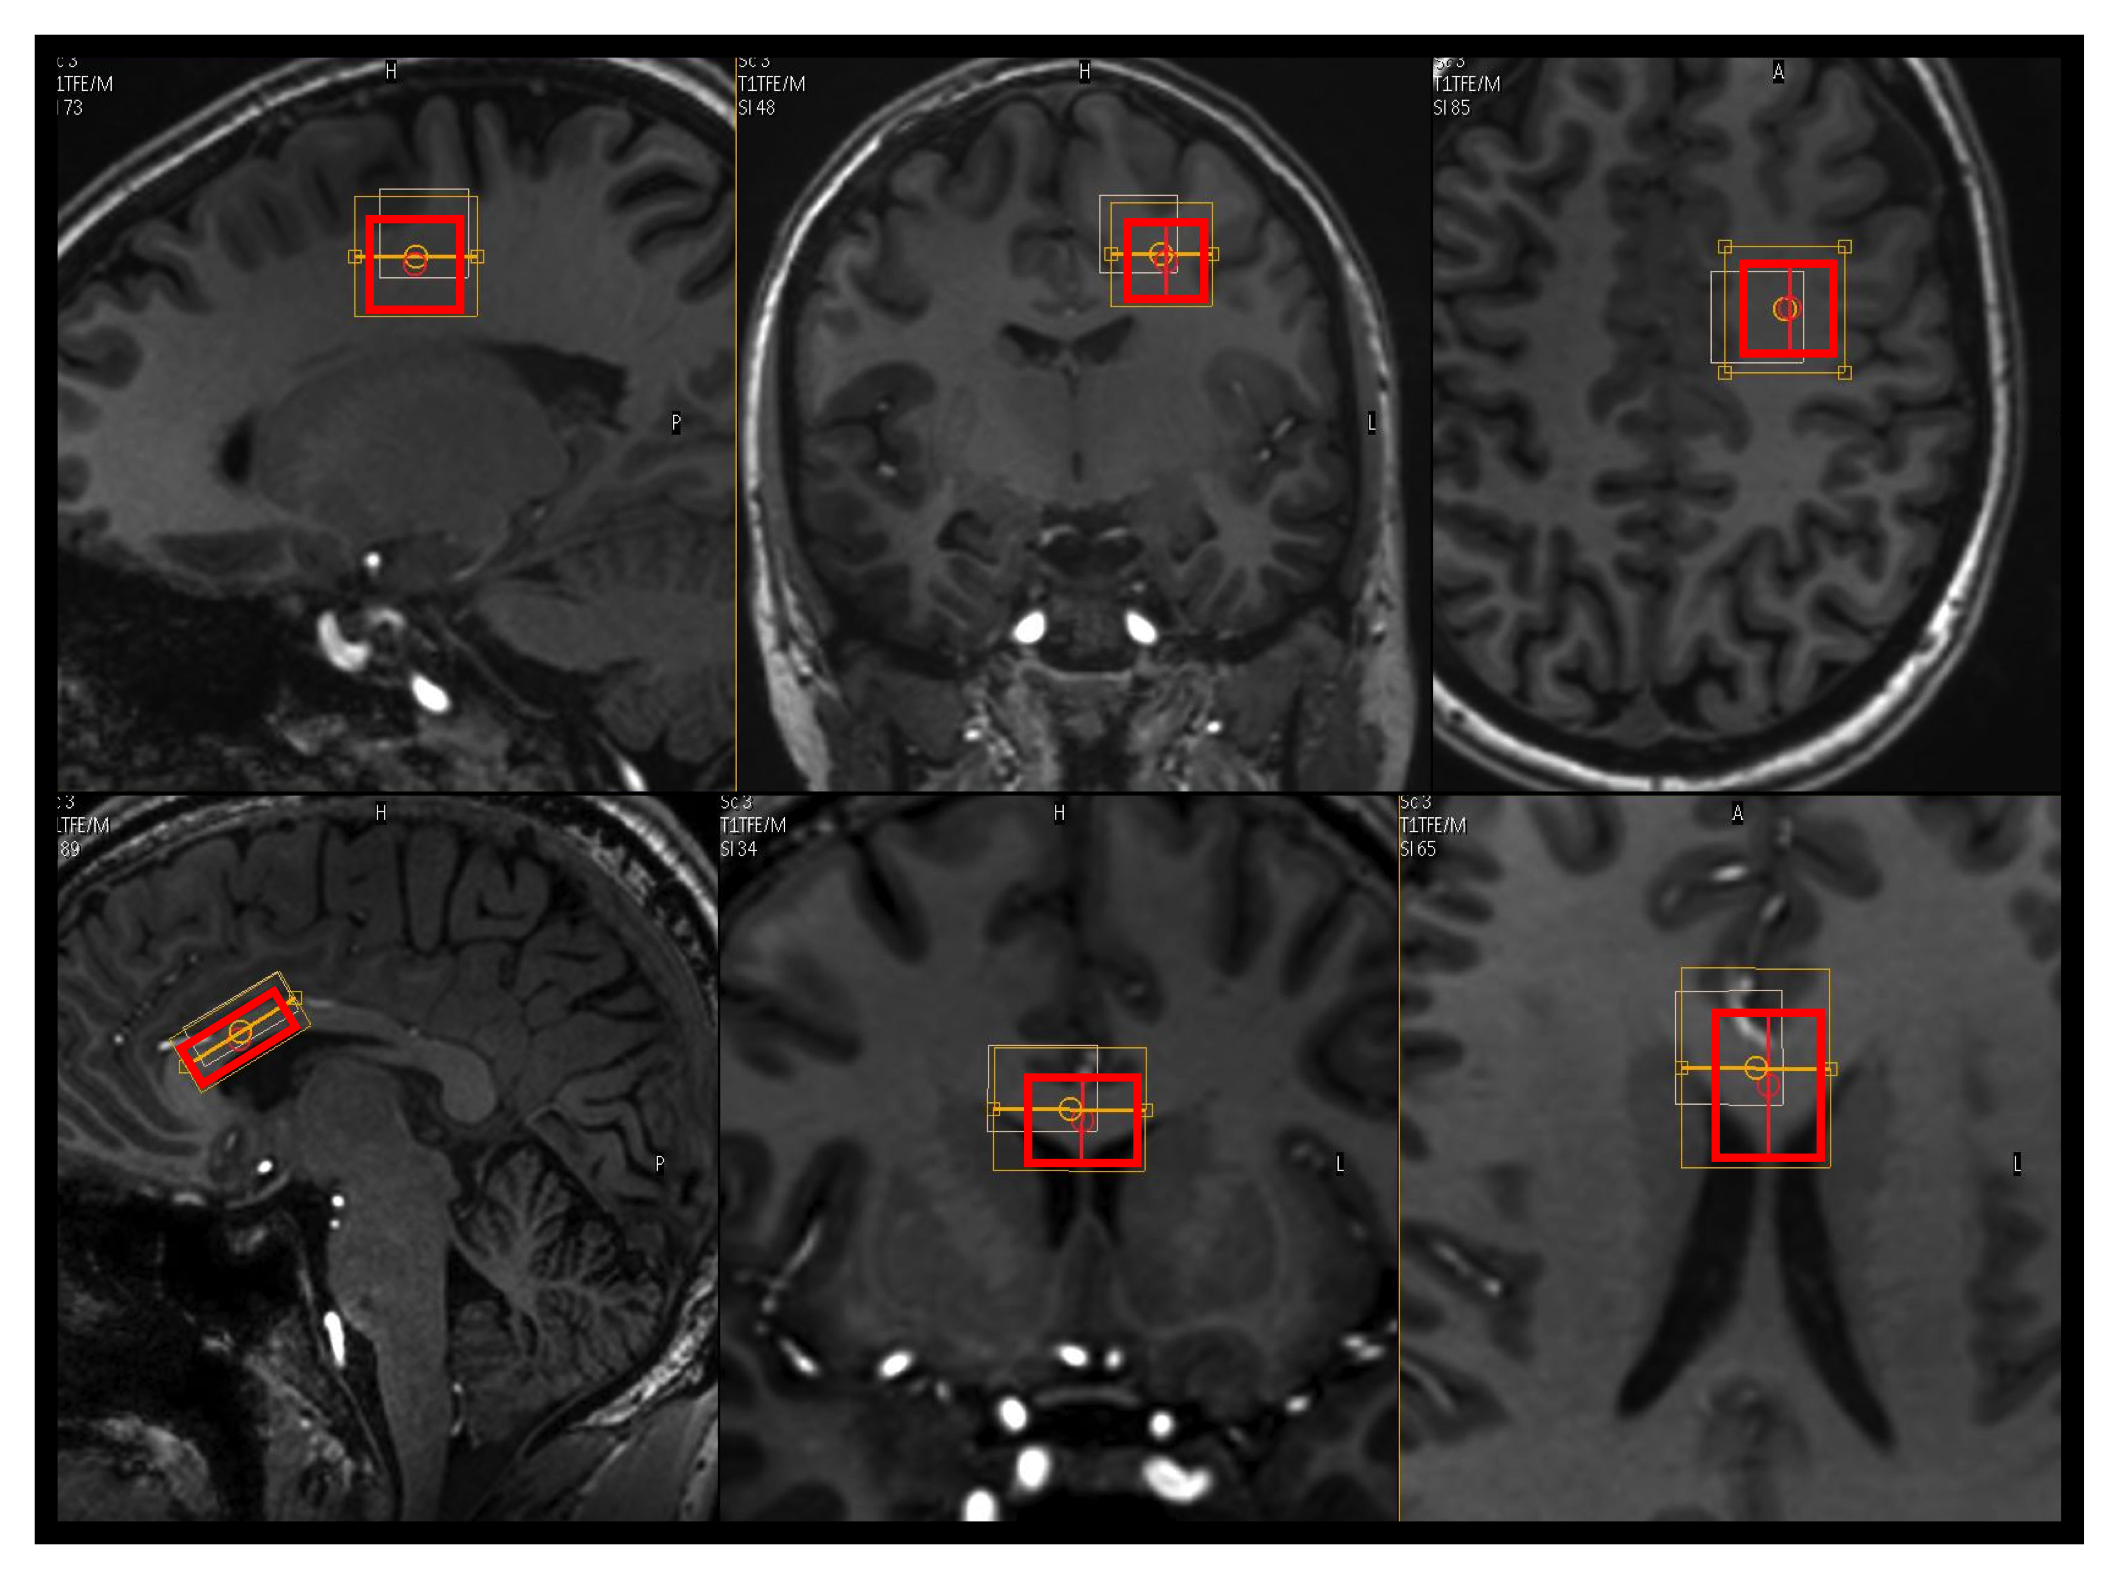
Experiments: 10 healthy participants (28.5 ± 9.5. y/o) participated in the study. DWS single voxel measurements were performed on a 7T human MRI system (Philips Healthcare, Best, The Netherlands) and the participants were scanned with a voxel placed over the anterior body of the corpus callosum (CC, N=5) or in parietal white matter (PWM, N=5) (fig. 1). A PRESS sequence was used with the following parameters for the CC voxel: TE: 125 ms, voxel size 25×15×10 mm3, 5 b values, range: 0-9400 s/mm2 and for the PWM voxel: TE: 136 ms, 16×16×16 mm3, 5 b values, range:0-14500 s/mm2. 12 uniformly distributed gradient directions and a TR of 3 heart beats were used in both cases with a total scan time of ~36 min. The individual spectra were corrected for eddy currents and phase and frequency variations. tNAA was quantified using LCmodel9 after the spectra were averaged over each b-shell and fitted to eqn. 1. Simulations: Synthetic data was produced over a range of gradient directions, b-values, SNRs, eigenvalues and tensor orientations to evaluate noise propagation and experimental parameter settings.Results and Discussion
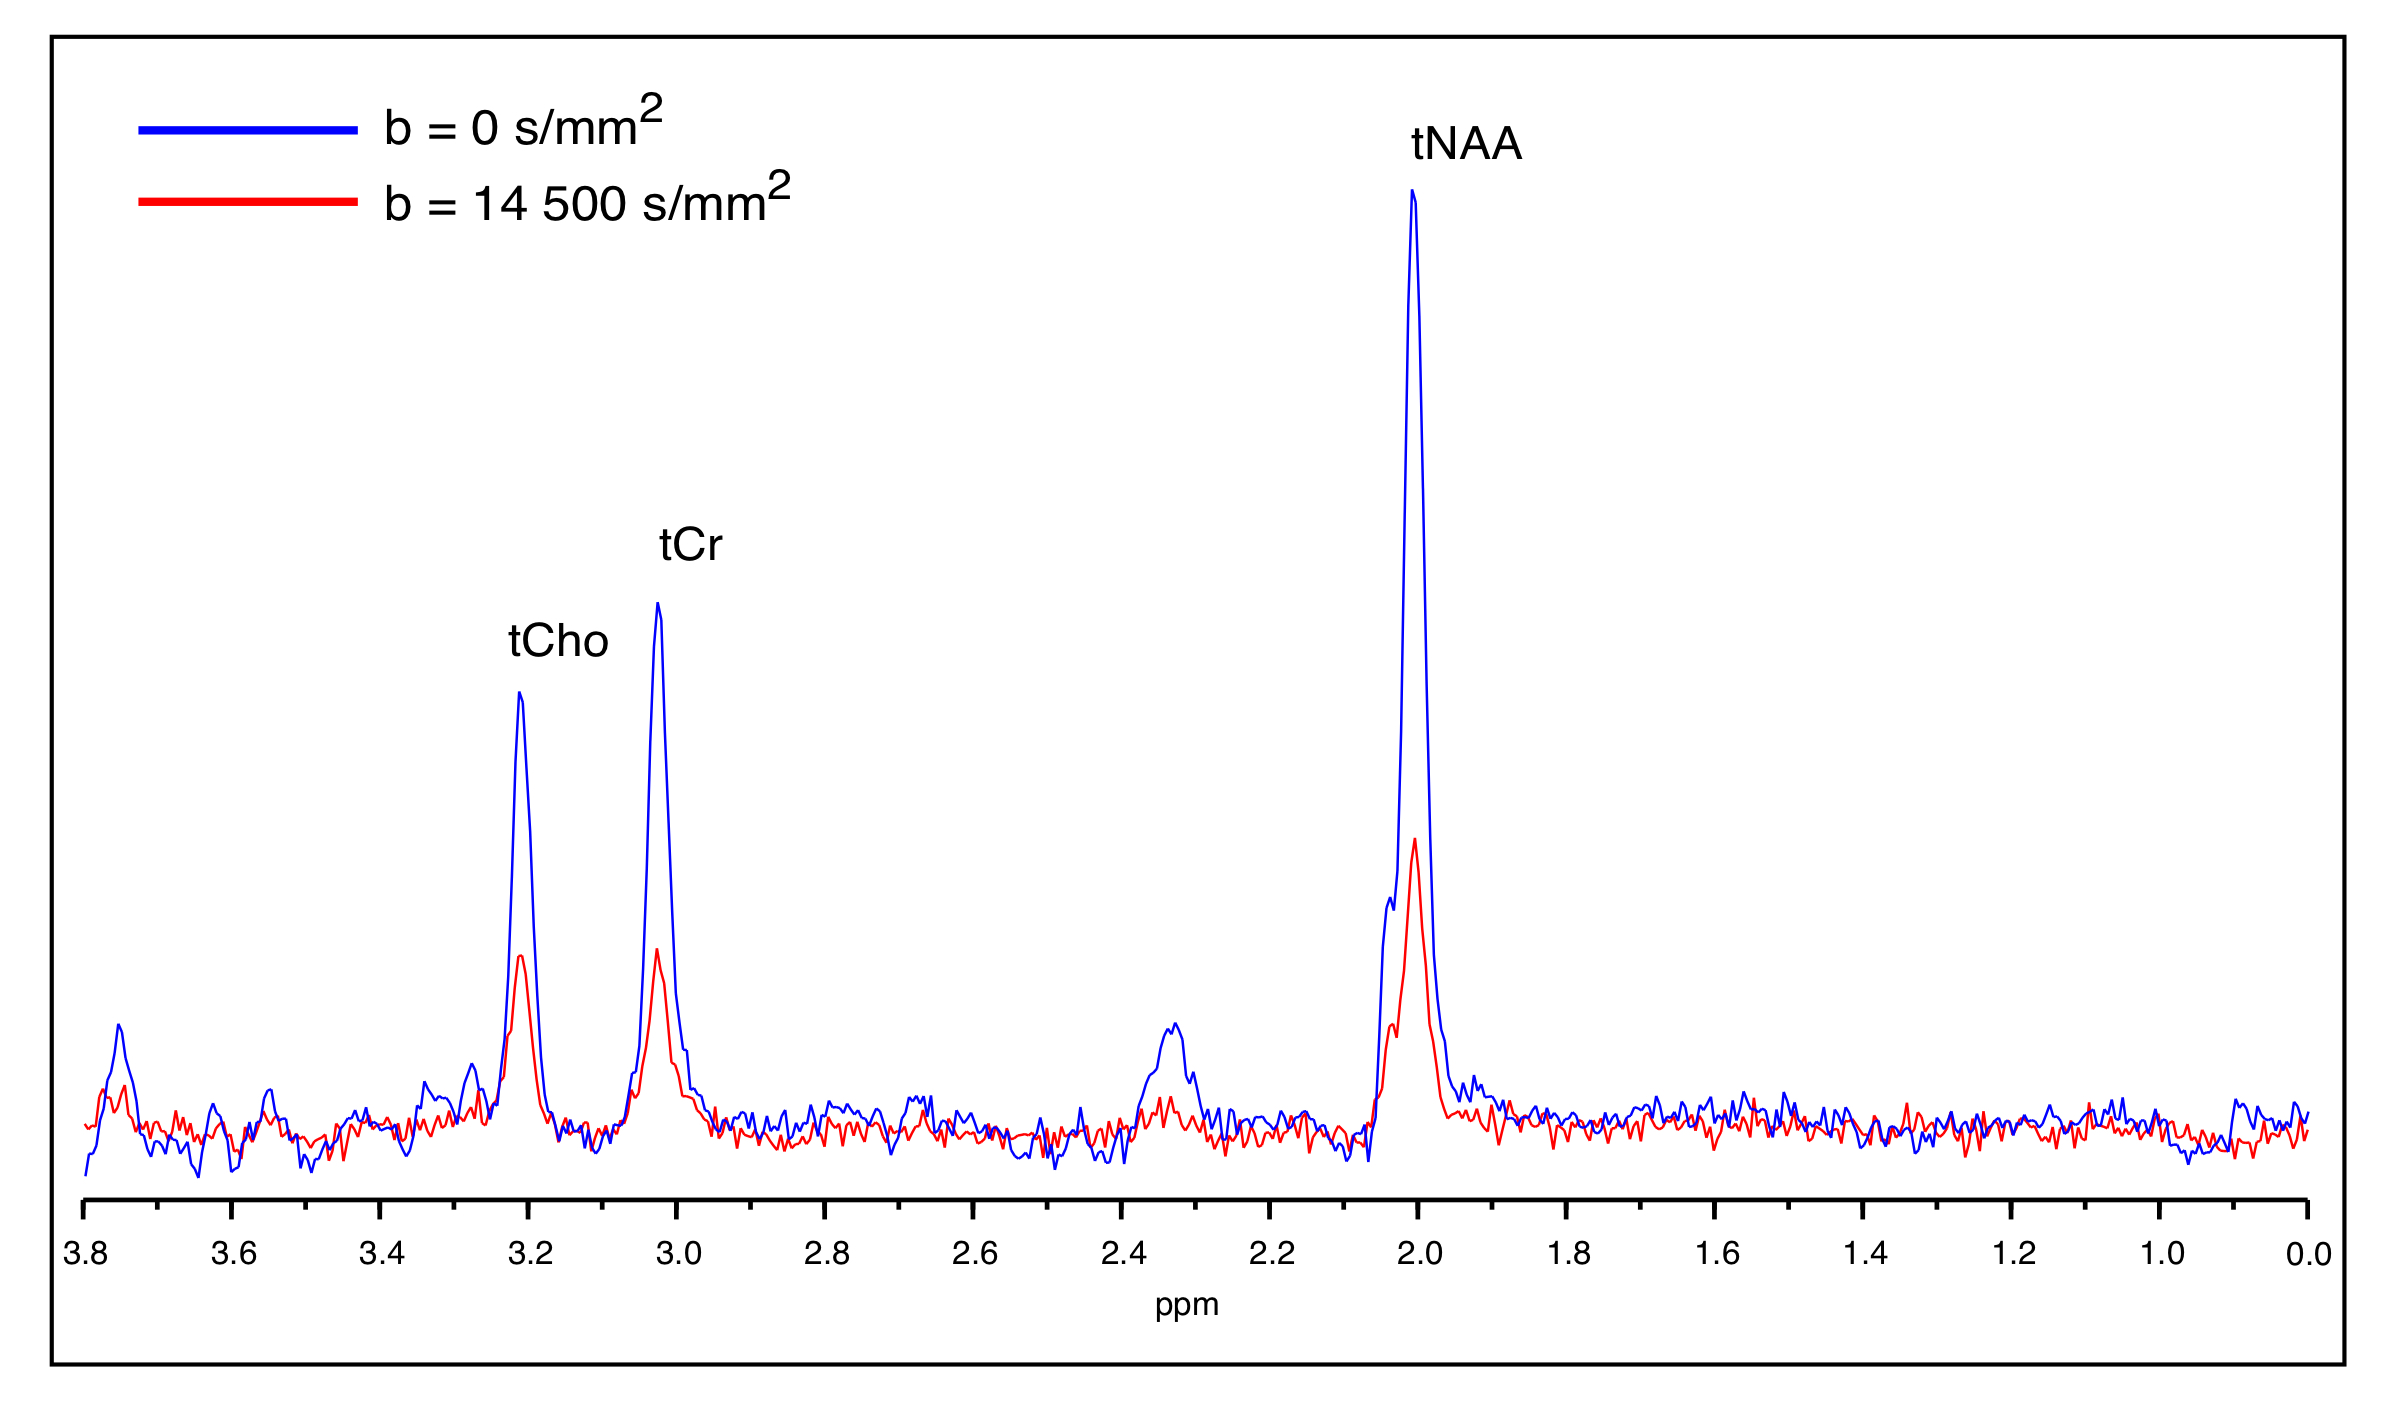
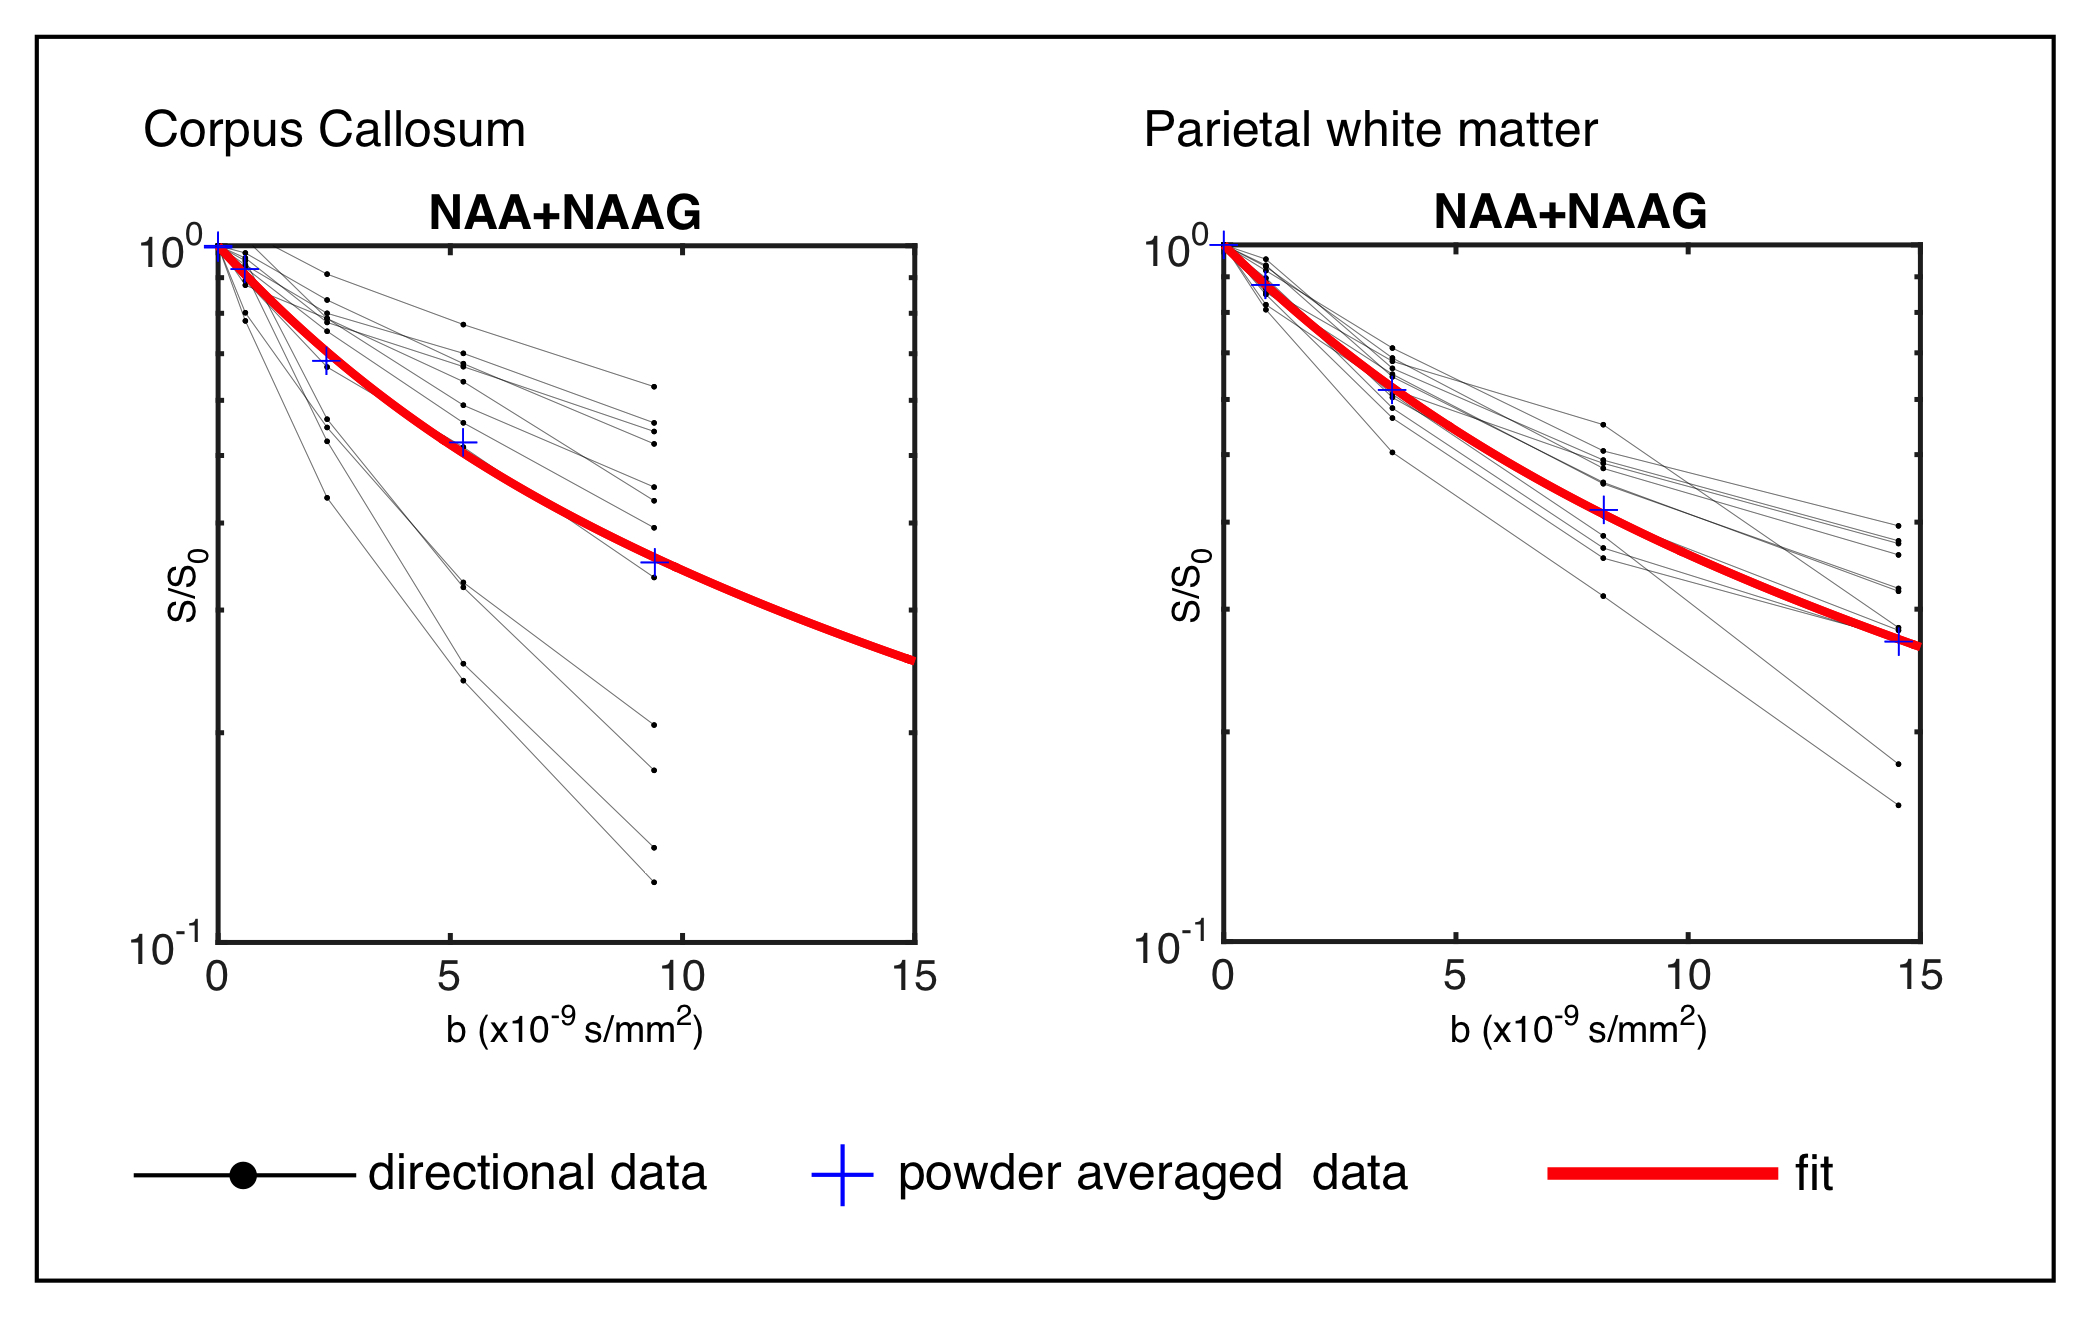
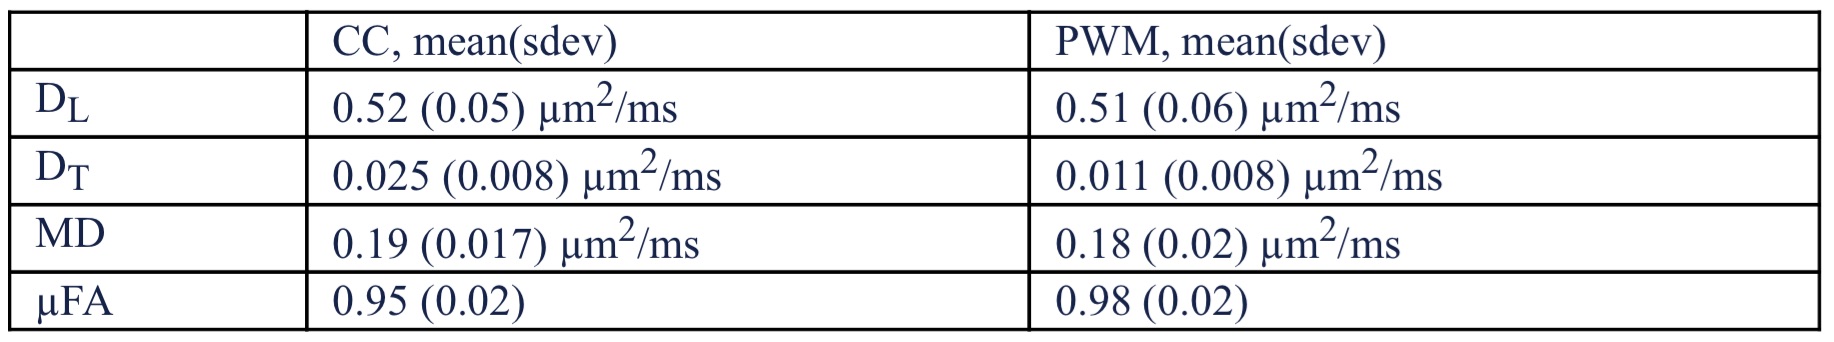
Experiments: Phased powder averaged spectra showed excellent signal to noise with Cramér-Rao lower bound in the order of 2-4% even for the highest b-value (fig. 2). Two examples of attenuation curves from CC and PWM are shown in fig. 3. The model corresponded well to data in the entire range of b-values and group averaged data are shown in table 1, where MD = ( DL/3+2·DT/3) and µFA is the dispersion free microscopic fractional anisotropy calculated from DL and DT. Values were similar in the two regions, but with slightly larger diffusivities in CC and higher anisotropy in PWM. The results are in good agreement with results reported in human white matter using fitted distributions (Ronen et al 2013).
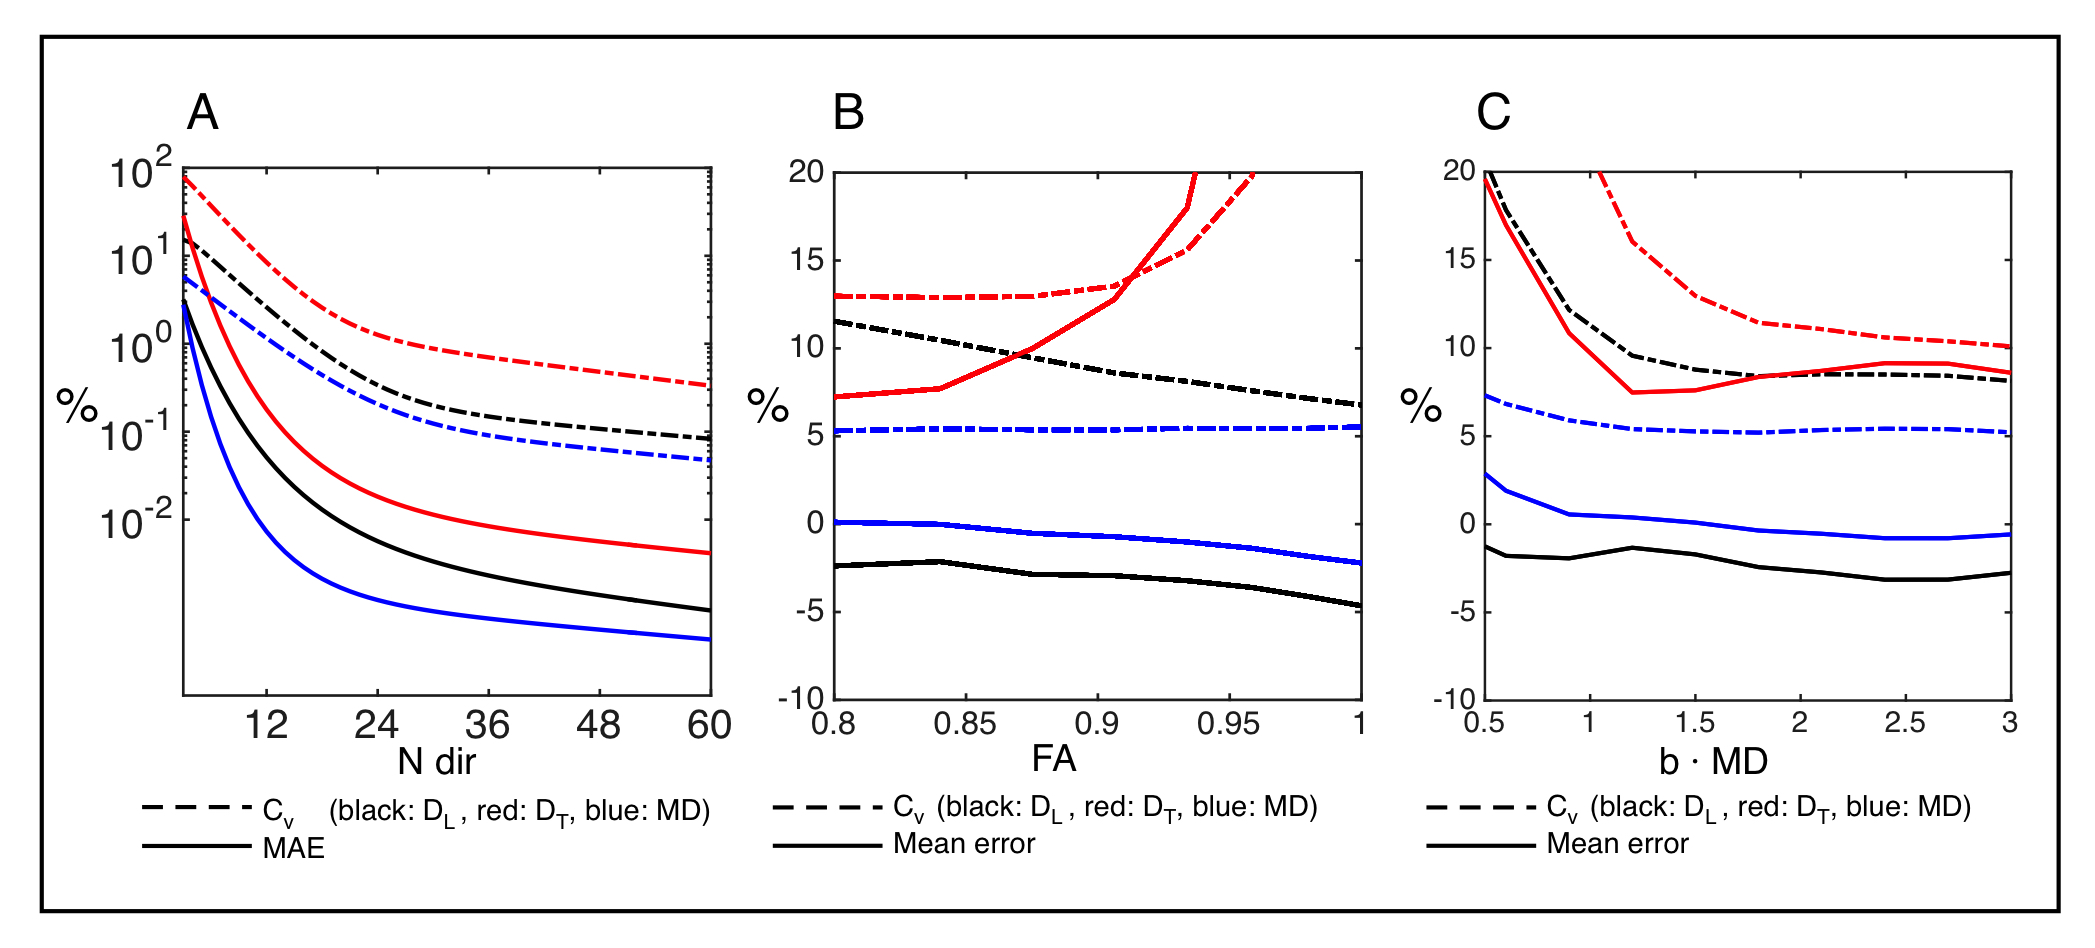
Simulations: Estimates from noise free powder averages demonstrate large rotational variance for low angular resolutions (fig. 4A). With the PWM protocol at SNR = 30 in the individual directional measurement we observe minor biases in MD and DL estimated from powder averages over subdomains with different µFA and constant MD (figure 4B). Finally, simulations with increasing maximum b-value show that all estimates stabilize around b·MD = 2, equivalent to the CC protocol (fig. 4C).
Conclusion
We demonstrate how powder averaging can be used to handle angular dispersion effects in the acquisition and analysis of DWS data. The data also supports the hypothesis that the non-monoexponential attenuation of NAA is well described by a single diffusion tensor with dispersion. The possibility to measure NAA DL in any white matter region has large clinical value as Dcytosol(NAA) is a specific marker for axonal health. Our simulations and experiments further suggest that data in general with benefit can be acquired with high angular resolution. Conveniently, this is experimentally inexpensive as averages can be distributed over many directions and phased over each b-shell. Based on simulations we suggest at least 24 directions with b-values up to 10 000 s/mm2.Acknowledgements
This work was supported by the Danish Council for Independent Research (4093-00280A and 4093-00280B).References
1. Wood et al, J Neurosci. 2012, 32(19):6665-9
2. Ercan et al, Brain. 2016, 139(5):1447-57
3. Branzoli et al, Neurobiol Aging. 2016, 47:210-217
4. Ronen et al, Front Integr Neurosci. 2013, 10.3389/fnint.2013.00013
5. Yablonskiy et al Proc Natl Acad Sci U S A. 2002, 99(5):3111-6
6. Kroenke et al, Magn Reson Med. 2004, 52(5):1052-9
7. Pamolo et al, MRM 2016 , in press
8. Kaden et al, Magn Reson Med. 2016, 75(4):1752-63
9. Provencher, MRM 1993, 30(6):672-679
Figures