1082
Approaching free intracellular diffusion by diffusion-weighted MRS at ultra-short time scales: initial results in the rodent brain using a 1.5 T/m gradient1Molecular Imaging Research Center (MIRCen), Commissariat à l'Energie Atomique, Fontenay-aux-Roses, France, 2UMS 27, INSERM, Fontenay-aux-Roses, France
Synopsis
At ultra-short time scales, intracellular metabolites are expected to experience less restriction, so that their apparent diffusion coefficient (ADC) as measured by diffusion-weighted MRS should approach the free intracellular diffusivity in a manner which depends on small microstructural features. In this work we use a unique gradient insert capable of reaching 1.5 T/m to measure metabolite ADC in the rat brain up to 665 Hz using oscillating gradients (corresponding to 0.21-ms diffusion time in the Mitra limit), in order to approach and estimate free intracellular diffusion.
PURPOSE
Since most metabolites detected by MRS are intracellular, their diffusion properties are expected to specifically reflect the intracellular environment. At ultra-short time scales, the apparent diffusion coefficient (ADC) will be less sensitive to restriction and approach the free intracellular diffusivity in a manner which depends on small microstructural features. To perform these kinds of measurements, oscillating gradients (OG) are considered superior to pulsed-field gradients (PFG) as they are reducing constraints on maximal gradient strength. However, the latter is still limiting to reach very short diffusion times or, more rigorously in the context of OG, very high frequencies. In this work we use a unique gradient insert capable of reaching 1.5 T/m to measure metabolite ADC up to 665 Hz in the rat brain, in order to approach free intracellular diffusion.METHODS
A 9-cm inner diameter gradient coil capable of reaching 1.5 T/m in 250 µs along each axis was specially manufactured (Tesla Engineering Ltd, Sussex, England) to fit within a horizontal 7 T Agilent scanner. Trapezoidal cosine waveforms1 were implemented to maximize diffusion-weighting while ramping gradients at maximal rate, and inserted in an asymmetric LASER sequence2,3. In order to detect some residual macromolecule signal to discard datasets potentially corrupted by motion artifact3, we needed to keep TE “short”, hence gradient waveform duration was limited to 30 ms, resulting in TE=80 ms (considering the two waveforms surrounding the first refocusing pulse). In vivo experiments were performed on female rats anesthetized with isoflurane, using N=5 or N=20 periods per waveform (corresponding to 156 and 665 Hz, as determined by computation of the exact gradient modulation spectra), at b=0.9 ms/µm². Scan-to-scan frequency and phase correction were performed, and spectra were analyzed with LCModel.RESULTS
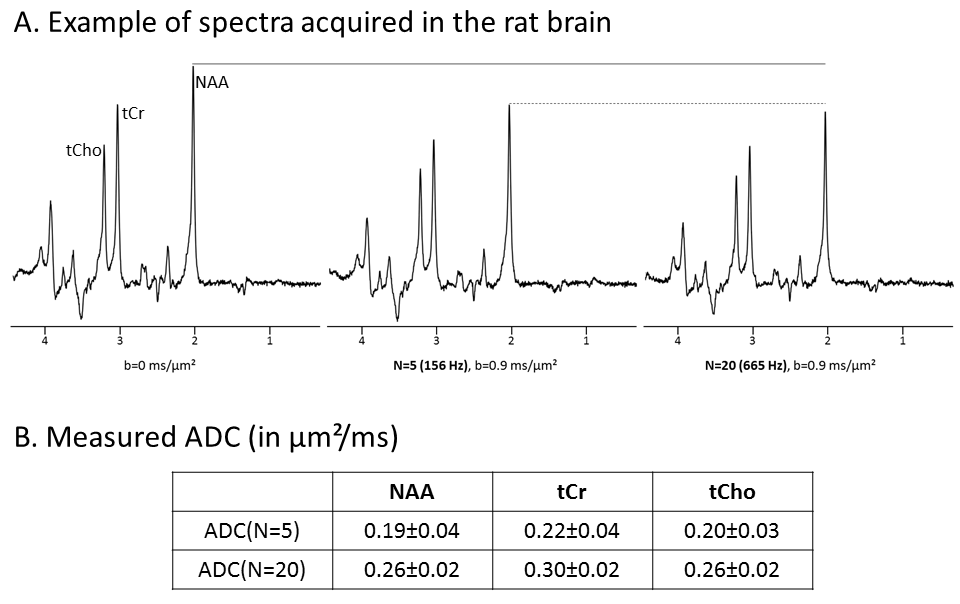
Typical in vivo spectra are shown in Fig.1A, demonstrating the good quality and absence of spectral distortion even at N=20 where gradients were used at almost full strength. As assessed by quantifying attenuated MM signal at 0.9 ppm3, we found that two datasets (out of six) were corrupted by motion artefact at N=5, and no dataset (out of ten) was corrupted at N=20. ADC values (after removing corrupted datasets at N=5) for NAA, total creatine tCr and choline compounds tCho are given in Fig.1B. As expected for metabolites experiencing less and less restriction, ADC are increasing (by ~40%) when going from N=5 and N=20.DISCUSSION
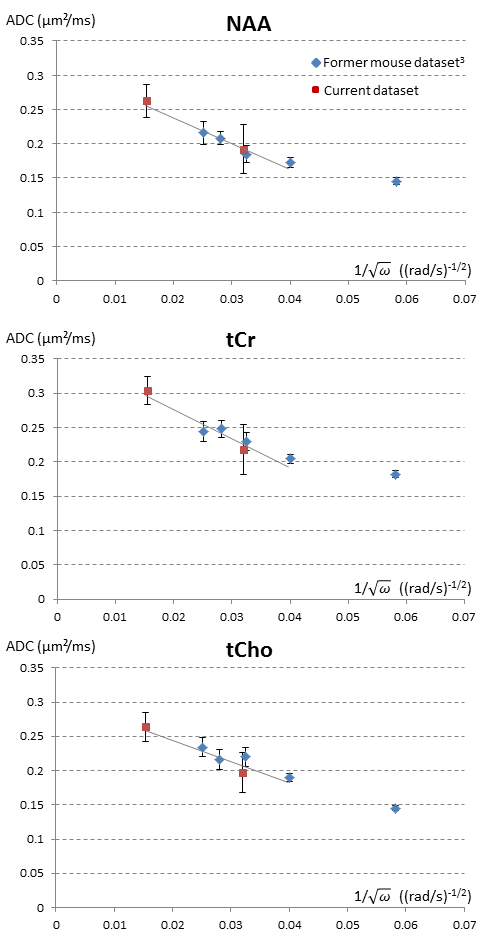
While previous in vivo MRI and MRS studies using OG in the brain have reported maximal frequencies of ~250 Hz, here we were able to reach unprecedentedly high frequency (665 Hz) thanks to the very strong gradients. It is particularly interesting to compare the current data with data recently obtained using a similar approach (OG LASER sequence with “short” TE to detect MM and discard motion-corrupted dataset) in the mouse brain3. As shown in Fig.2, when plotted as a function of 𝜔-1/2, both datasets are well consistent, i.e. current data at N=5 agree well with former mouse data, and data at N=20 nicely extend the trend towards higher ADC values. Going one step further and assuming that we are in the Mitra regime, we can perform a linear fit of ADC as a function of 𝜔-1/2 to extract the surface-to-volume ratio S/V and the free intracellular diffusivity D0 in a “model-free” manner, using the universal formula valid for OG4. We exclude the point acquired in the mouse brain at the lowest frequency, as it degrades the linear fit (presumably because the Mitra regime is not reached yet). The fit yields D0=0.31 µm²/ms and S/V=2.86 µm-1 for NAA (R²=0.96); D0=0.36 µm²/ms and S/V=2.53 µm-1 for tCr (R²=0.93); D0=0.31 µm²/ms and S/V=2.39 µm-1 for tCho (R²=0.89). Assuming simple cylindrical geometries, these S/V ratios respectively correspond to radii of 0.70, 0.79 and 0.84 µm, which are realistic for typical neuronal and glial fibers. Estimated D0 are in good agreement with values extracted from modeling of high-b data in a cylindrical model5, but lower than our previous estimates based on modeling of OG data in a cylindrical model at lower frequencies (<250 Hz)2,3. As the current estimates do not rely on a geometrical model and take advantage of data acquired at unprecedentedly high frequencies, we tend to trust them more. By comparison with metabolite diffusion measured in water at 37°C, they correspond to an intracellular viscosity ~2.7-fold larger than pure water.CONCLUSION
Using a unique gradient and OG MRS, we could measure metabolite ADC at 665 Hz (corresponding to 0.21-ms diffusion time in the Mitra limit4,6), thus providing updated and presumably more reliable estimates of free intracellular diffusivity and viscosity.Acknowledgements
This work was funded by the European Research Council (grant #336331).References
1. Van AT, Holdsworth SJ, Bammer R. In vivo investigation of restricted diffusion in the human brain with optimized oscillating diffusion gradient encoding. Magn Reson Med 2014;71(1):83-94.
2. Marchadour C, Brouillet E, Hantraye P, Lebon V, Valette J. Anomalous diffusion of brain metabolites evidenced by diffusion-weighted magnetic resonance spectroscopy in vivo. Journal of cerebral blood flow and metabolism 2012;32(12):2153-2160.
3. Ligneul C, Valette J. Probing metabolite diffusion at ultra-short time scales in the mouse brain using optimized oscillating gradients and “short” echo time diffusion-weighted MR spectroscopy. NMR in biomedicine, in press.
4. Novikov DS, Kiselev VG. Surface-to-volume ratio with oscillating gradients. J Magn Reson 2011;210(1):141-145.
5. Palombo M, Ligneul C, Valette J. Modeling diffusion of intracellular metabolites in the mouse brain up to very high diffusion-weighting: diffusion in long fibers (almost) accounts for non-monoexponential attenuation. Magn Reson Med, in press.
6. Lemberskiy G, Baete SH, Cloos MA, Novikov DS, Fieremans E. Validation of Surface-to-Volume Ratio derived from Oscillating Gradient Spin Echo on a clinical scanner using anisotropic fiber phantoms. Proc ISMRM 2016, Singapore (#13).
Figures