1075
Quantitative IVIM-DWI and DCE-MRI for assessment of bowel inflammation in Crohn’s disease1Translational and Molecular Imaging Institute, Icahn School of Medicine at Mount Sinai, New York, NY, United States, 2Division of Gastroenterology, Icahn School of Medicine at Mount Sinai, New York, NY, United States, 3Department of Genetics and Genomic Sciences, Icahn School of Medicine at Mount Sinai, New York, NY, United States
Synopsis
The aims of this study were to quantify intravoxel incoherent motion DWI (IVIM-DWI) and DCE-MRI metrics and to assess the correlation between IVIM-DWI and DCE-MRI metrics in abnormal and normal appearing bowel segments in Crohn’s disease (CD) patients. ADC was significantly reduced in abnormal vs. normal bowel wall segments. A significant negative correlation between Ktrans (measured with DCE-MRI) and perfusion fraction f (measured with IVIM-DWI) was observed. Our preliminary results suggest that IVIM-DWI could potentially be used for simultaneous assessment of perfusion and diffusion in the bowel wall of CD patients, which needs to be verified in a larger cohort of patients.
Purpose
Quantitative MRI, specifically employing DCE-MRI perfusion1 and diffusion2 measurements, is promising for noninvasive assessment of the degree of inflammation in Crohn’s disease (CD). Intravoxel incoherent motion DWI (IVIM-DWI) allows for simultaneous assessment of perfusion and diffusion without the need for contrast injection. IVIM-DWI could therefore potentially be used to assess the extent of inflammation in diseased bowel segments in CD patients using a single MRI acquisition. The aims of our preliminary study were to quantify IVIM-DWI and DCE-MRI metrics and to assess the correlation between IVIM-DWI and DCE-MRI metrics in diseased and unaffected bowel segments in CD patients.Methods
Patients
7 initial CD patients (M/F 4/3, mean age 43 y) were included in this prospective, IRB-approved study. Patients underwent imaging at 1.5T as part of their clinical care. IVIM-DWI and DCE-MRI sequences were added to the protocol.
MRI acquisition and analysis
Patients were asked to fast for 6 hours and to drink 1.5 L of Volumen before the exam for bowel distension. 1 mg of glucagon was injected intramuscularly to suppress peristaltic motion. IVIM-DWI acquisition was performed using a SS SE-EPI sequence (b 0, 25, 50, 75, 100, 200, 400 and 800 s/mm2, TE 82 ms, TR 5400 ms, FOV 380x290 mm2, matrix 192x148, slice thickness 7 mm, 24 slices). DCE-MRI was performed using a 3D FLASH sequence (FA 11.5°, TE 1.1 ms, TR 2.6 ms, FOV 380x260 mm2, matrix 384x264, slice thickness 3 mm, 72 slices, temporal resolution ~4.5 s) during which 0.1 mmol/kg Gd-DOTA (Dotarem, Guerbet) was intravenously injected. The DCE-MRI acquisition measured the tissue contrast uptake in the first 4 minutes after injection, with a short interruption at 1 minute after injection for a regular post-contrast T1-VIBE acquisition for clinical assessment. A T1 map used for DCE-MRI parameter estimation was acquired using a variable flip angle 3D FLASH acquisition before the DCE-MRI sequence. ROIs were drawn on the IVIM-DWI, DCE-MRI and T1 images in abnormal bowel segments (identified by increased wall thickness) and in normal-appearing bowel segments. IVIM-DWI and DCE-MRI parameters were derived from mean signal curves in the ROIs. IVIM-DWI parameters perfusion fraction f, pseudodiffusion coefficient D* (reflecting perfusion) and diffusion coefficient D were estimated using a Bayesian fitting algorithm. ADC was estimated from a monoexponential fit. Tofts modeling was used to estimate pharmacokinetic parameters transfer contrast Ktrans, rate constant kep and extravascular extracellular volume fraction ve=Ktrans/kep from the DCE-MRI curves.
Statistical analysis
Differences between MRI parameters of normal and abnormal bowel segments were tested using Wilcoxon signed-rank tests. Spearman correlation coefficients between IVIM-DWI and DCE-MRI parameters in grouped normal and abnormal bowel wall segments were assessed.
Results
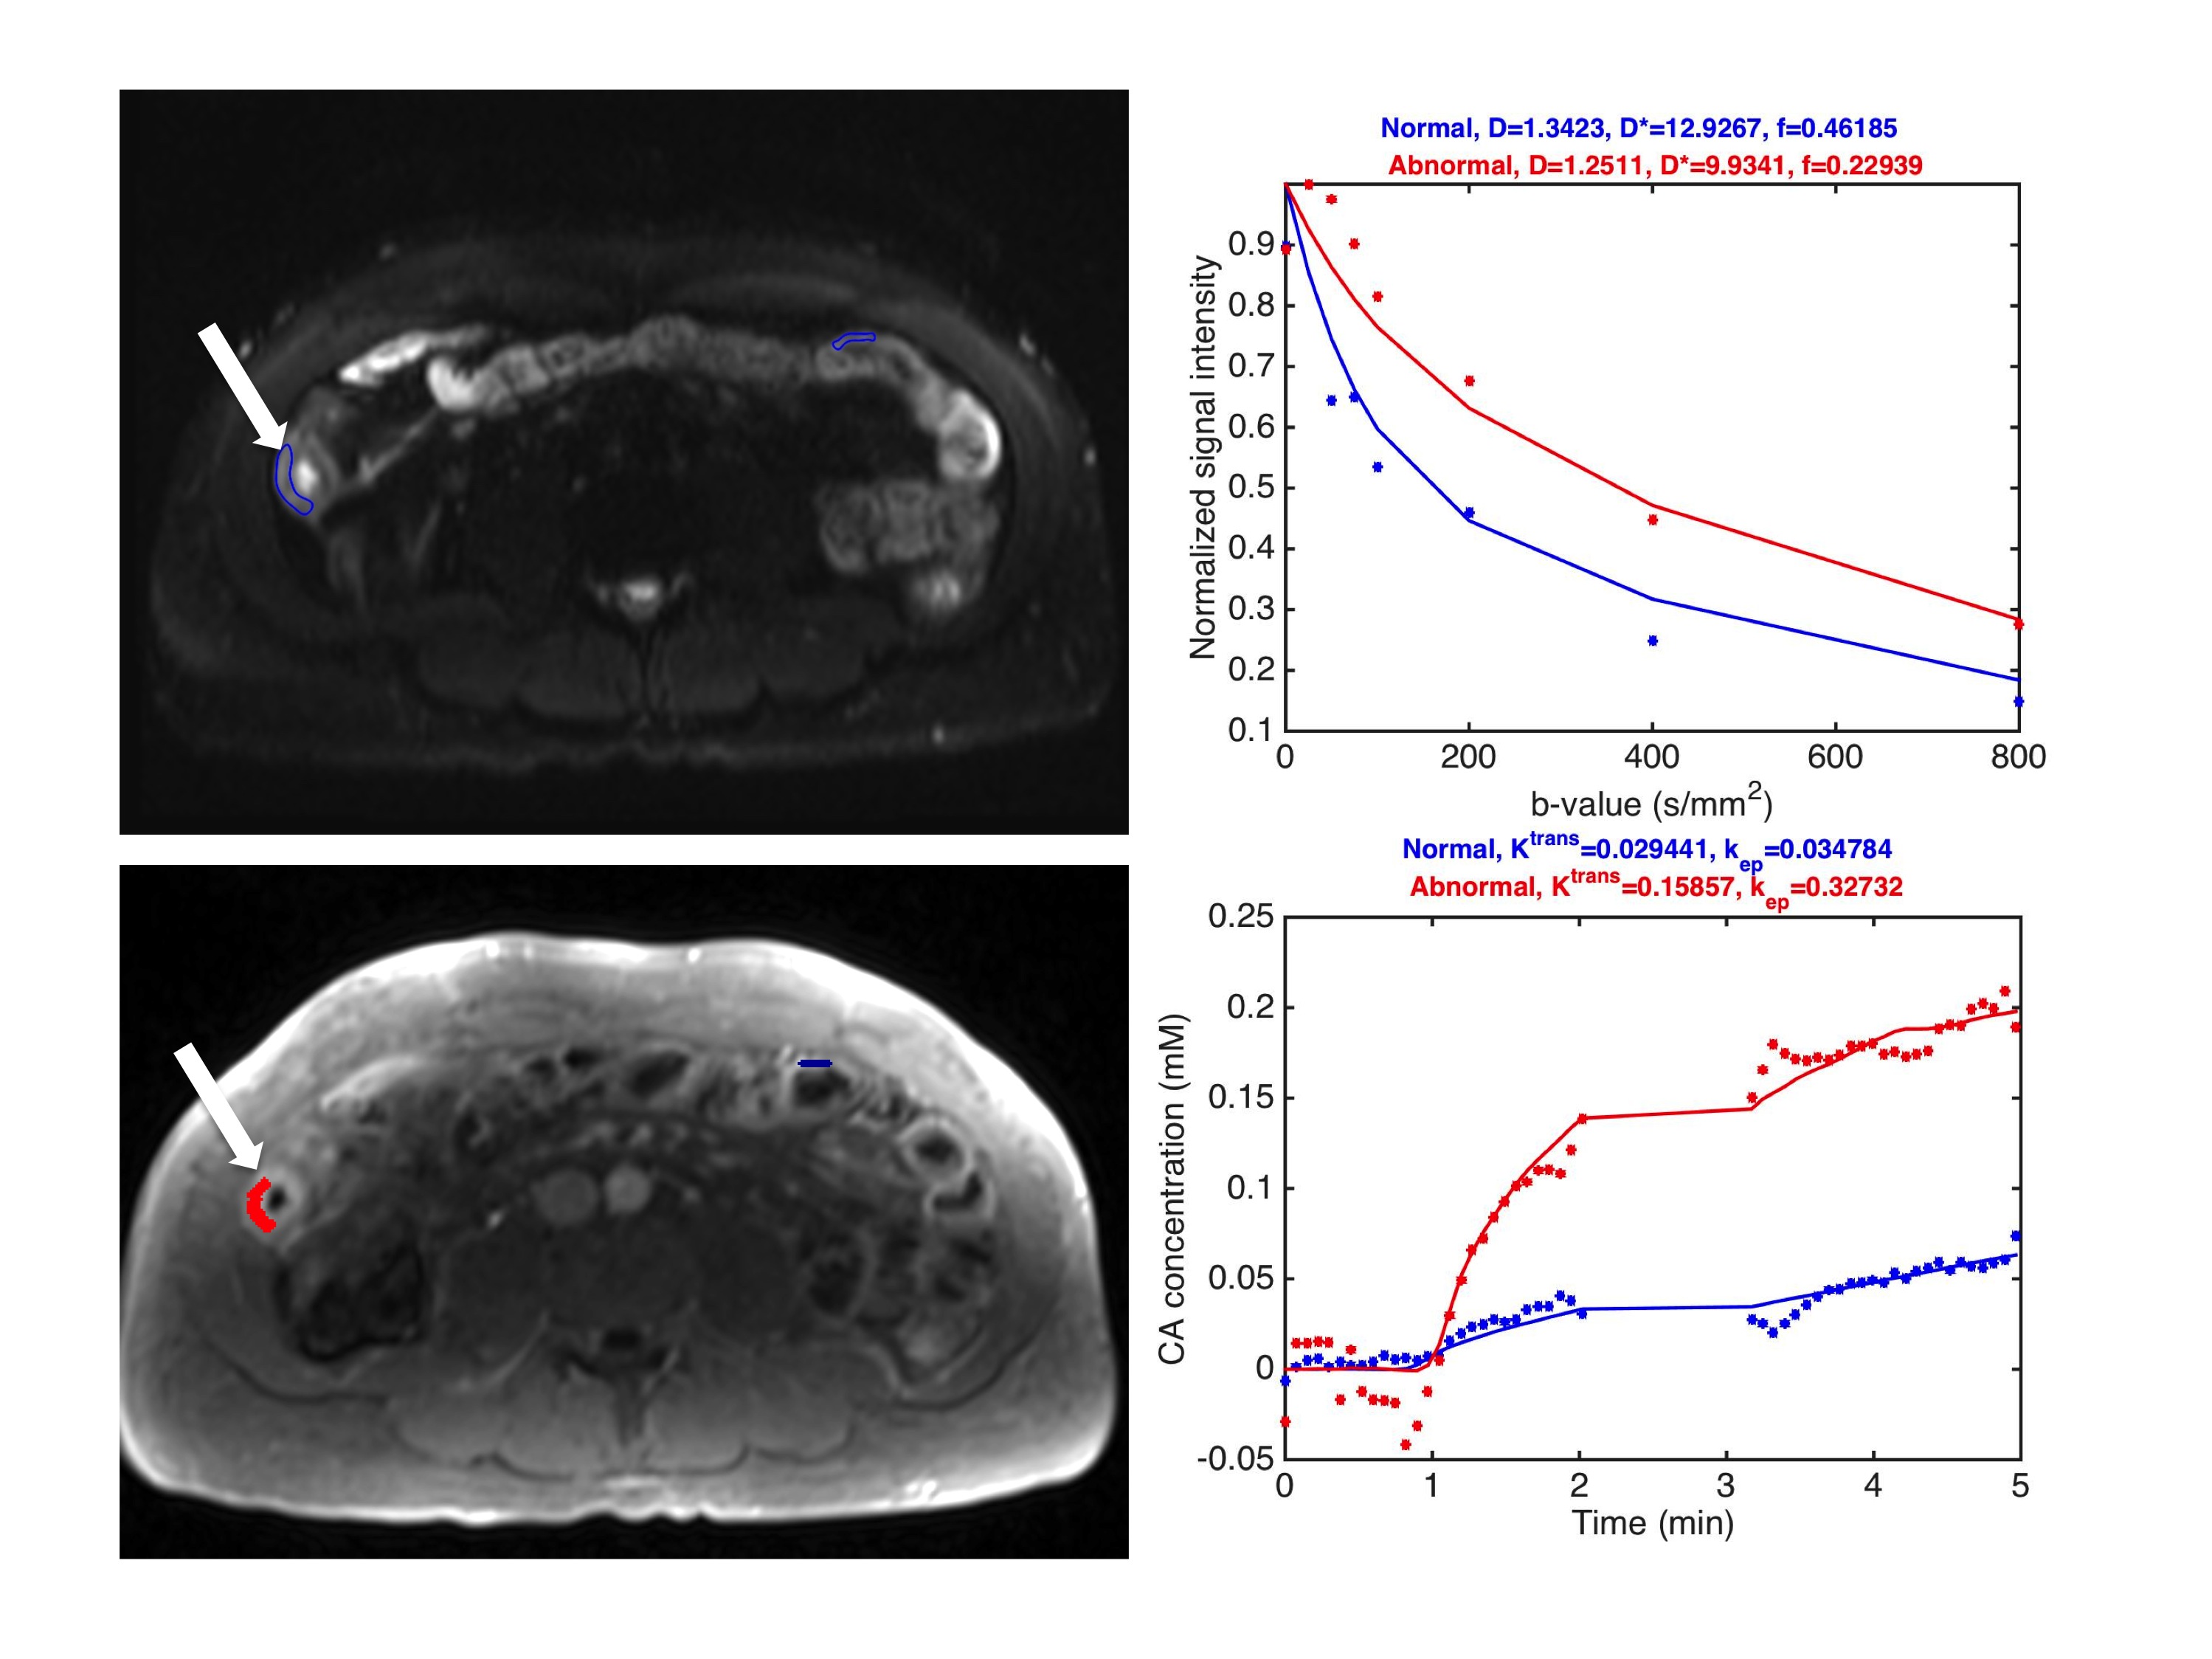
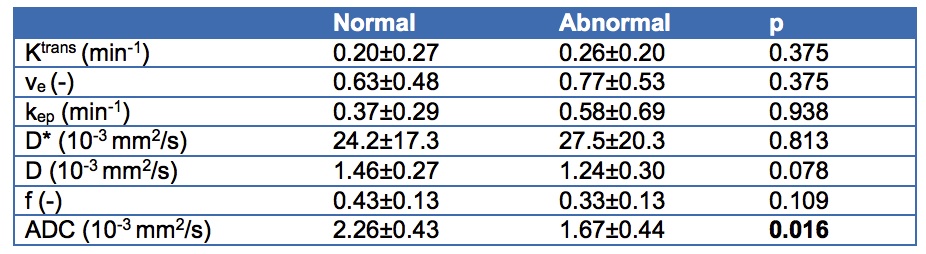
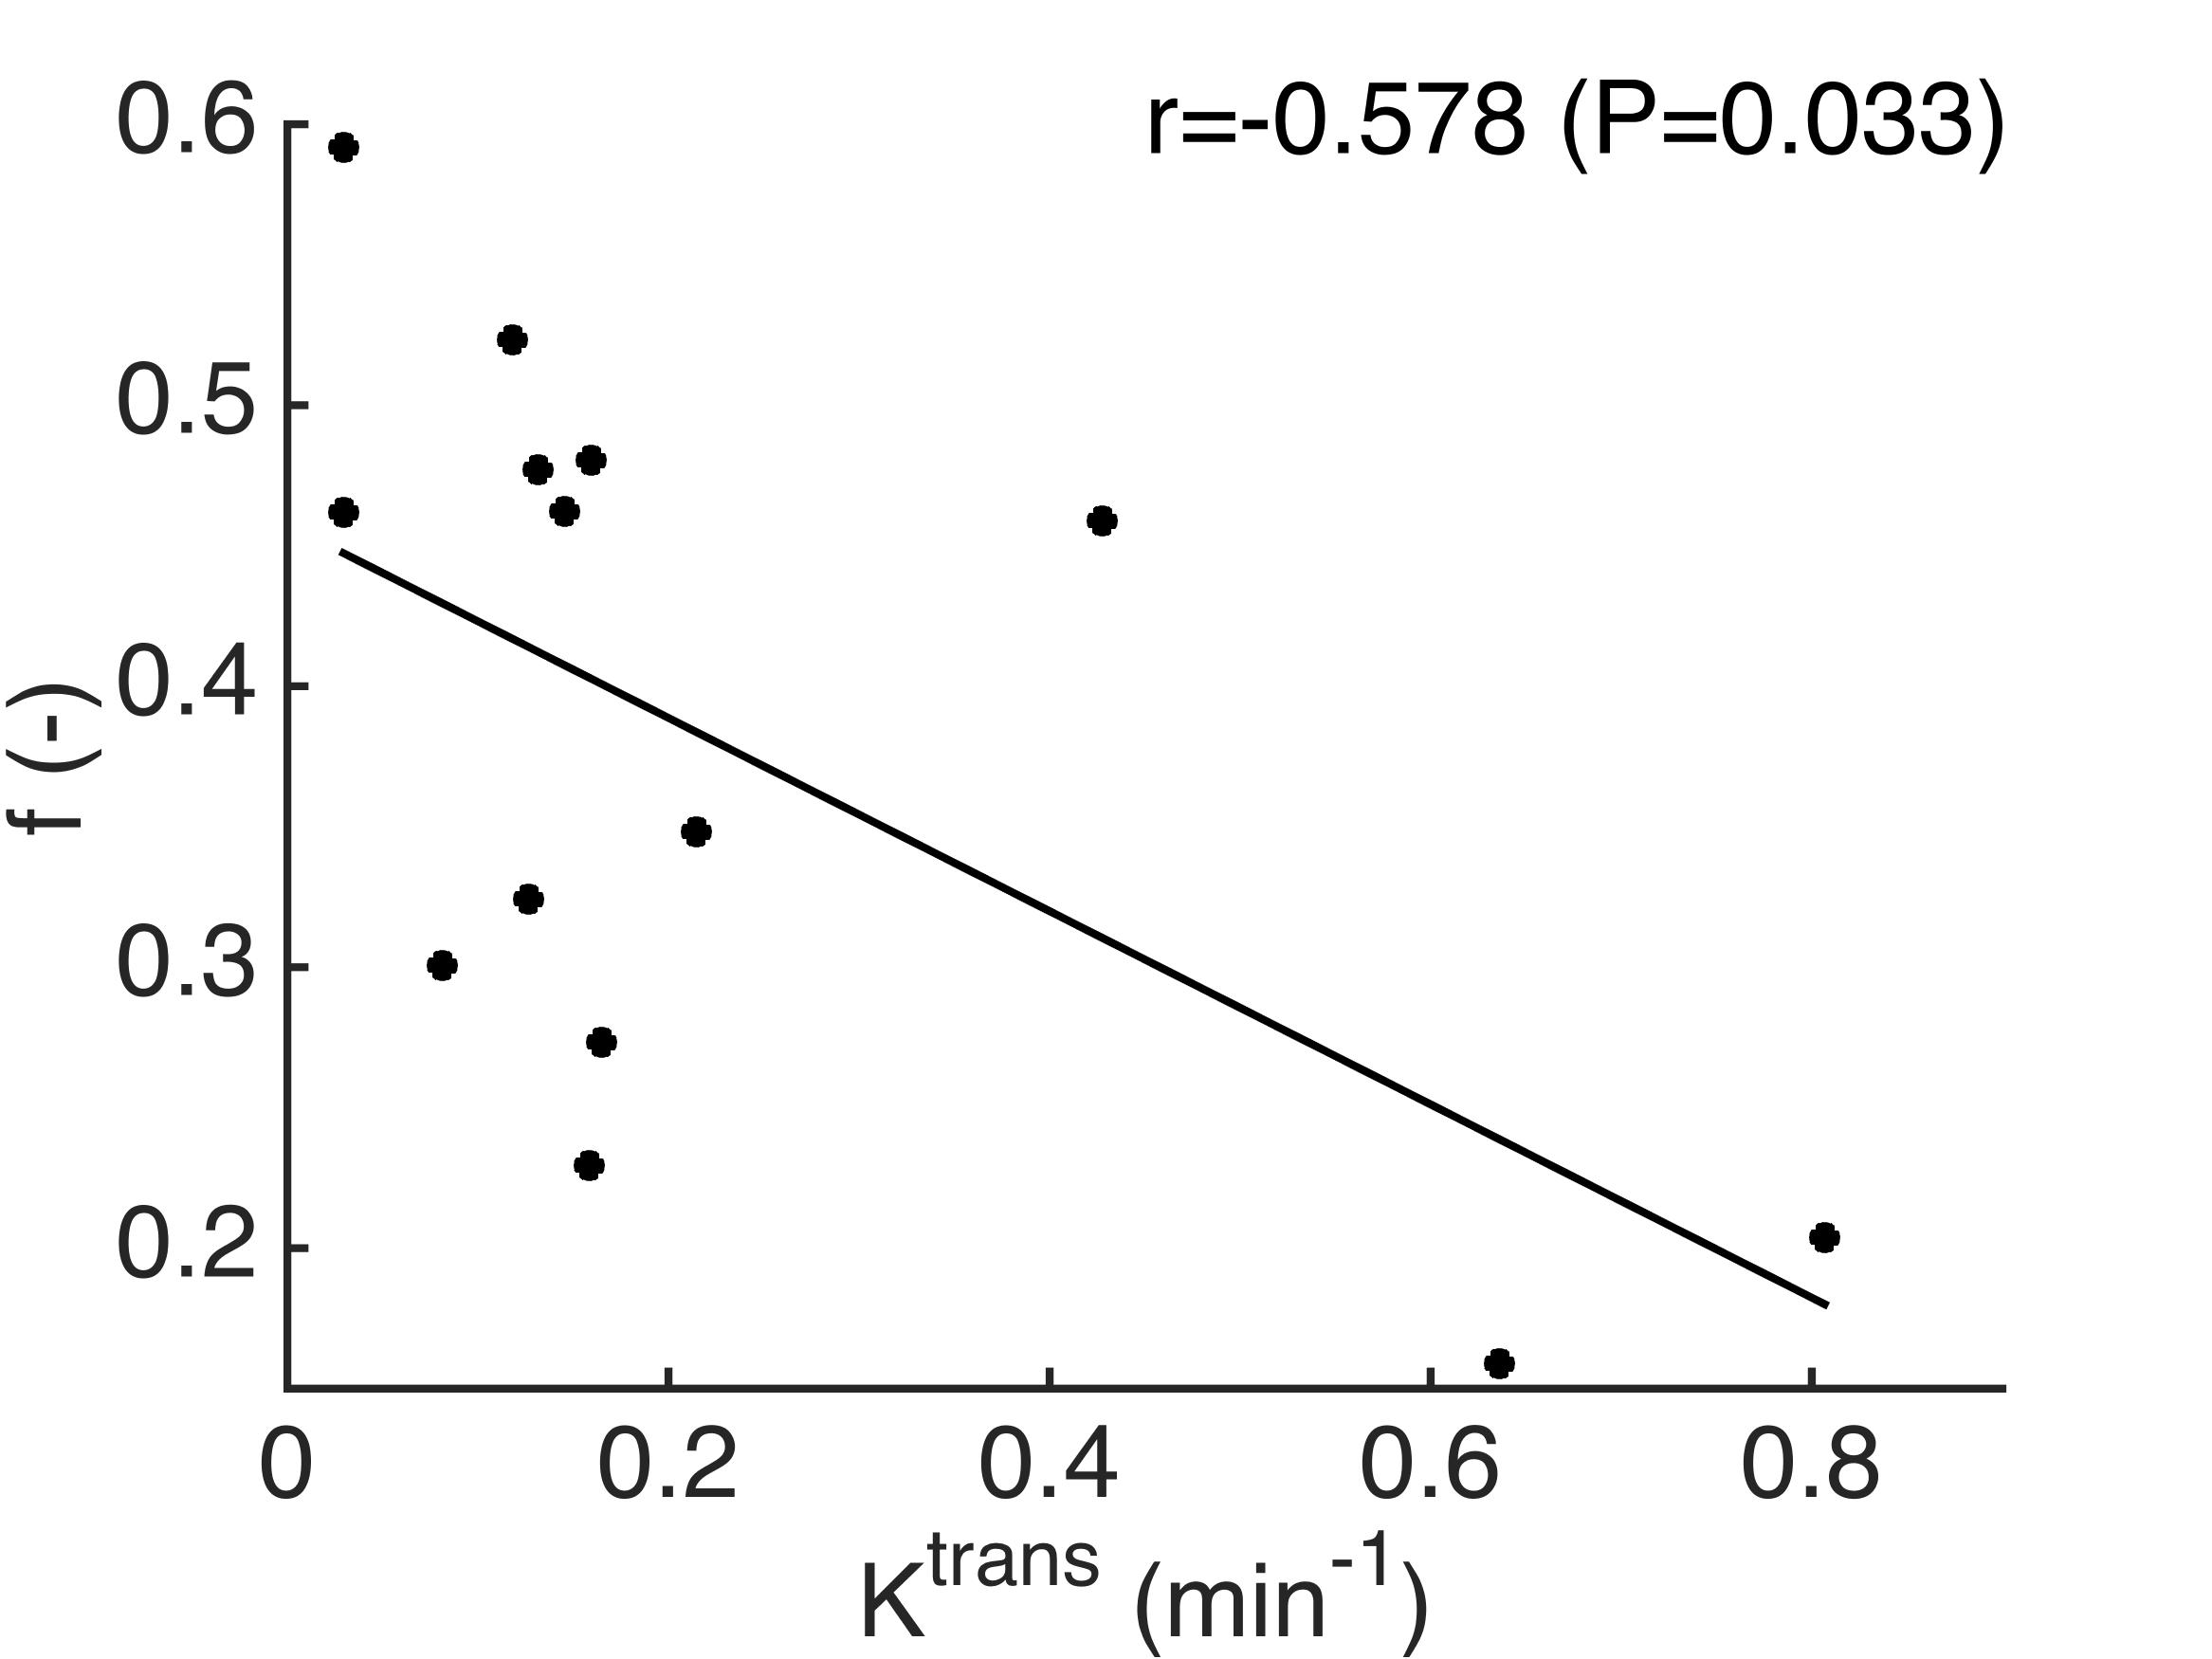
Figure 1 shows a representative example of IVIM-DWI and DCE-MRI images and fitted curves. Abnormal bowel segments were generally characterized by low diffusion and high perfusion. Table 1 shows average parameter values in the normal and abnormal bowel wall ROIs. While Ktrans and D* were on average higher in the abnormal vs. normal segments, these differences did not reach statistical significance (p>0.375). Only ADC was significantly lower in diseased vs. normal-appearing bowel segments. A significant negative correlation between Ktrans and f was observed in the grouped normal and abnormal bowel segments (r -0.578, p=0.033, Figure 2).Discussion and Conclusion
The observed negative correlation between Ktrans and f in diseased bowel segments of CD patients seems paradoxical, since it suggests that a lower vascularity (lower f) is associated with higher flow and/or permeability (higher Ktrans). However, our results are in agreement with an earlier preliminary report on IVIM-DWI in pediatric CD patients, in which it was observed that f was lower in enhancing, diseased segments3. A reduction in microvascular volume in affected bowel segments in patients with inflammatory bowel disease, including CD, has been demonstrated previously by examination of postoperative barium sulfate-perfused bowel segments4. The Ktrans increase in affected segments is likely related to an increased blood flow to supply the diseased, inflamed tissue. The observed significant correlation between DCE-MRI and IVIM-DWI suggests that IVIM-DWI may be used to assess perfusion and diffusion in the bowel wall of CD patients without need for injection of contrast agent, which needs to be verified in a larger cohort of patients. The absence of significant differences between DCE-MRI and IVIM-DWI (except ADC) parameters in abnormal and normal bowel wall segments is probably related to the small cohort of patients in this preliminary study. Future work thus includes the recruitment of more patients as well as assessment of correlation between the MRI findings and advanced histopathology.Acknowledgements
We would like to acknowledge the support of Guerbet, LLC.References
1 Oto A, Fan X, Mustafi D, et al. Quantitative analysis of dynamic contrast enhanced MRI for assessment of bowel inflammation in Crohn's disease pilot study. Acad Radiol. 2009;16(10):1223-30.
2 Ream JM, Dillman JR, Adler J, et al. MRI diffusion-weighted imaging (DWI) in pediatric small bowel Crohn disease: correlation with MRI findings of active bowel wall inflammation. Pediatr Radiol. 2013;43(9):1077-85.
3 Freiman M, Perez-Rossello JM, Callahan MJ, et al. Characterization of fast and slow diffusion from diffusion-weighted MRI of pediatric Crohn's disease. J Magn Reson Imaging. 2013;37(1):156-63.
4 Carr ND, Pullan BR, Schofield PF. Microvascular studies in non-specific inflammatory bowel disease. Gut 1986; 27: 542–549.
Figures