1074
Parametric mapping with spatial registration of abdominal MRI is feasible and may inform upon the spatial distribution of fibrosis in intestinal lesions of patients with Crohn’s Disease1Genentech Inc, South San Francisco, CA, United States, 2Department of Radiology, Hospital Clínic de Barcelona, IDIBAPS, University of Barcelona, Barcelona, Spain
Synopsis
Parametric mapping may provide estimates of the degree and spatial distribution of fibrosis in Crohn’s Disease (CD) patients but is subject to respiratory and peristaltic motion. Validation of out-of-the-box registration strategies and their impact on quality and robustness of parametric maps-delayed gain of enhancement (DGE) and magnetization transfer ratio (MTR) were evaluated.
Introduction
In Crohn’s Disease (CD), a lack of therapeutic options results in 40-71% of patients to undergo bowel resection surgery within 10 years of diagnosis, mostly due to fibrostenotic strictures.1 Development of alternative therapies is hampered by a lack of assessment tools to investigate the nature, characteristics and longitudinal progression of the strictures. Magnetic Resonance Enterography (MRE) is a diagnostic tool for strictures, and development of parametric mapping (PM) techniques in abdominal imaging may help identify phenotypical characteristics of strictures and facilitate drug development. For example, it has been suggested that the degree of fibrosis can be assessed by region-of-interest (ROI) measurement of MRE metrics such as gadolinium contrast delayed gain of enhancement (DGE) and magnetization transfer ratio (MTR), which have been associated with the presence of fibrosis in surgically resected lesions.2-4 PM may provide additional information not only on the degree, but also the heterogeneity and spatial distribution of fibrotic tissue. PM of the abdomen is hindered by respiratory and peristaltic motion.5 The purpose of this study was to evaluate a PM processing pipeline with image registration by comparing measurements obtained with the PM approach against a manual, ROI-based approach.Methods
Informed consent was obtained from all subjects involved in a prospective multicenter clinical trial evaluating the ability of multi-modal MRI to detect fibrosis in CD. 51 patients with fibrostenotic CD were enrolled from 6 centers in Europe. Histological samples were taken from 56 surgically resected segments. Image data were obtained at 1.5 or 3.0 T and included fast breath-hold 3D GRE coronal T1-weighted, fat-suppressed series that were acquired prior to IV administration of a gadolinium-based contrast agent, and approximately 70 seconds (SI70s) and 7 minutes (SI7min) post injection. Magnetization transfer contrast (MTC) series were also acquired, consisting of axial 2D T1-weighted spoiled gradient recalled echo (SGPR) images acquired with and without a magnetization transfer prepulse. The optimal registration scheme, identified previously5 as FSL’s non-linear registration tool FNIRT,6,7 was used to co-register the corresponding image types, where SI70s and MTCno-prepulse were defined as the reference images and SI7min and MTCprepulse were considered the target images. DGE maps were defined as $$$DGE = (SI_{7min}-SI_{70s})/{SI_{70s}}$$$. MTR maps were computed as $$$MTR = 100*({1-MTR_{prepulse}}/{MTR_{no-prepulse}})$$$. MTR PMs were normalized to MTR of muscle as follows: $$$MTR_{norm} = 50*(MTR/{MTR_{muscle}})$$$, and will henceforth simply be referred to as MTR. The quality of spatial registration was visually assessed within a 3x3x3 cm3 ROI surrounding the target stricture; each case was rated: ‘poor,’ ‘fair,’ or ‘good’ based on the overall alignment and overlap of the gut wall within the target stricture. Cases that were found to be fair or good were considered ‘passing.’
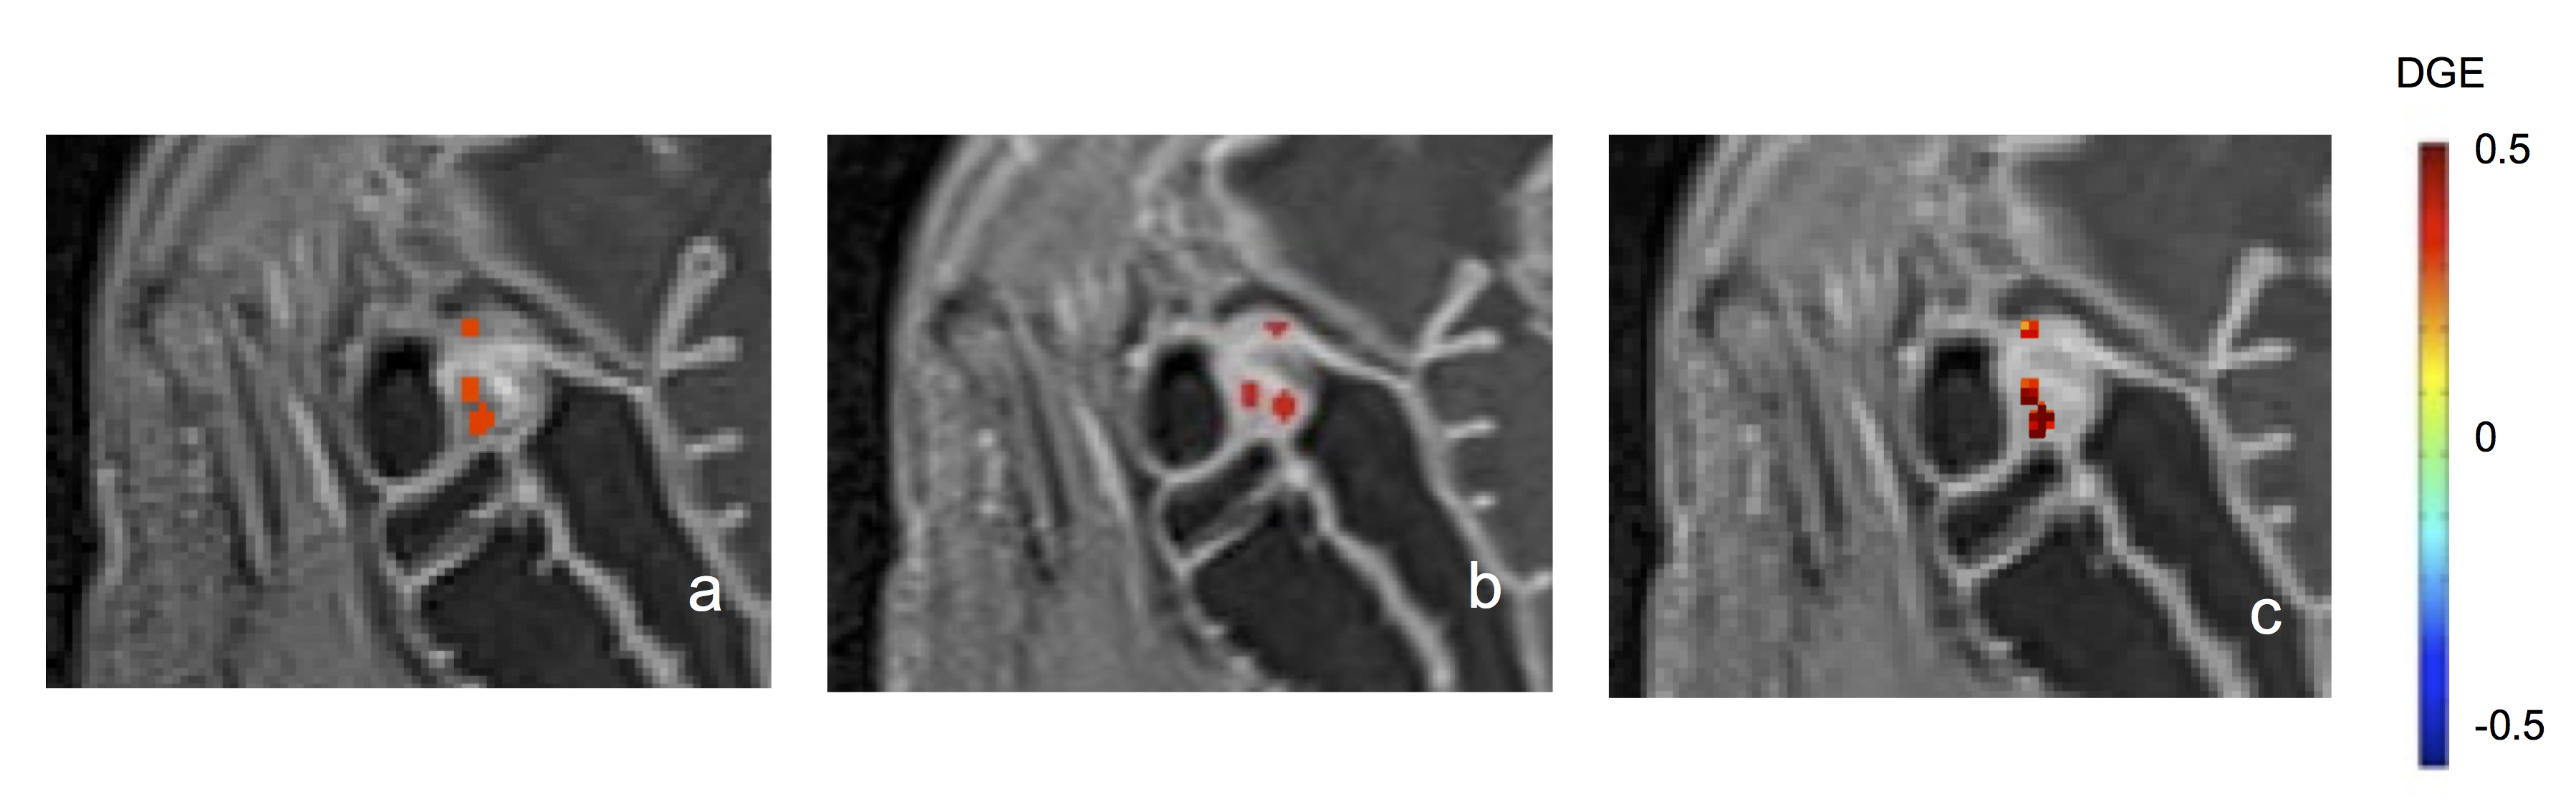
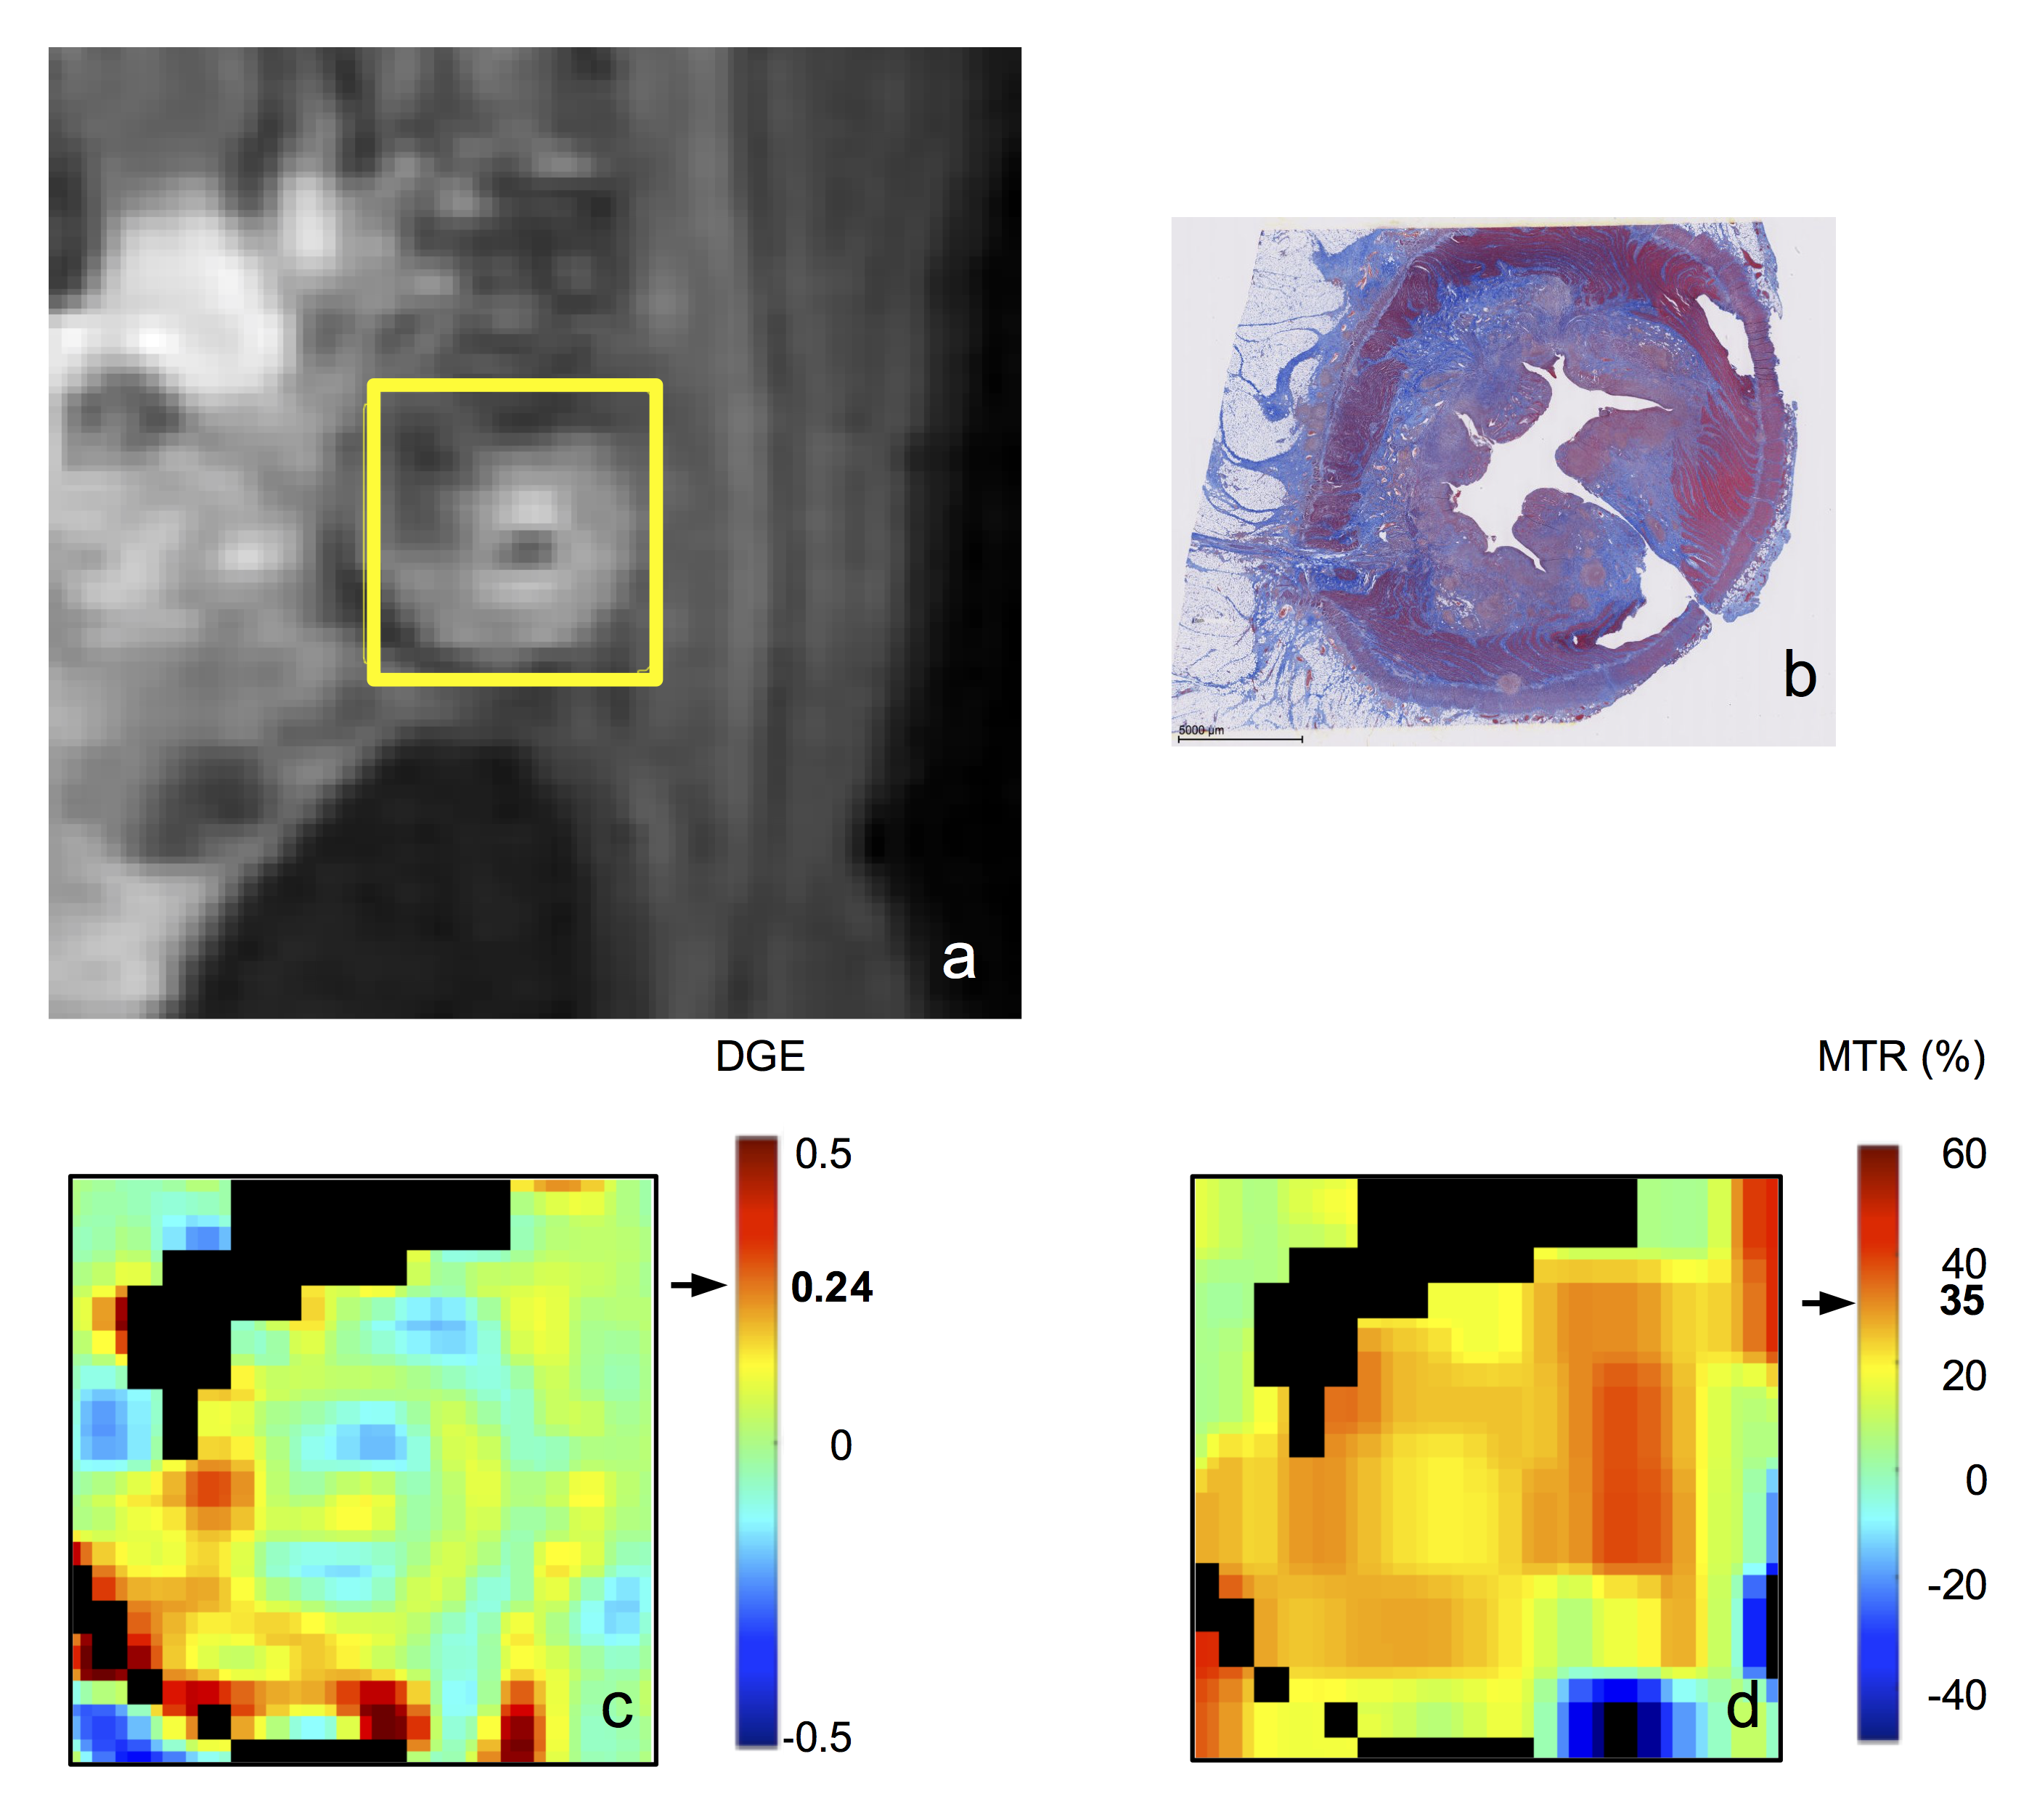
An expert radiologist provided a centralized read of the contrast-enhanced T1-weighted and MTC scans and respective DGE and MTR measurements by identifying multiple ROIs along the strictured bowel wall of each reference and corresponding target image (e.g. figure 1A,B). DGE and MTR determined by central reader were then compared to values measured directly from the associated PMs, by measuring mean PM values within ROIs defined by central reader on the reference image. To explore local heterogeneity of fibrosis, MTR and DGE PMs were co-registered and cross-sectional PMs of the gut wall were generated and visually matched to histology.
Results
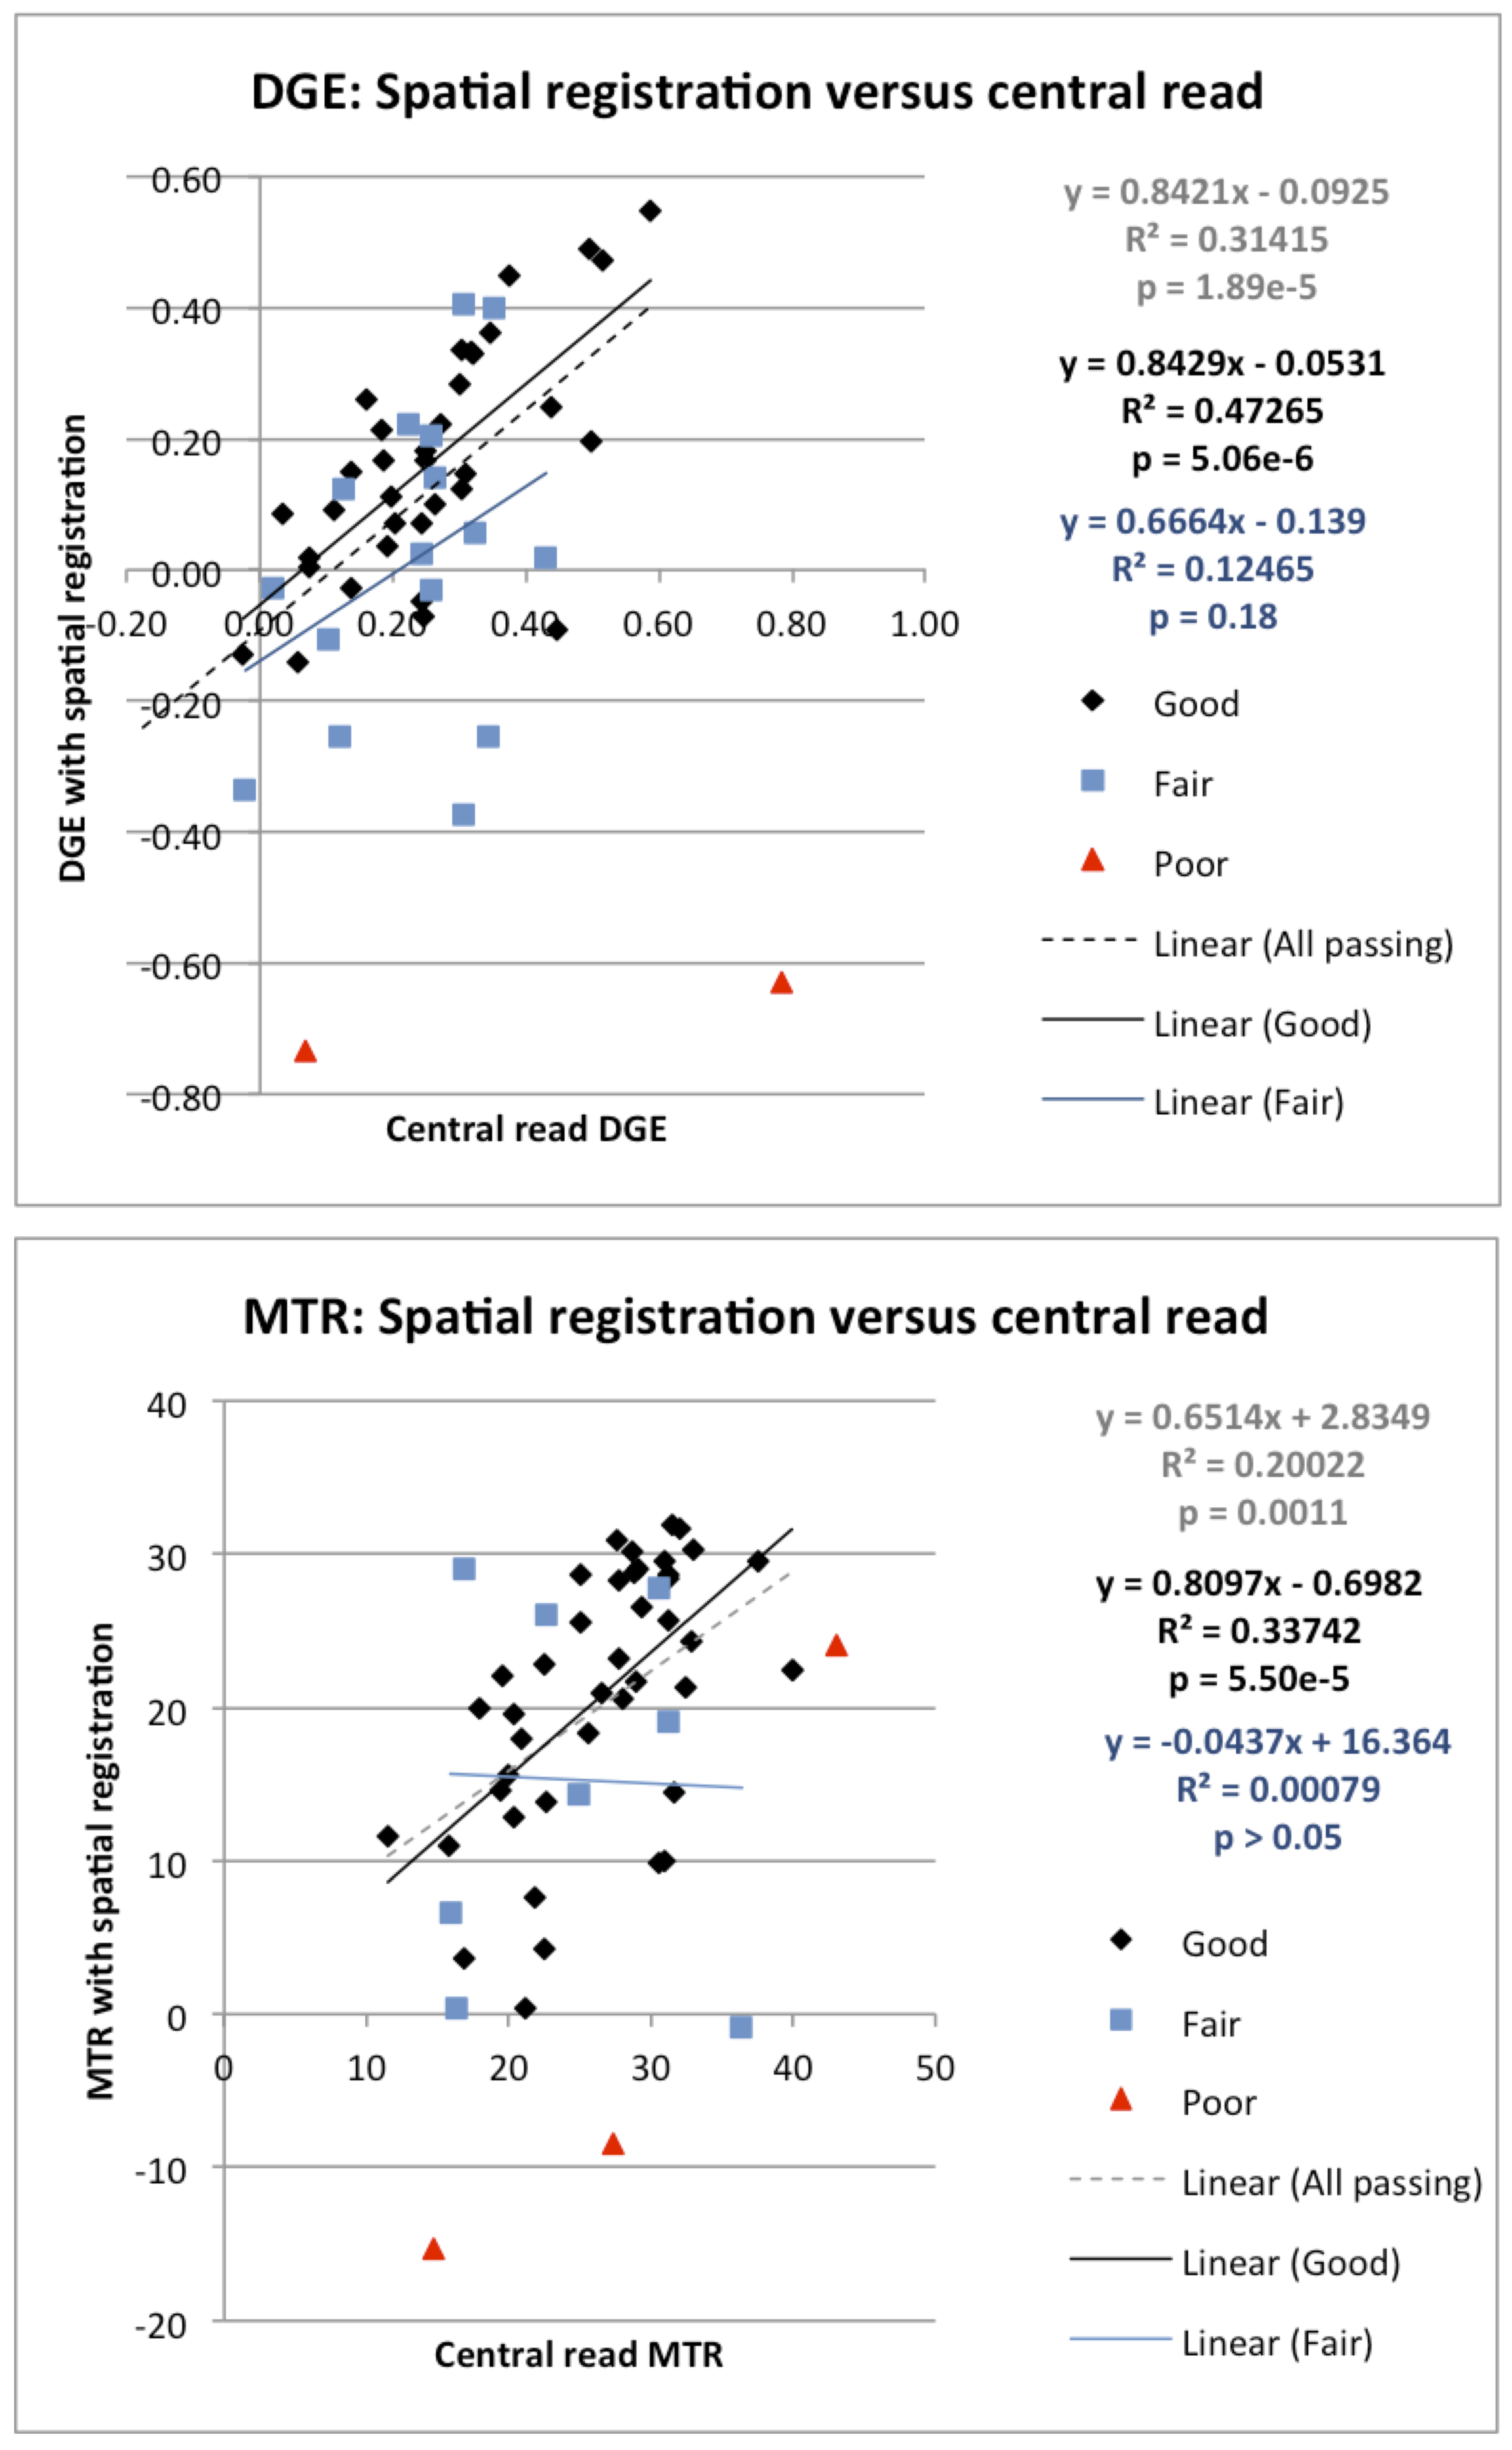
PM values obtained with spatial registration were in concordance with DGE and MTR values obtained from central read measurements (figure 2). When spatial registration succeeded (‘passing’), the mean DGE determined post-spatial registration correlated with DGE determined by central read (R2 = 0.31, p < 0.0001). When spatial registration was not utilized, no association was observed between DGE values generated via PM and central read (R2 = 0.016, p = 0.37). Similarly, a stronger association was observed between MTR measured by central read and measured with PM spatial registration (R2 = 0.20 p < 0.01) than without spatial registration (R2 = 0.12, p = 0.015). Co-registration of DGE and MTR PMs to obtain spatially-matched, cross-sectional views visually demonstrates local heterogeneity in degree of fibrosis (figure 3).Conclusion
The use of DGE and MTR PMs with spatial registration is effective, as evidenced by the high concordance between measurements obtained with the PM and the ROI-based approach with central read. Though further evaluation of these registrational methods in a larger dataset is necessary, using 3D parametric mapping can yield quantitative measures such as extent and degree of fibrosis. Additionally, a cross-sectional view of each PM provides an indication of the local heterogeneity of disease, and may help to better spatially match MRE and histological samples in the future.Acknowledgements
No acknowledgement found.References
1. Rieder, F et al. “Crohn’s Disease Complicated by Strictures: A Systematic Review.” Gut 2013;62.7: 1072–1084.
2. Adler J, Swanson SD, Schmiedlin-Ren P, et al. Magnetization transfer helps detect intestinal fibrosis in an animal model of Crohn disease. Radiology 2011;259(1):127-35.
3. Pazahr S, Blume I, Frei P, et al. Magnetization transfer for the assessment of bowel fibrosis in patients with Crohn's disease: initial experience. MAGMA 2013;26(3):291-301.
4. Rimola J, Planell N, Rodriguez S, et al. Characterization of inflammation and fibrosis in Crohn's disease lesions by magnetic resonance imaging. Am J Gastroenterol 2015;110(3):432-40.
5. Li E, Lu T, Coimbra A, De Crespigny A. Spatial registration improves parametric mapping of abdominal MRI and may allow assessment of extent of fibrosis in intestinal lesions of patients with Crohn’s Disease [abstract]. In: Proceedings of the 24th Annual Meeting of the International Society for Magnetic Resonance in Medicine; 2016 May 7-13; Singapore: ISMRM 2016. Abstract 4299.
6. Woolrich MW, Jbabdi S, Patenaude B, et al. Bayesian analysis of neuroimaging data in FSL. NeuroImage 2009;45:S173-86.
7. Andersson JLR, Jenkinson M, Smith S. Non-linear registration, aka spatial normalisation. FMRIB technical report TR07JA2. 2010. http://www.fmrib.ox.ac.uk/datasets/techrep/.
Figures