1073
Preliminary Analysis of Longitudinal Functional MRI Data in Diabetic Nephropathy and Healthy Controls1Northshore University HealthSystem, Evanston, IL, United States, 2Pritzker School of Medicine, University of Chicago, Chicago, IL, United States, 3Biomedical Engineering, Northwestern Univerisity, Evanston, IL, United States, 4Research Institute, Northshore University HealthSystem, Evanston, IL, United States, 5University of Chicago, Chicago, IL, United States
Synopsis
BOLD, Diffusion and ASL MRI data were acquired in diabetic nephropathy (DN) patients with stage-3 chronic kidney disease and healthy subjects. Consistent with the chronic hypoxia model for progression of DN, kidneys in subjects with DN had significantly lower blood flow and medullary R2* compared to controls. Intra-subject coefficient of variation (CV) for R2* and ADC was less than 10% in the control group when comparing baseline and 18 month data, suggests R2* and ADC measurements were reproducible over 18 month. CV was higher for blood flow.
INTRODUCTION
Diabetic nephropathy is a progressive kidney disease which accounts for about 40% of new cases of end stage of renal disease 1. Over the last decade, the role of chronic hypoxia in the progression of chronic kidney disease (CKD) has gained attention mostly based on pre-clinical data 2. Blood oxygenation level dependent (BOLD) MRI is the only known non-invasive method currently available to evaluate relative oxygenation status of the kidney. Chronic hypoxia theory also suggests the cause for the increased hypoxia is due to reduced blood supply. Arterial spin labeling (ASL) based renal perfusion MRI has shown reduced blood flow in CKD 3. Hypoxia triggers fibrogenesis which is known to be the hall mark of progressive CKD 4. Apparent diffusion coefficient (ADC) has been shown to strongly correlate with histological measures of renal fibrosis 5. Here, we report a preliminary analysis of an ongoing longitudinal study in patients with diabetes and stage 3 CKD using BOLD, Diffusion and ASL MRI.METHODS
Subjects: All procedures were performed with approval from the institutional review board and written subject consent prior to enrollment. All subjects were re-tested 18 month after the first baseline test. MRI data were acquired in a group of diabetics with stage 3 CKD (n: 16; age: 55.2 ± 19.5 yr) and a group of healthy subjects (n: 13; age: 42.6 ± 21.9 ys). Subjects were instructed not to take NSAID for 3 days and ACEi/ARB 1 day prior to MRI. Both groups were instructed to fast after midnight on the day of the MRI and take half the dose of insulin if applicable.
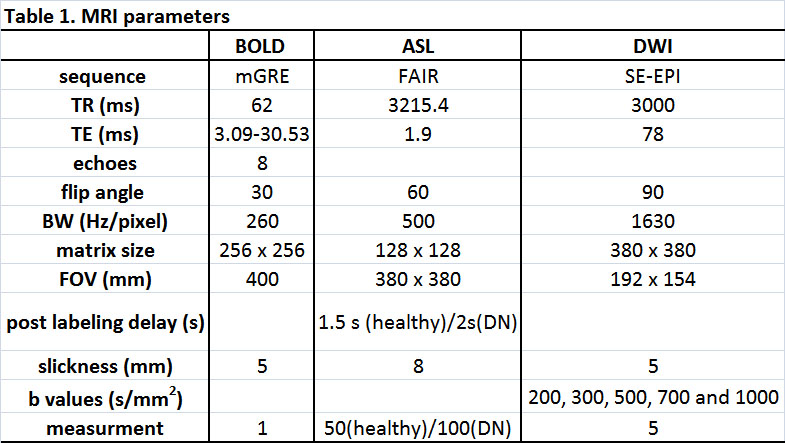
MRI acquisition methods: All experiments were performed on a 3 Tesla whole body scanner (Siemens Healthcare, Erlangen, Germany). Table 1 shows the MRI parameters used in this study.
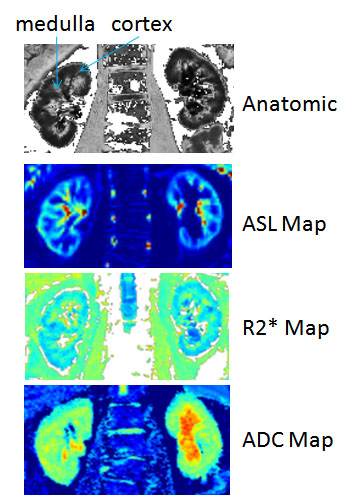
MRI analysis methods: Regions of interest were manually defined in entire cortex, medulla or whole kidney on ASL, BOLD R2* and ADC maps. ASL and R2* maps were generated using a custom image processing toolbox using Python (Python Software Foundation).
Statistic methods: Group wise comparisons were performed using non-parametric Mann-Whitney U Test. P value <0.05 was considered to be statistically significant. Intra-subject coefficient of variation (CV) was calculated in healthy group to estimate the repeatability of MRI measurements at two time points.
RESULTS
DISCUSSION
Following observations can be drawn from the data:
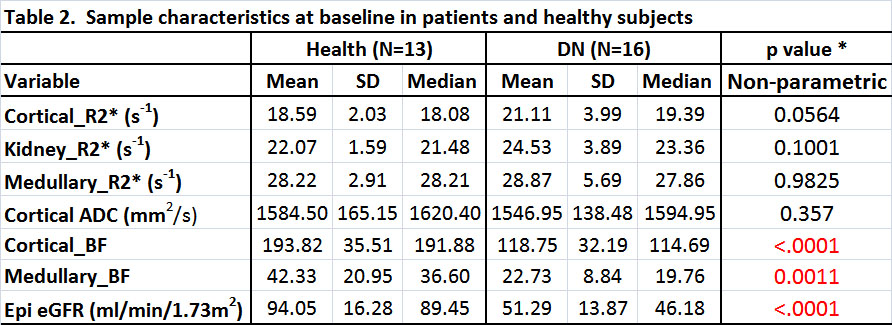
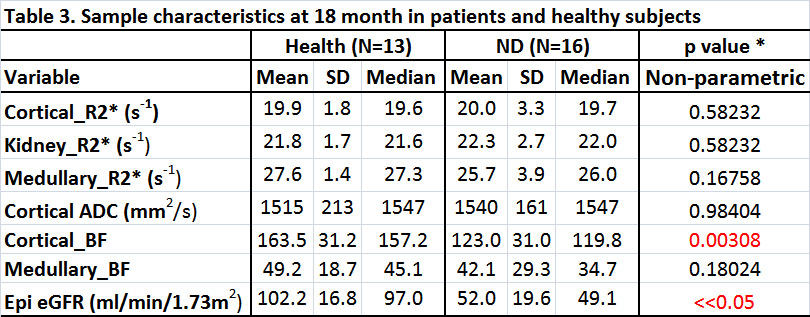
1. At baseline, there were significant differences observed between the two groups only in cortical and medullary BF (Table 2). At 18 months, only cortical BF was significantly different between the groups (Table 3). Patients with CKD showed significantly lower blood flow.
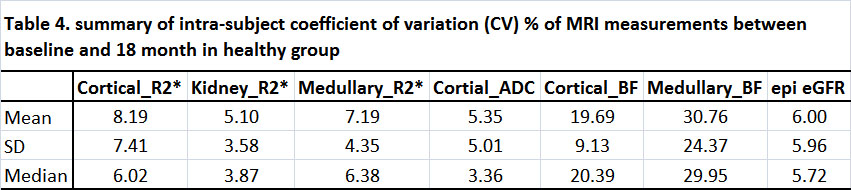
2. In the control group, the CV for R2* and ADC were < 10% while BF was higher as 20% in cortical BF and 30% in medullary BF (Table 4). Interestingly, the eGFR was significantly different (p = 0.0012, Mann-Whitney U test) between baseline and 18 month time point (Tables 2 and 3) in healthy subjects. Previous report has shown significant correlation between ASL BF and eGFR6.
3. In
the DN group, Kidney_R2* (p = 0.018), Medullary_R2* (p = 0.025) and Medullary_
BF (p = 0.002) were significantly different at 18 month compared to baseline,
even though eGFR did not change (p = 0.562) based on Mann-Whitney U Test.
CONCLUSION
In the group of patients with moderate level of DN, only blood flow showed significant differences compared to the control group at both time points. Interestingly, BF showed large intra-subject CV over time in the control group compared to other MRI parameters. Whether these reflect the differences in eGFR at the two time points needs further investigation. In the DN group, whether changes in medullary_BF are responsible for the observed changes in medullary R2* will also require further investigation.
Overall, our data show ASL perfusion MRI have the highest sensitivity (among the three techniques studied) in detecting changes in early DN, but was associated with large variability in repeated measures. BOLD and Diffusion MRI were more reproducible, but may not be sensitive enough to detect early changes.
Acknowledgements
Work supported in part by grant from the National Institutes of Health, R01-DK093793.References
1. Molitch ME DR, Franz MJ, Keane WF, Mogensen CE, Parving HH, Steffes MW; American Diabetes AssociationMolitch ME, DeFronzo RA, Franz MJ, Keane WF, Mogensen CE, Parving HH, Steffes MW; American Diabetes Association. Nephropathy in diabetes. Diabetes Care. 2004:S79-83. 2. Fine LG, Orphanides C, Norman JT. Progressive renal disease: the chronic hypoxia hypothesis. Kidney international Supplement. 1998;65:S74-8. 3. Tan H, Koktzoglou I, Prasad PV. Renal perfusion imaging with two-dimensional navigator gated arterial spin labeling. Magnetic resonance in medicine. 2014;71:570-9. doi:10.1002/mrm.24692. 4. Boor P, Floege J. Chronic kidney disease growth factors in renal fibrosis. Clinical and experimental pharmacology & physiology. 2011;38:441-50. doi:10.1111/j.1440-1681.2011.05487.x. 5. Zhao J, Wang ZJ, Liu M, et al. Assessment of renal fibrosis in chronic kidney disease using diffusion-weighted MRI. Clinical radiology. 2014;69:1117-22. doi:10.1016/j.crad.2014.06.011. 6. Lu-Ping Li HT, Jon M Thacker, Wei Li , Ying Zhou, Orly Kohn, Stuart M. Sprague, and Pottumarthi V. Prasad. Evaluation of Renal Blood Flow in Chronic Kidney Disease Using Arterial Spin Labeling Perfusion MRI Kidney International Reports. 2016.Figures