1072
Dynamic Contrast-Enhanced Magnetic Resonance Imaging: A Pre-Clinical Approach to Detect and Monitor Diabetes1Radiology, Michigan State University, East Lansing, MI, United States, 2Radiology, Michigan State University, East Lansing, MI, 3Department of Comparative Medicine and Integrative Biology Program, Michigan State University, East Lansing, MI, United States, 4Radiology, East Lansing, MI, United States
Synopsis
The link between diabetes and dysregulation of OATP transporters provides an avenue for imaging the disease with MRI. The aim of this work was to use DCE-MRI to non-invasively measure decreases of OATPs during the onset of diabetes. The data presented here verifies that both Gd-EOB-DTPA and Gd-BOPTA enhanced MRI reveals underlying alterations in OATPs that are present in the liver and kidney as a result of diabetes. Preliminary data further suggests that there could be a link between changes in organ enhancement and disease onset. Thus, there is the potential to monitor diabetes and perhaps even diagnose pre-diabetes.
Introduction:
Diabetes mellitus affects ~10% of the US population1. Diagnosing the disease at the pre-diabetic stage would enable better and earlier disease management. In rodent models of pre-diabetes, for both Type I (T1D) and Type II (T2D), animals have markedly reduced organic anions transporting polypeptide (OATP) levels in the liver 2,3. OATPs transport FDA-approved Gd-EOB-DTPA and Gd-BOPTA into liver. Therefore, MRI may detect pre-diabetes by monitoring contrast uptake by the liver and kidney.Purpose:
The aim of this work was to use Dynamic Contrast Enhanced (DCE) MRI to non-invasively measure decreases of OATPs during the onset of diabetes. This was accomplished with three experiments. First, we asked whether MRI could detect differences between diabetic animal liver and control livers by measuring contrast agent uptake. Next, the role of OATP in the liver and kidney trafficking of contrast was studied in genetically modified animals. Finally, the ability for DCE-MRI to monitor disease development was examined in a preliminary longitudinal experiment in a slow developing model of type I diabetes.Methods:
B6.Cg-Lepob/J mice (obob, n=5) are a T2D mouse model with 5-15% reduction in OATP in liver3. Abdominal DCE-MRI was performed on obob mice and compared to age matched controls (n=5) to determine the impact of T2D on liver and kidney function. Mice were scanned three times at 7T, once each with Gd-EOB-DTPA, Gd-BOPTA or Gd-DTPA. After tail vein catheterization, mice underwent DCE-MRI using a RARE sequence (TE:4.66ms, TR:200ms, 200μm x 200μm) for one hour (60 repetitions). Gd-EOB-DTPA, Gd-BOPTA or Gd-DTPA (0.1 mmol Gd/kg) was injected after 3 baseline images. We calculated percent enhancement for the liver and kidney at every time point, normalized to pre-contrast enhancement. Area under the curve (AUC) was calculated to determine the percent clearance by organ. Values were compared across groups using mixed model ANOVA. Animals were then euthanized, blood glucose and insulin were measured, and organs (liver, kidney and pancreas) were weighed and snap frozen in liquid nitrogen. Quantitative PCR measured OATP1a1 gene expression in liver tissue. To study the impact of OATP on contrast clearance by the liver and kidney, the experiment was replicated with Oatp1a/1b cluster k/o mice (OATP KO, n=6). A similar study was also conducted to monitor disease onset in NOD/ShiJT mice (NOD, n=4), a slow developing model of T1D, starting at 8 weeks which is well before the onset of T1D.Results and Discussion:
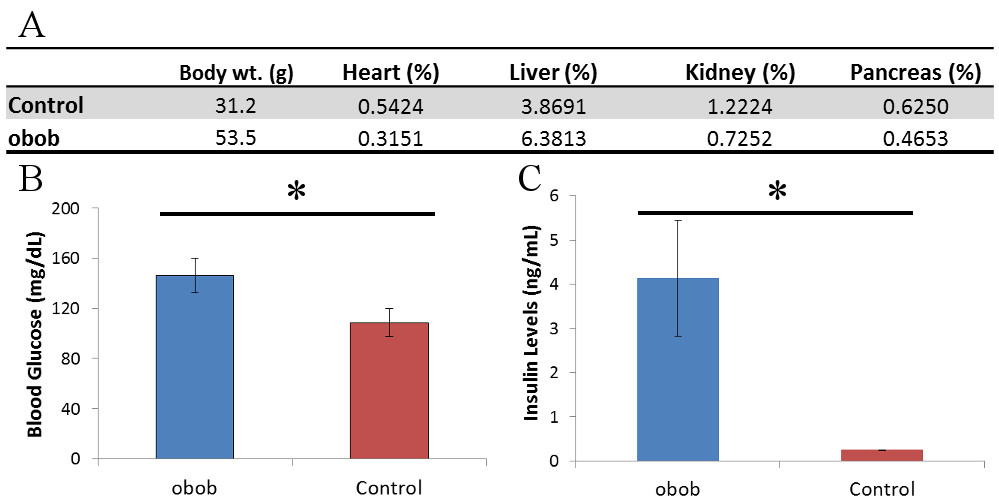
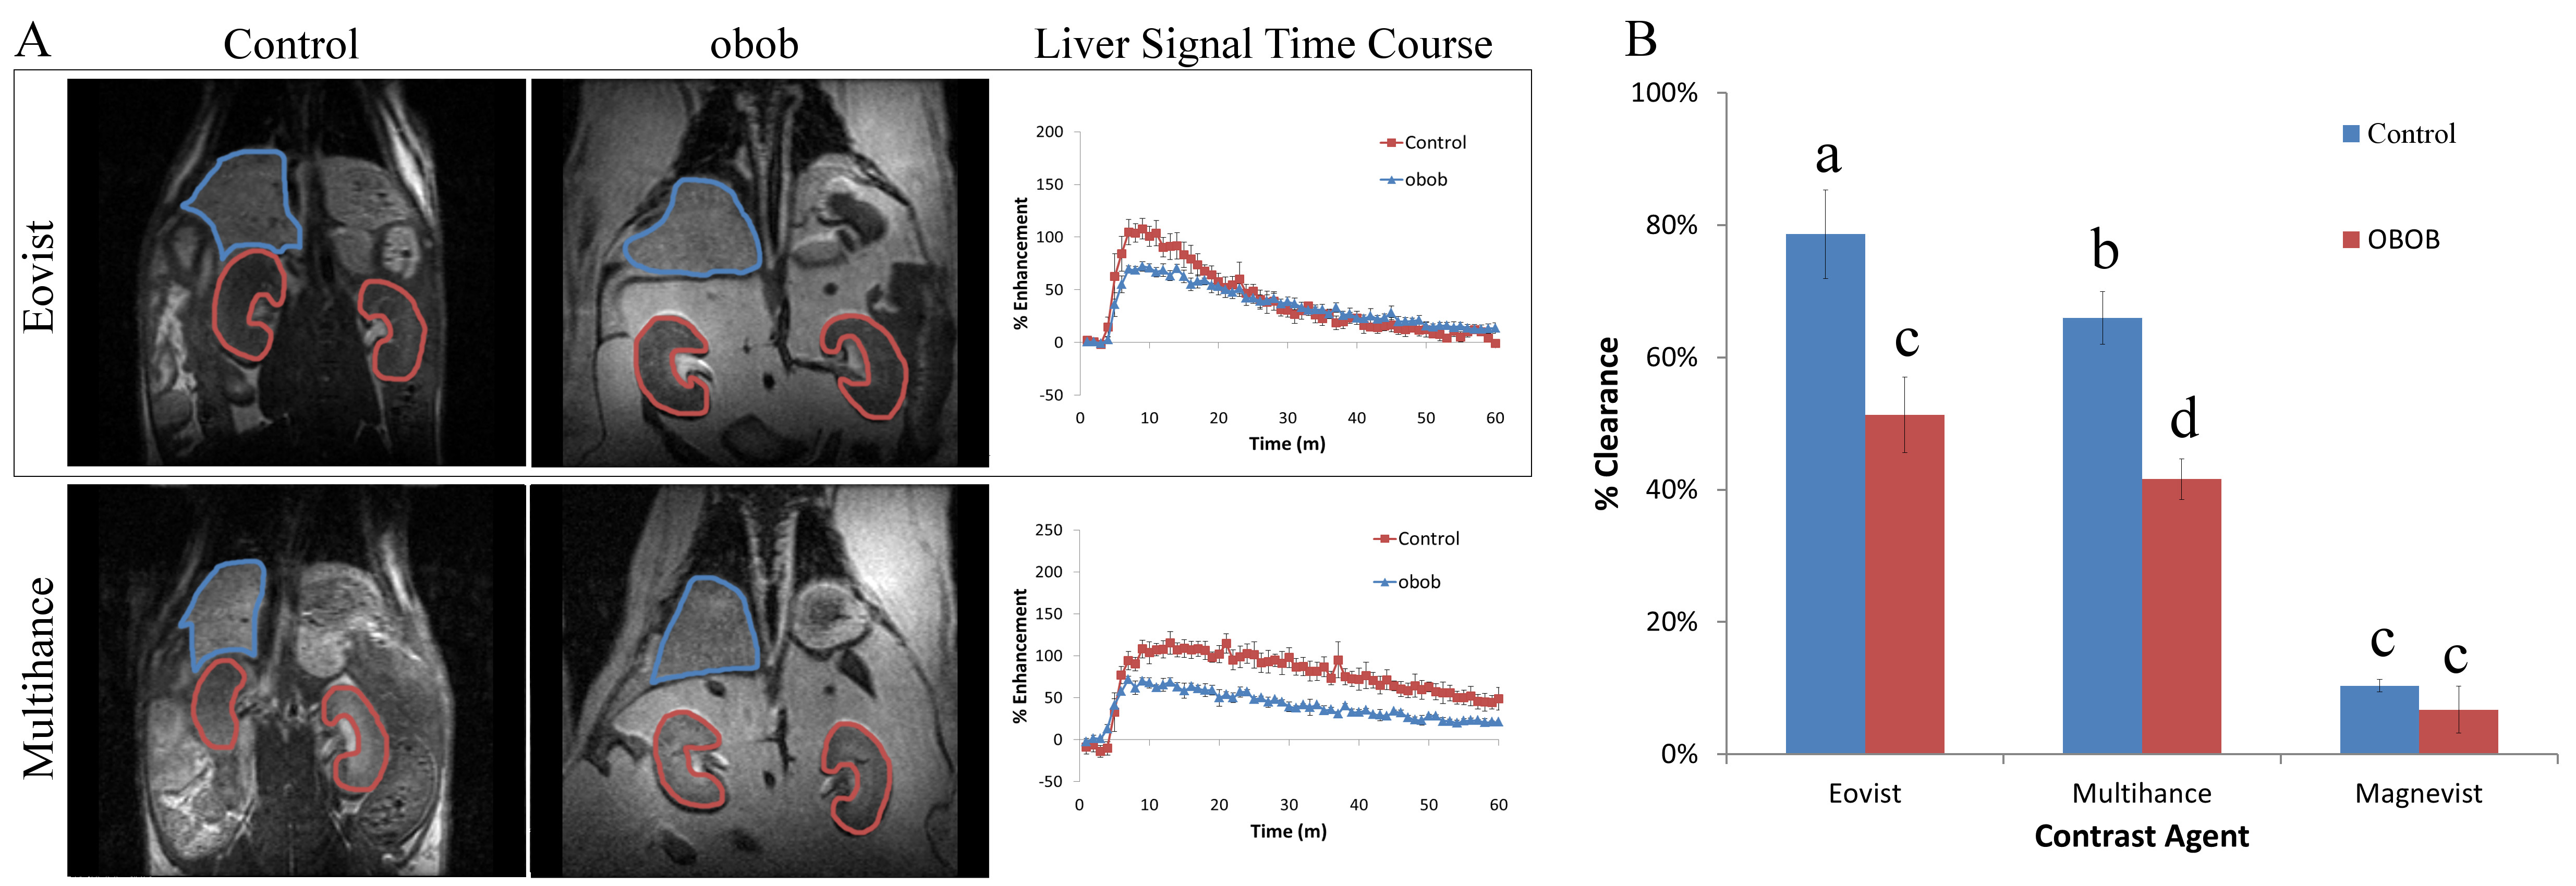
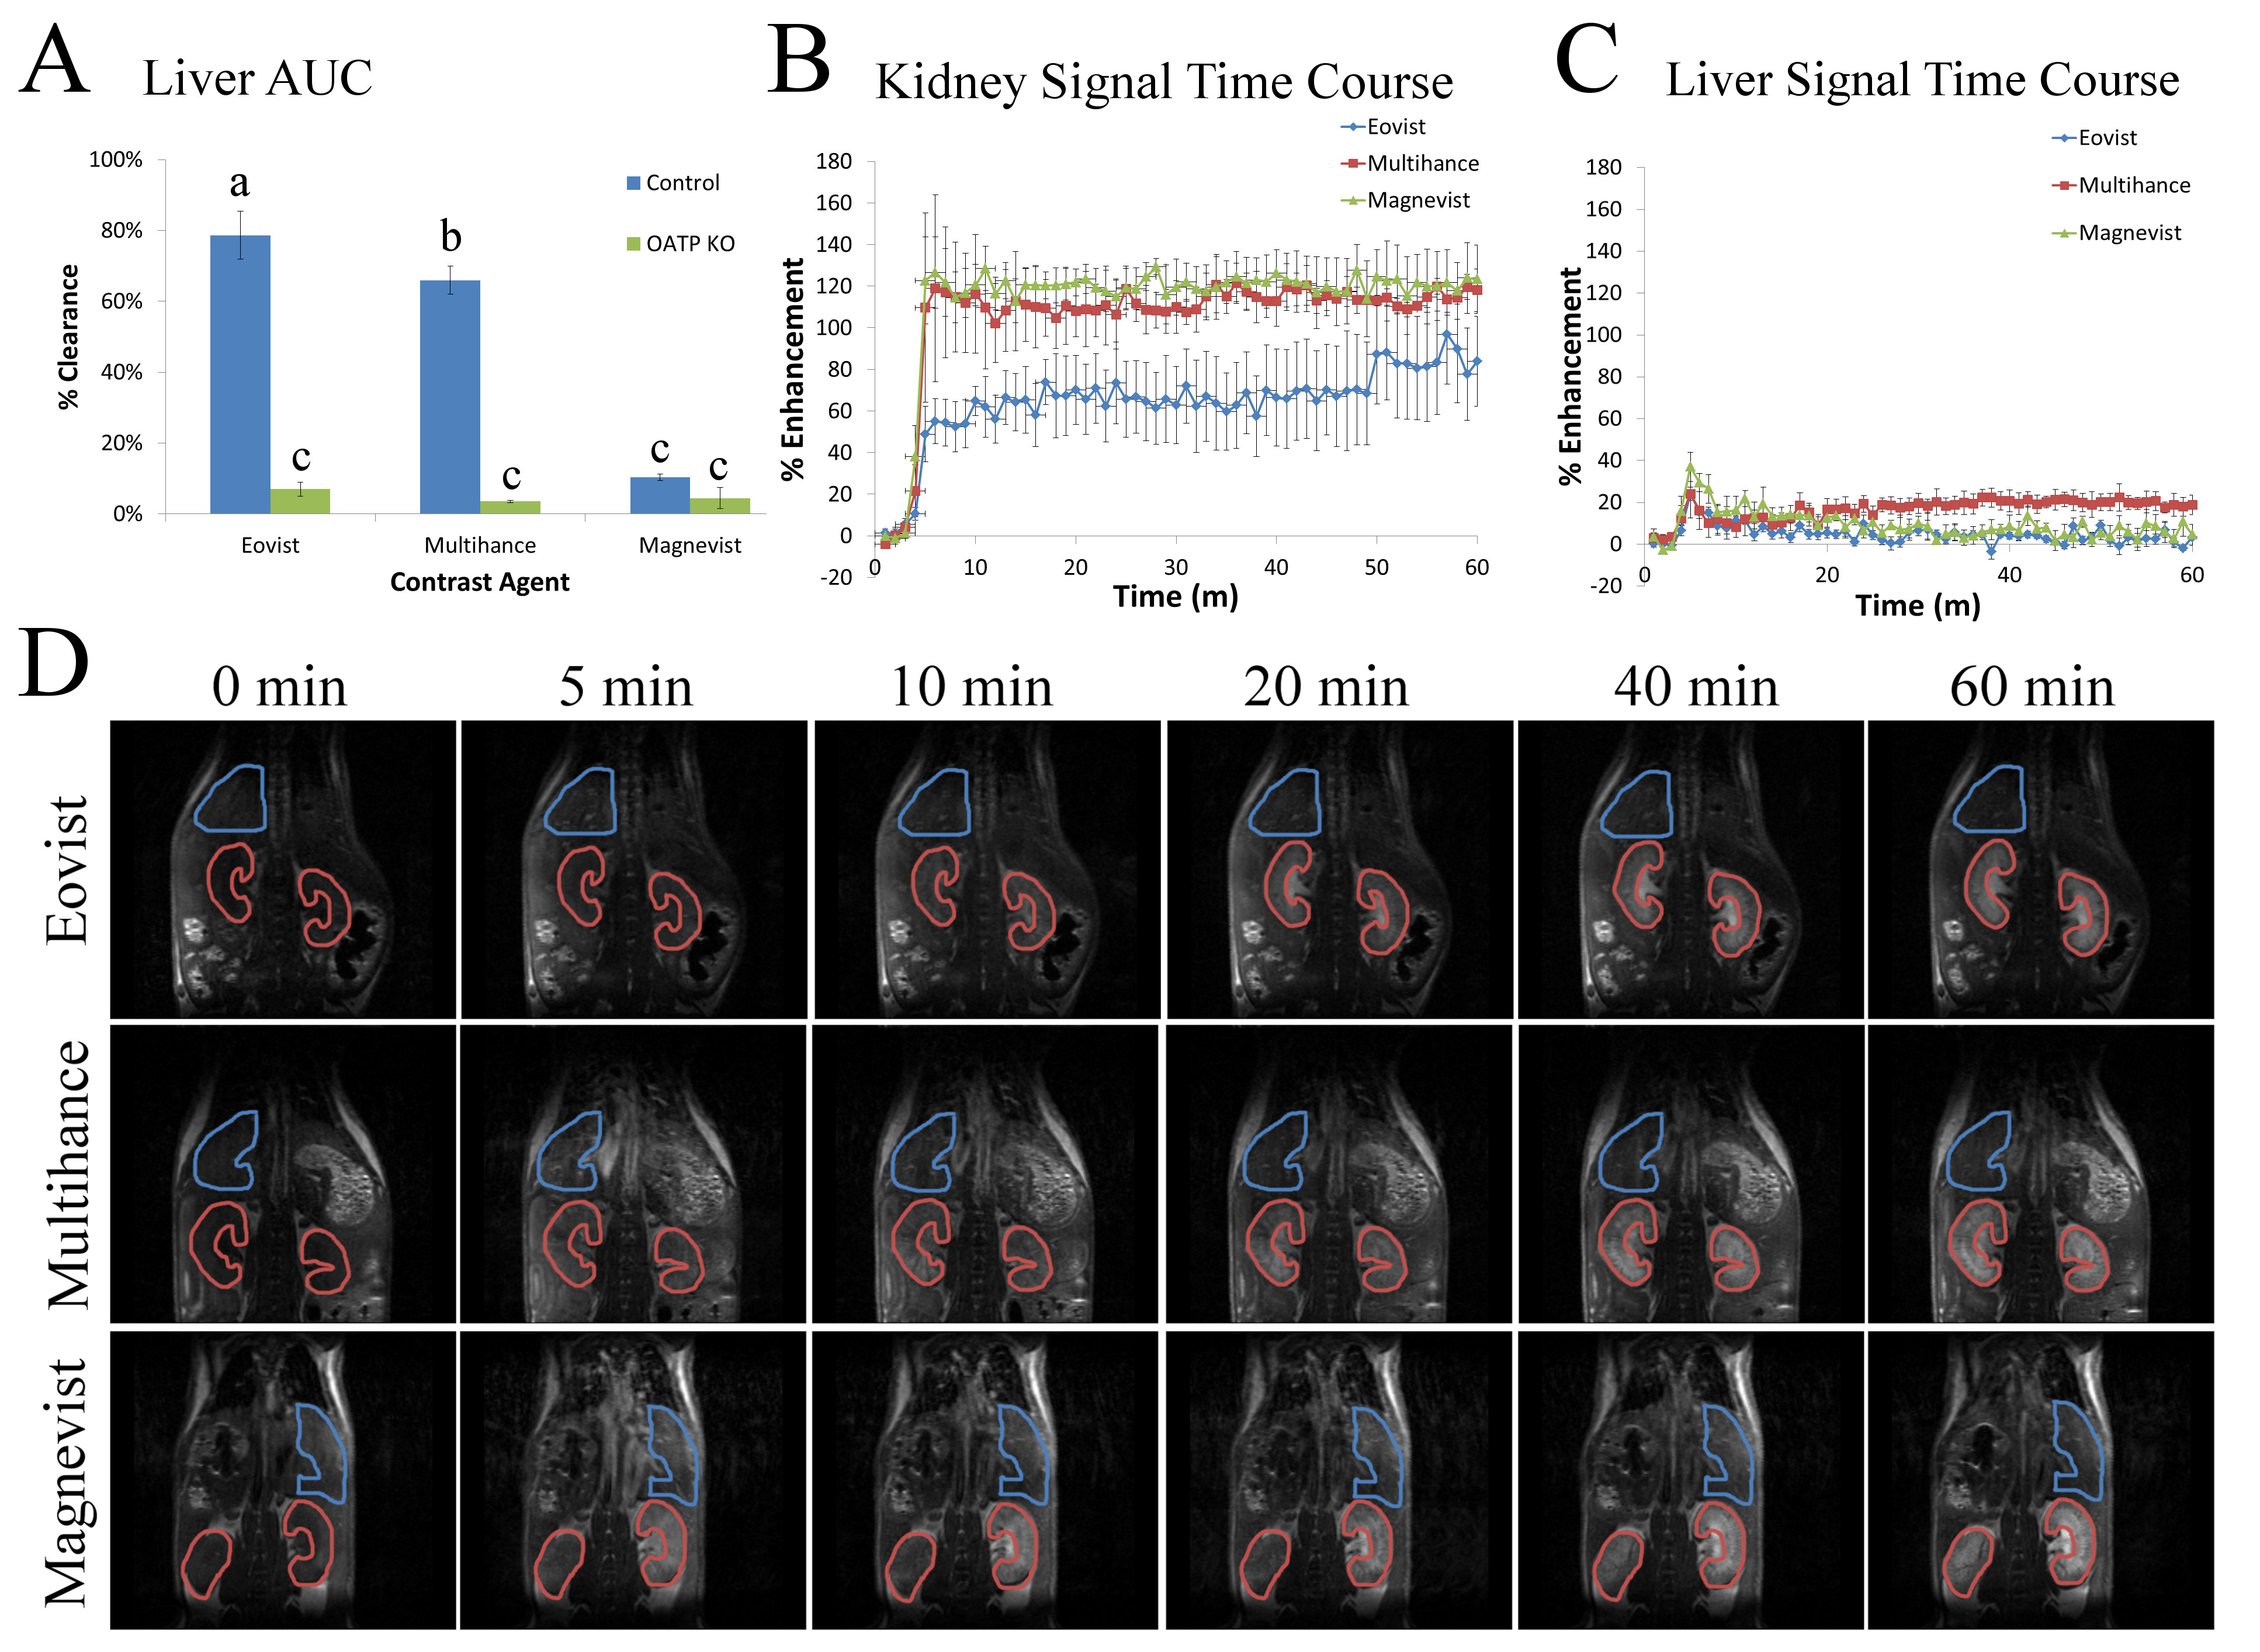
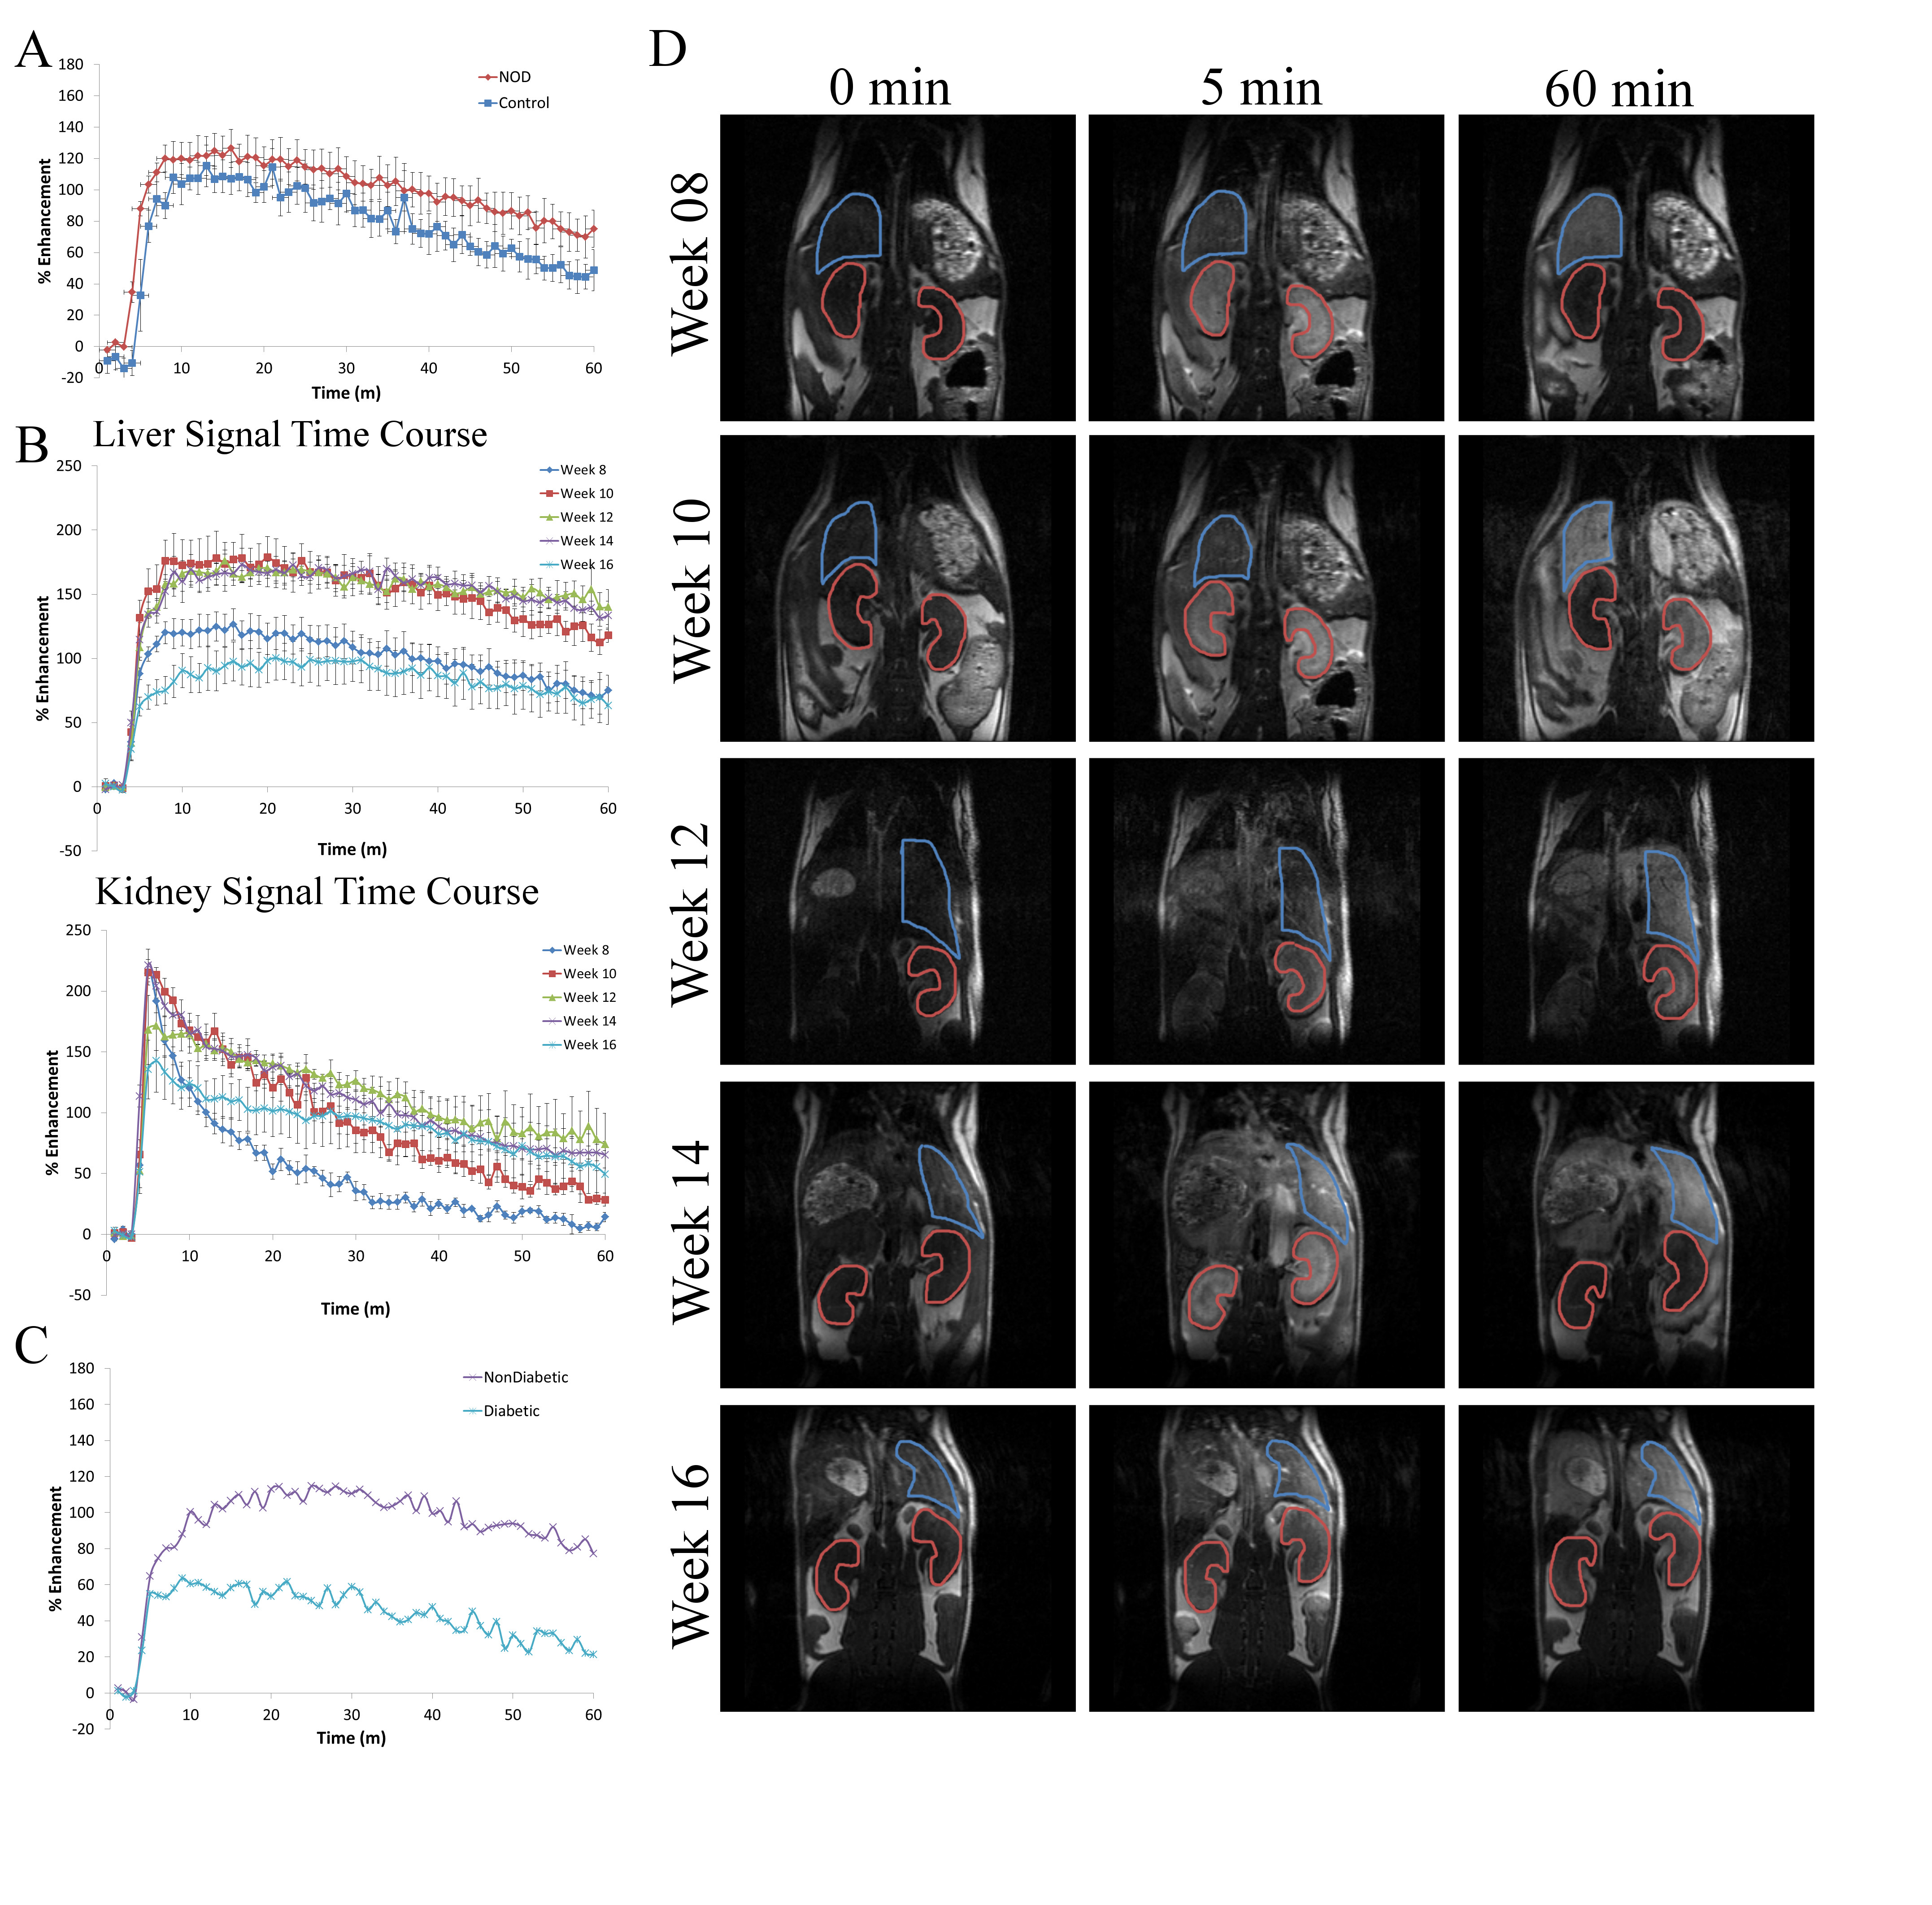
Obob mice weighed 53.6±13.7g compared to 31.2±1.1g for control (Figure 1a). Blood glucose (Fig. 1b) and insulin (Fig. 1c) were elevated in obob mice. qPCR demonstrated a 12.75±0.95X decrease in OATP1a1 expression for obob mice. Using Gd-EOB-DTPA and Gd-BOPTA, obob mice had reduced uptake in the liver and increased levels within the kidney (Fig. 2a). Percent clearance in the liver showed a significant interaction between contrast agent and mouse phenotype (Fig. 2b). Both control and obob had the highest percent clearance with Gd-EOB-DTPA followed by Gd-BOPTA but little clearance with Gd-DTPA, as expected for the negative control. Most importantly, obob mice had lower overall percent clearance when compared to control animals. For OATP KO mice, there was no significant difference in percent clearance across contrast agents (Fig. 3a) because OATP KO mice transported neither Gd-EOB-DTPA nor Gd-BOPTA into the liver (Fig. 3b). Interestingly, animals maintained contrast within the kidneys for 60 min, different from control animals (3c). NOD mice had similar contrast enhancement levels as control in the liver on the first day (Week 8) of scanning (Fig. 4a). Over the next 10 weeks all animals had an increase in uptake within both the liver and kidney (Fig 4b). Additionally, kidney maintained contrast enhancement as observed in OATP KO mice (Fig. 4c). Only one animal currently expresses high levels of blood glucose, in this animal there is a decrease in liver uptake of contrast similar to obob animals that occurred upon hyperglycemia (Fig. 4d).Conclusion:
The link between diabetes and dysregulation of OATP transporters provides an avenue for imaging the disease with MRI. The data presented here verifies that both Gd-EOB-DTPA and Gd-BOPTA enhanced MRI reveals underlying alterations in OATPs that are present in the liver and kidney as a result of diabetes. Preliminary data further suggests that there could be a link between changes in organ enhancement and disease onset. Thus, there is the potential to monitor diabetes and perhaps even diagnose pre-diabetes by imaging the liver and kidney. As these are FDA approved agents, clinical studies are straight forward to envision.Acknowledgements
Financial support from NIH R01 DK107697References
1. Guariguata L, Whiting DR, Hambleton I, et al. Global estimates of diabetes prevalence for 2013 and projections for 2035. Diabetes Res. Clin. Pract. 2014;103: 137-149.
2. Xu C, Zhu L, Chan T, et al. The altered renal and hepatic expression of solute carrier transporters (SLCs) in Type 1 Diabetic mice. PLoS ONE 2015; 10: e0120760.
3. Cheng Q, Aleksunes LM, Manautou JE, et al. Drug-metabolizing enzyme and transporter expression in a mouse model of diabetes and obesity. Mol Pharm 2008; 5(1): 77-91.
Figures