1071
Renal Arterial Spin Labeling in Diabetes Mellitus1Nephrology, University of Navarra Hospital, Pamplona, Spain, 2Nephrology, Navarra Hospital, Pamplona, Spain, 3Laboratory of Functional MRI Technology, Stevens Neuroimaging and Informatics Institute, University of Southern California, Los Angeles, United States, 4Radiology, University of Navarra Hospital, Pamplona, Spain, 5Hematology, University of Navarra Hospital, Pamplona, Spain, 6Biomedical Engineering, TECNUN, University of Navarra, San Sebastian, Spain
Synopsis
Diabetic nephropathy (DN) is a microvascular complication of diabetes mellitus (DM) and a leading cause of chronic kidney disease (CKD). However evidence of renal damage is not detected until the advanced disease stages, using current clinical diagnostic tools. The goal of this study was to investigate renal hemodynamic changes in diabetic patients using ASL and evaluate whether the technique is sensitive enough to detect renal dysfunction early in the disease course, which could have relevant clinical and therapeutic implications. The results demonstrated detection of hemodynamic changes in kidney microvasculature in diabetic patients. Moreover, ASL was able to detect small changes in kidney perfusion across different stages of CKD in the diabetic population.
Introduction
Diabetic nephropathy (DN) is a microvascular complication of diabetes mellitus (DM) and a leading cause of chronic kidney disease (CKD). Hemodynamic changes have been described from early stages of diabetic nephropathy (1), however evidence of renal damage is not detected until the advanced disease stages, using current clinical diagnostic tools. Arterial Spin Labeling (ASL) perfusion MRI can be used to quantify renal blood flow (RBF) without the use of exogenous contrast agents. Renal ASL appears as an attractive tool for assessing kidney function non-invasively (2), however it has not been employed in the renal evaluation of diabetic patients, to date.
The goal of this study was to investigate renal hemodynamic changes in diabetic patients using ASL and evaluate whether the technique is sensitive enough to detect renal dysfunction early in the disease course, which could have relevant clinical and therapeutic implications.
Methods
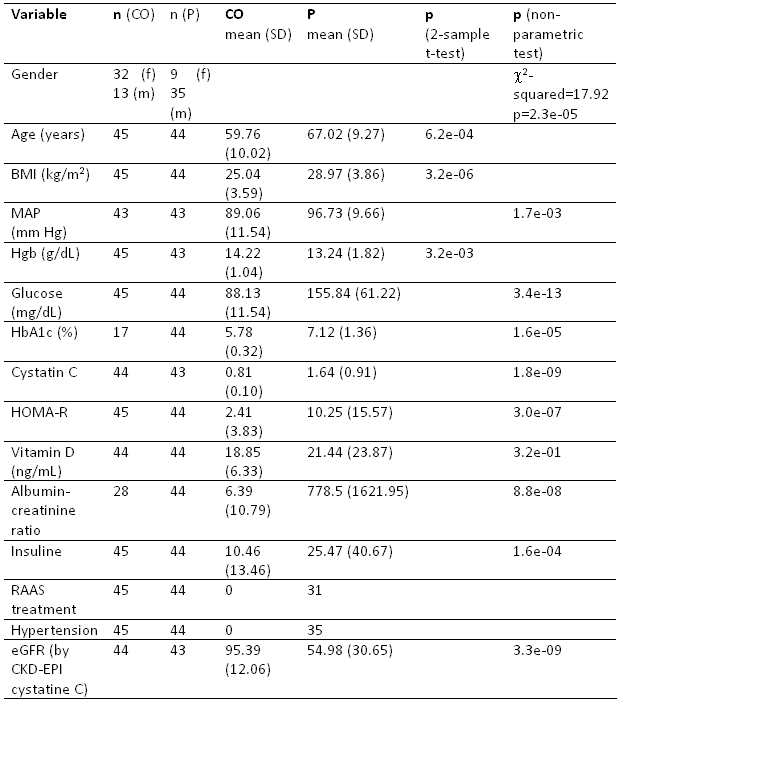
Subjects: Forty-five healthy subjects and 44 type-2 DM patients participated in the study, after signing informed consent. They underwent physical examination and clinical laboratory measurements of urine and blood. Glomerular filtration rate (eGFR) was estimated using the CKD-EPI cystatin-C equation. Patients were classified as group 1 (eGFR>60ml/min/1.72m2, stage I-II), 2 (60≥eGFR>30, stage III) or 3 (eGFR<30, stages IV-V).
Scanning protocol: The study was performed on a 3T Trio using a 12-channel flexible body-array and the spine-array. The scanning session included: T1-weighted and T2-weighted anatomical images and ASL. The ASL sequence combined PCASL with single-shot bSSFP, in a navigator gated free-breathing acquisition (3). The axial labeling plane was perpendicular to the aorta, 10cm over the kidneys. Labeling parameters were: duration=1.6 s and post-labeling delay=1.2 s. One oblique-coronal slice through both kidneys was imaged (in-plane resolution=2.7x2.7 mm2, FOV=350x350, slice thickness=5 mm, TR/TE=3700/1.9ms, flip angle=50°). Twenty-five pairs of ASL images were acquired.
Data processing: Images were corrected for motion using non-rigid body registration (4). Control and label images were subtracted and averaged, after eliminating outliers (when the mean perfusion signal differed from the mean of the perfusion image series by ±2 standard deviations). RBF was quantified using the single compartment model. Regions of interest (ROIs) depicting the renal cortex were drawn on the RBF maps, to compute cortical RBF.
Statistical analysis (R 3.0.3): Differences in demographic and clinical variables between patients and controls were assessed using non-parametric Wilconxon-Mann-Whitney tests for variables that did not follow a normal distribution and two-sample T-tests for normal variables. Gender differences were assessed using χ2 tests. Since the groups were found to differ in age and gender, cortical RBF values were entered into a general linear model with group (controls and patients), age and gender as independent variables, in order to assess group differences while controlling for possible confounding effects of age and gender. The capacity of RBF to discriminate among patients at different stages of the disease and healthy controls was evaluated using a Kruskal-Wallis test, followed by post-hoc tests (5), corrected for multiple comparisons. Correlations between RBF and eGFR were evaluated across the whole study group.
Results
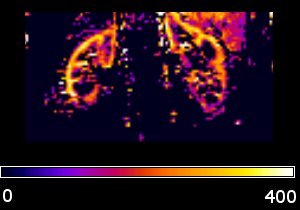
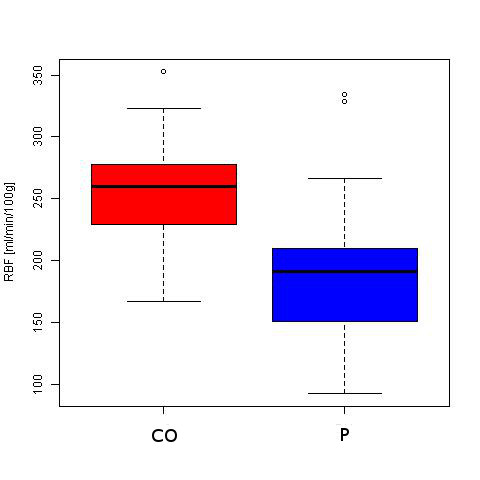
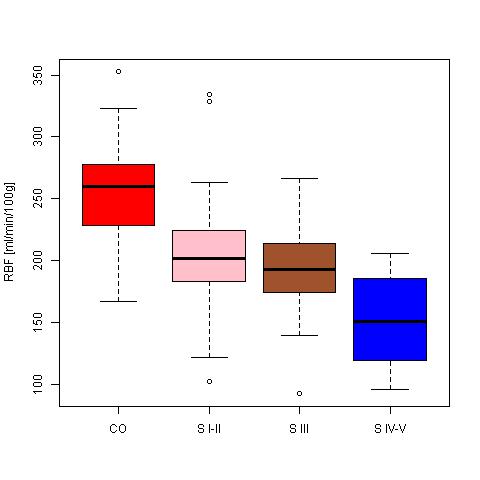
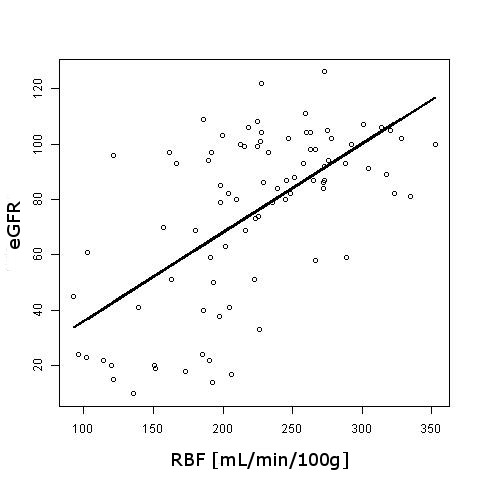
Significant differences between control and patient groups were found in all demographic and clinical variables (Table 1), except for vitamin D. Fig. 1 shows an RBF map from a healthy subject. Cortical RBF in the control group was 258.83±37.96 (mean±standard deviation (SD)) mL/(min·100 g). In the patient group RBF was 185.79± 54.60 (28% lower) (Fig. 2). Results of the GLM showed a highly significant difference in RBF between groups (regression coefficient=-67.61, T=-5.50, p=3.86×10⁻⁷). No effects of age and gender were found. Significant differences in RBF among controls and the three different stages of CKD (see Fig. 3) were demonstrated: CO>stage I-II (p=0.0018), CO>stage III (p=0.0008), CO>stage IV-V (p=2.4×10⁻⁸) and stage I-II>stage IV-V (p=0.0386). A significant correlation was obtained between RBF and eGFR values (r=0.62, p=2×10⁻¹⁰).Discussion and Conclusion
To the best of our knowledge this is the first study that has measured kidney perfusion in diabetic patients in comparison with healthy subjects, using the ASL technique, as well as the largest cohort ever studied using renal ASL. The results demonstrated early detection of hemodynamic changes in kidney microvasculature in diabetic patients. Moreover, ASL was able to detect small changes in kidney perfusion across different stages of CKD in the diabetic population, and between healthy subjects and diabetic patients with normal filtration rates (stages I-II), as well as showing a strong correlation between RBF and eGFR. Thus ASL appears as a novel technique to evaluate kidney damage prior to biochemical alterations and it could be used in DM to understand its pathophysiology and detect patients with greater risk of developing renal disease.Acknowledgements
Grant: Spanish Ministry of Health (FIS 2015).References
1. Waanders et al., Neth J Med 71:448-58 (2013).
2. Notohamiprodjo et al., Eur J Radiol 76:337-47 (2010).
3. Rapacchi et al., Mag Reson Imaging 33:1066-74 (2015).
4. Avants et al., Med Image Anal 12:26-41 (2008).
5. Dunn, Technometrics 6:241-52 (1964).
Figures