1069
Hyperpolarized 13C-pyruvate MRI of the liver and kidneys in rodent models of type 1 and type 2 diabetes1Radiology & Biomedical Imaging, UCSF, San Francisco, CA, United States, 2Nephrology, UCSF, San Francisco, CA, United States
Synopsis
The purpose of this study was to characterize changes in hyperpolarized 13C-pyruvate spectra in the liver and kidneys of two contrasting models of diabetes, obese Zucker diabetic fatty (ZDF) rats and streptozotocin(STZ)-treated (insulin-deficient) wild type Zucker rats. The results were interpreted in combination with transcriptional analysis of freeze-clamped tissue samples from these animals. Hyperpolarized lactate levels were elevated in both models while hyperpolarized alanine signals clearly diverged, decreasing in the type 1 model but increasing in type 2. Overall, the results suggest a complex interplay of transcriptional and substrate-level effects in determining the metabolic phenotype in diabetes.
Purpose
Rodent models of type 2 diabetes exhibit "selective insulin resistance", where lipogenesis is continually stimulated despite inability to suppress gluconeogenesis, resulting in a deadly combination of hyperglycemia with hypertriglyceridemia1. The purpose of this study was to profile changes in the intermediary metabolism of HP [1-13C]pyruvate in liver and kidney of two contrasting models of diabetes, Zucker diabetic fatty (ZDF) rats (an obesity-related model of type 2 diabetes) and streptozotocin(STZ)-treated wild-type Zucker rats (an insulin-deficient type 1 model), in comparison with results of transcriptional analysis from freeze-clamped tissue samples. The results suggest a complex interplay of transcriptional and substrate-level effects on metabolic phenotype.Methods
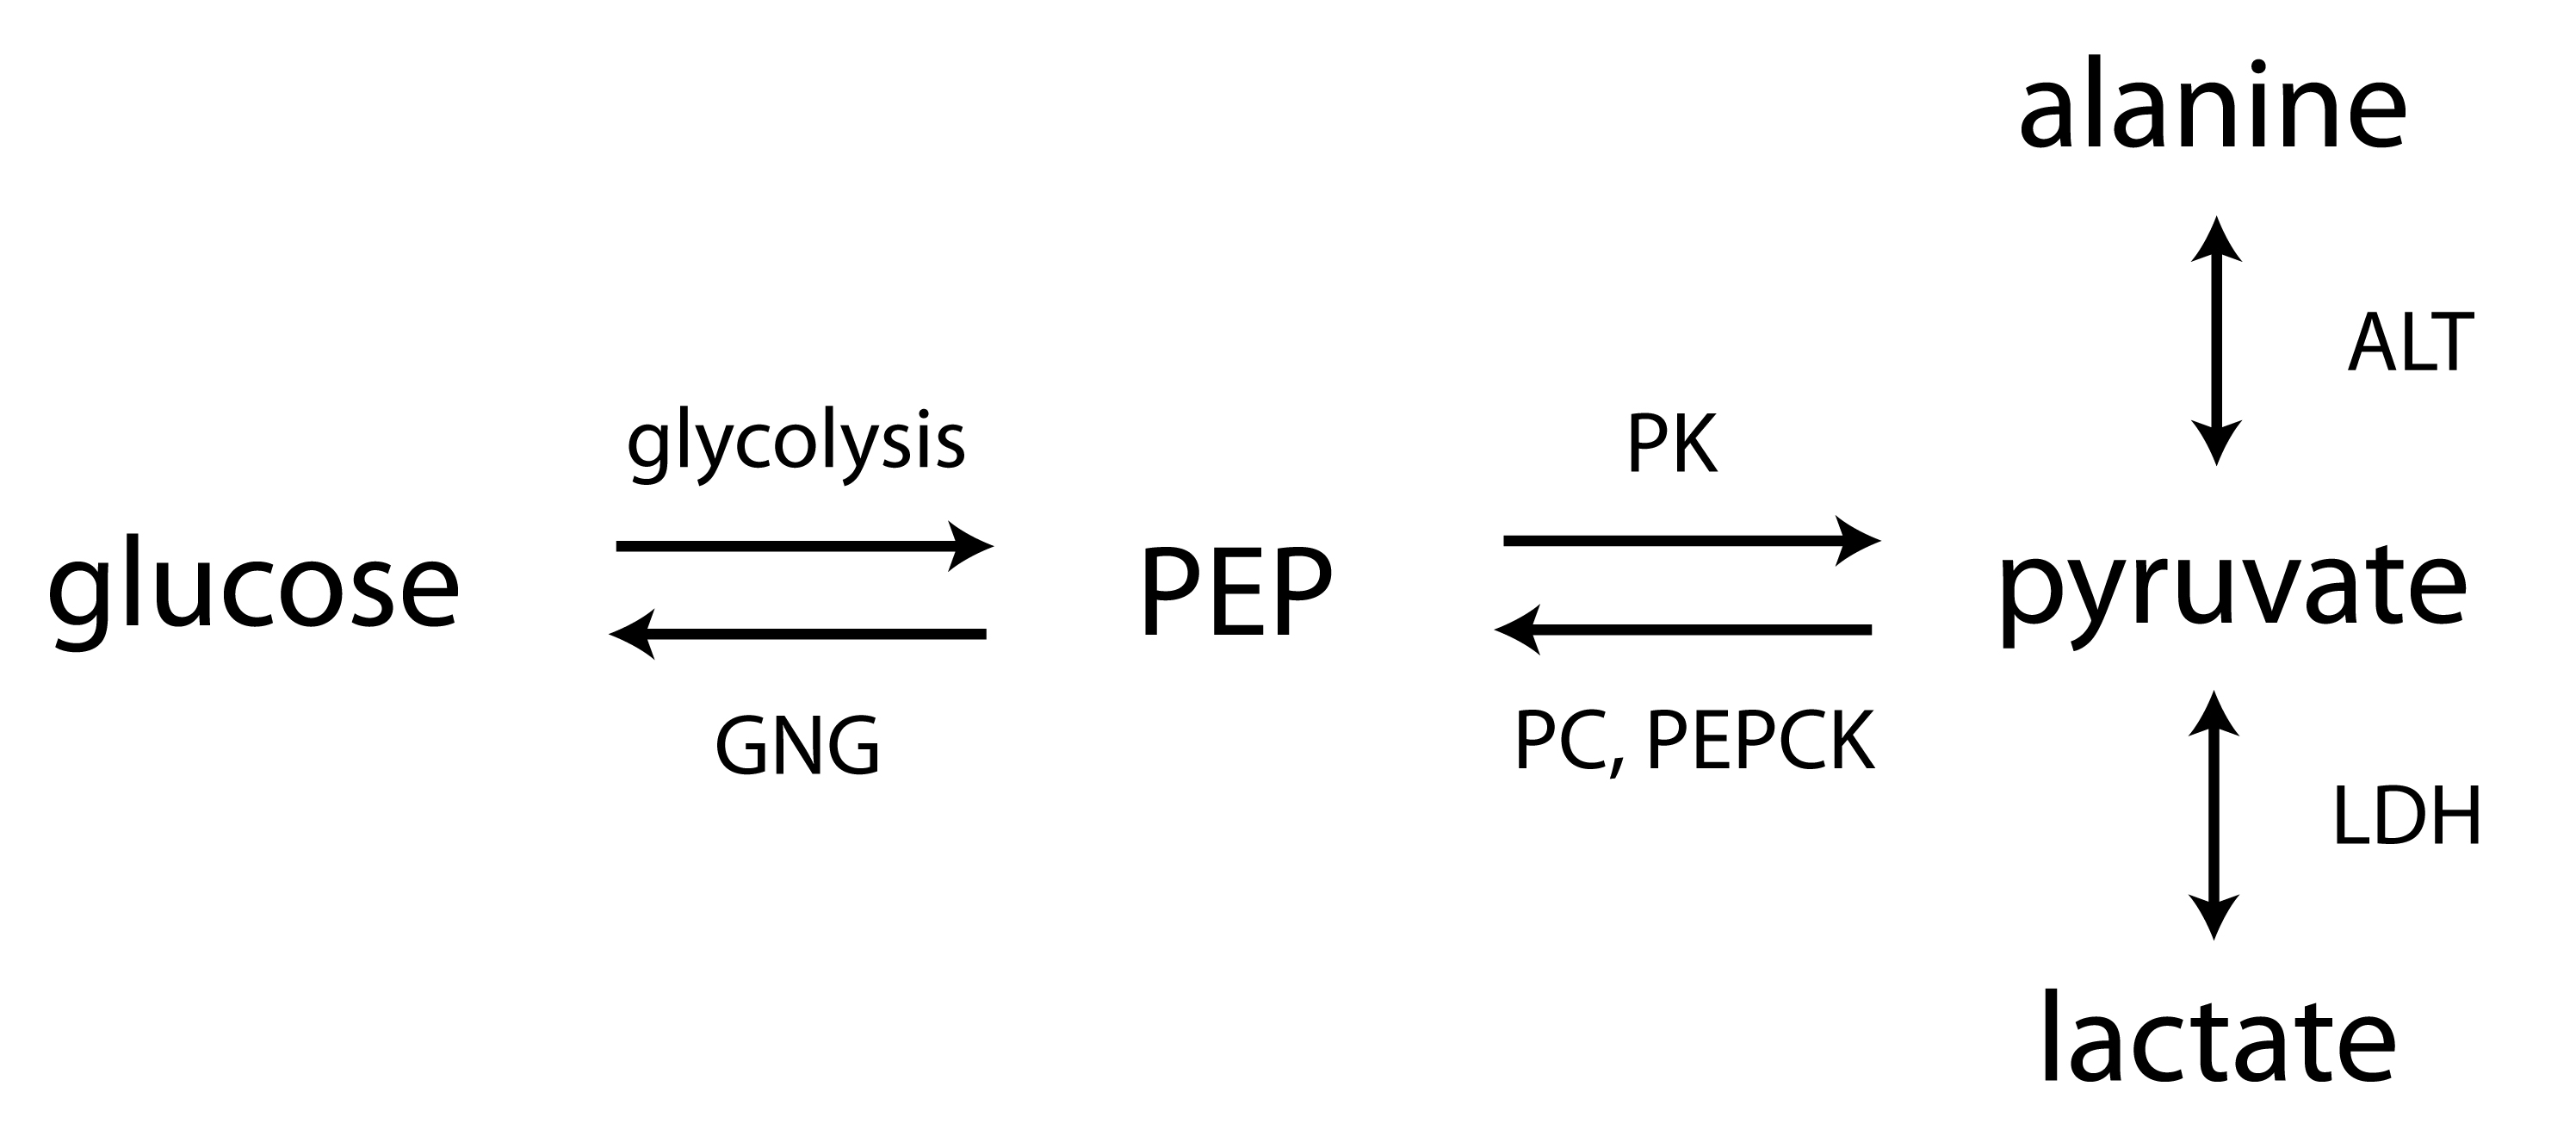
Animal models- The Zucker diabetic fatty (ZDF) rat is a leptin receptor-deficient model of type 2 diabetes2. While lean males (Fa/Fa or Fa/fa) are phenotypically normal, the obese male adult (i.e. ZDF or fa/fa) has many features of type 2 diabetes in humans (e.g. hyperinsulinemia, hypertriglyceridemia, hyperglycemia). Seven wild-type (WT) male Zucker rats (Fa/Fa), seven lean male Zucker rats (Fa/fa), six obese male diabetic Zucker rats (fa/fa), and six STZ-treated WT male diabetic Zucker rats were scanned at ~12 weeks. STZ was a single injection (60mg/kg i.p.), and these rats received daily insulin until 24-36h prior to scan. MRI- For each experiment, 2.2mL 80mM HP [1-13C]pyruvate was injected into each rat in a 3T scanner. The scan consisted of slab-selective MRS of axial slabs (10mm) through the liver and kidneys. Alanine experiments- To probe the influence of pool size effects, equimolar unlabeled products of ALT (alanine or α-ketoglutarate) were injected one minute prior to HP [1-13C]pyruvate, in three normal rats. To investigate effects of amino acid transport, four normal rats were also scanned before and 1.5h after inhibition of alanine transport by α-(methylamino)isobutyrate3 (MeAIB, 1000mg/kg, i.v.). Transcriptional analysis- mRNA levels for ALT and regulatory enzymes of gluconeogenesis PEPCK and liver pyruvate kinase (LPK) were obtained using rtPCR of freeze-clamped liver and kidney cortex samples. Balance between PEPCK and LPK, a highly regulated isoform of PK expressed in liver and renal cortex that can shunt phosphoenolpyruvate (PEP) back to pyruvate4, is a key control point of gluconeogenesis (Figure 1).Results
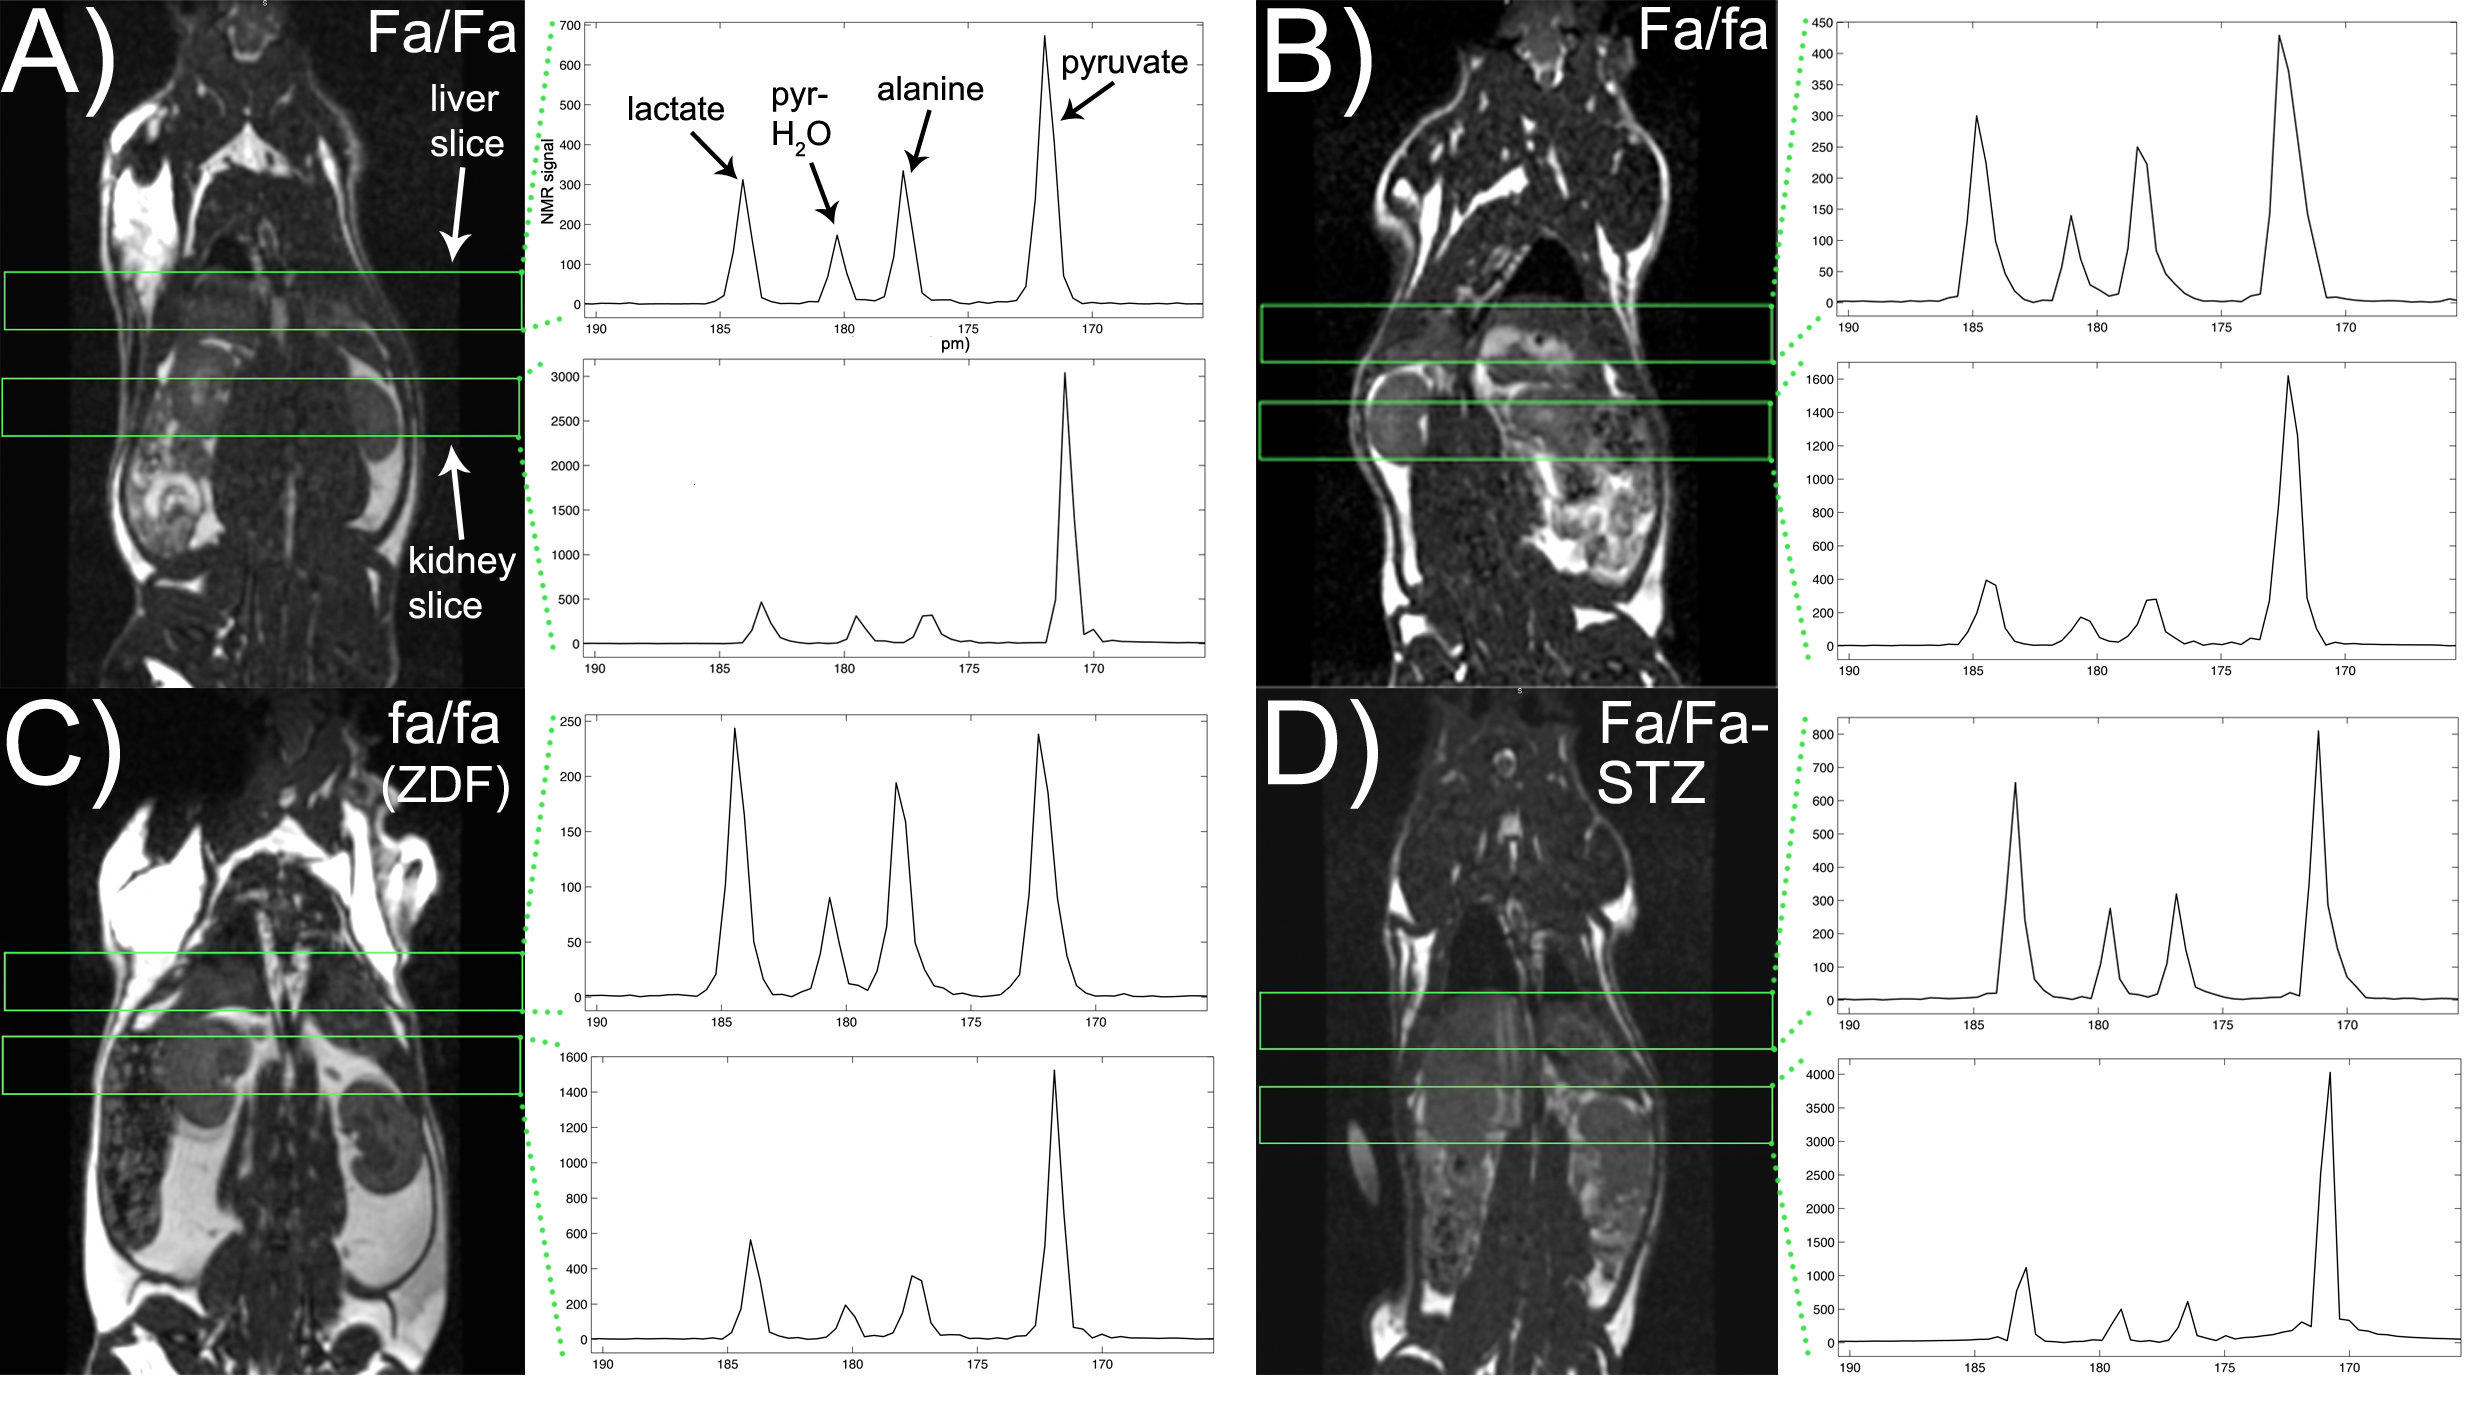
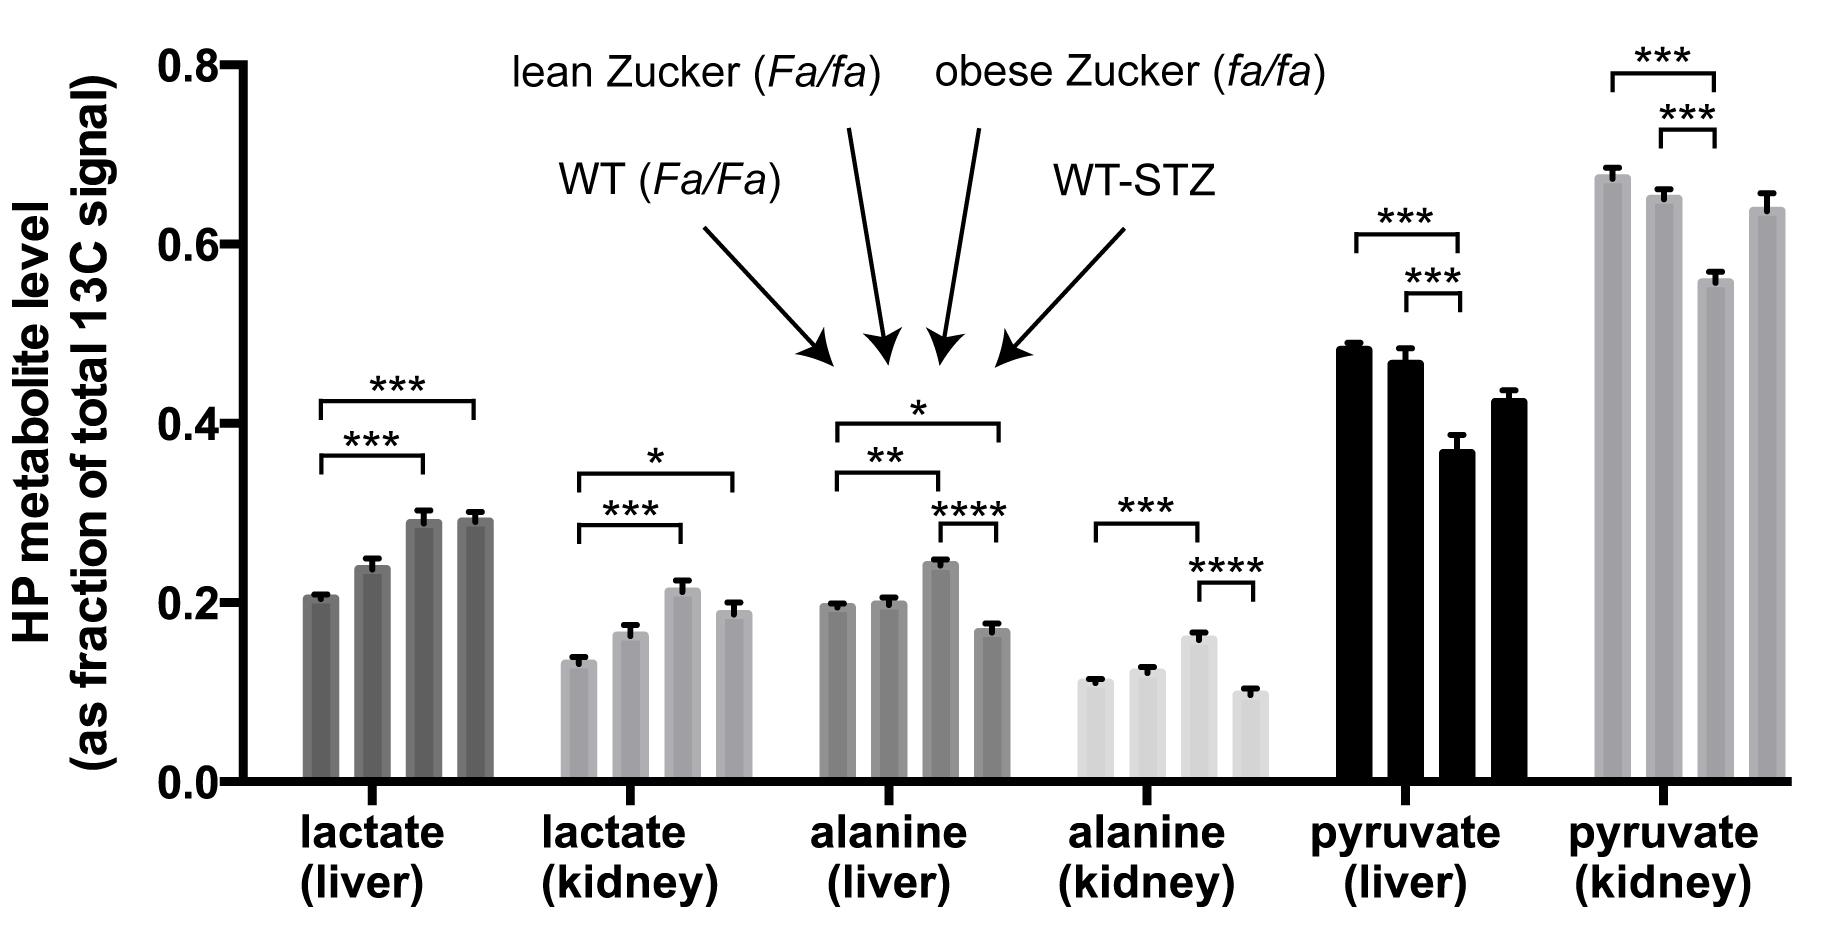
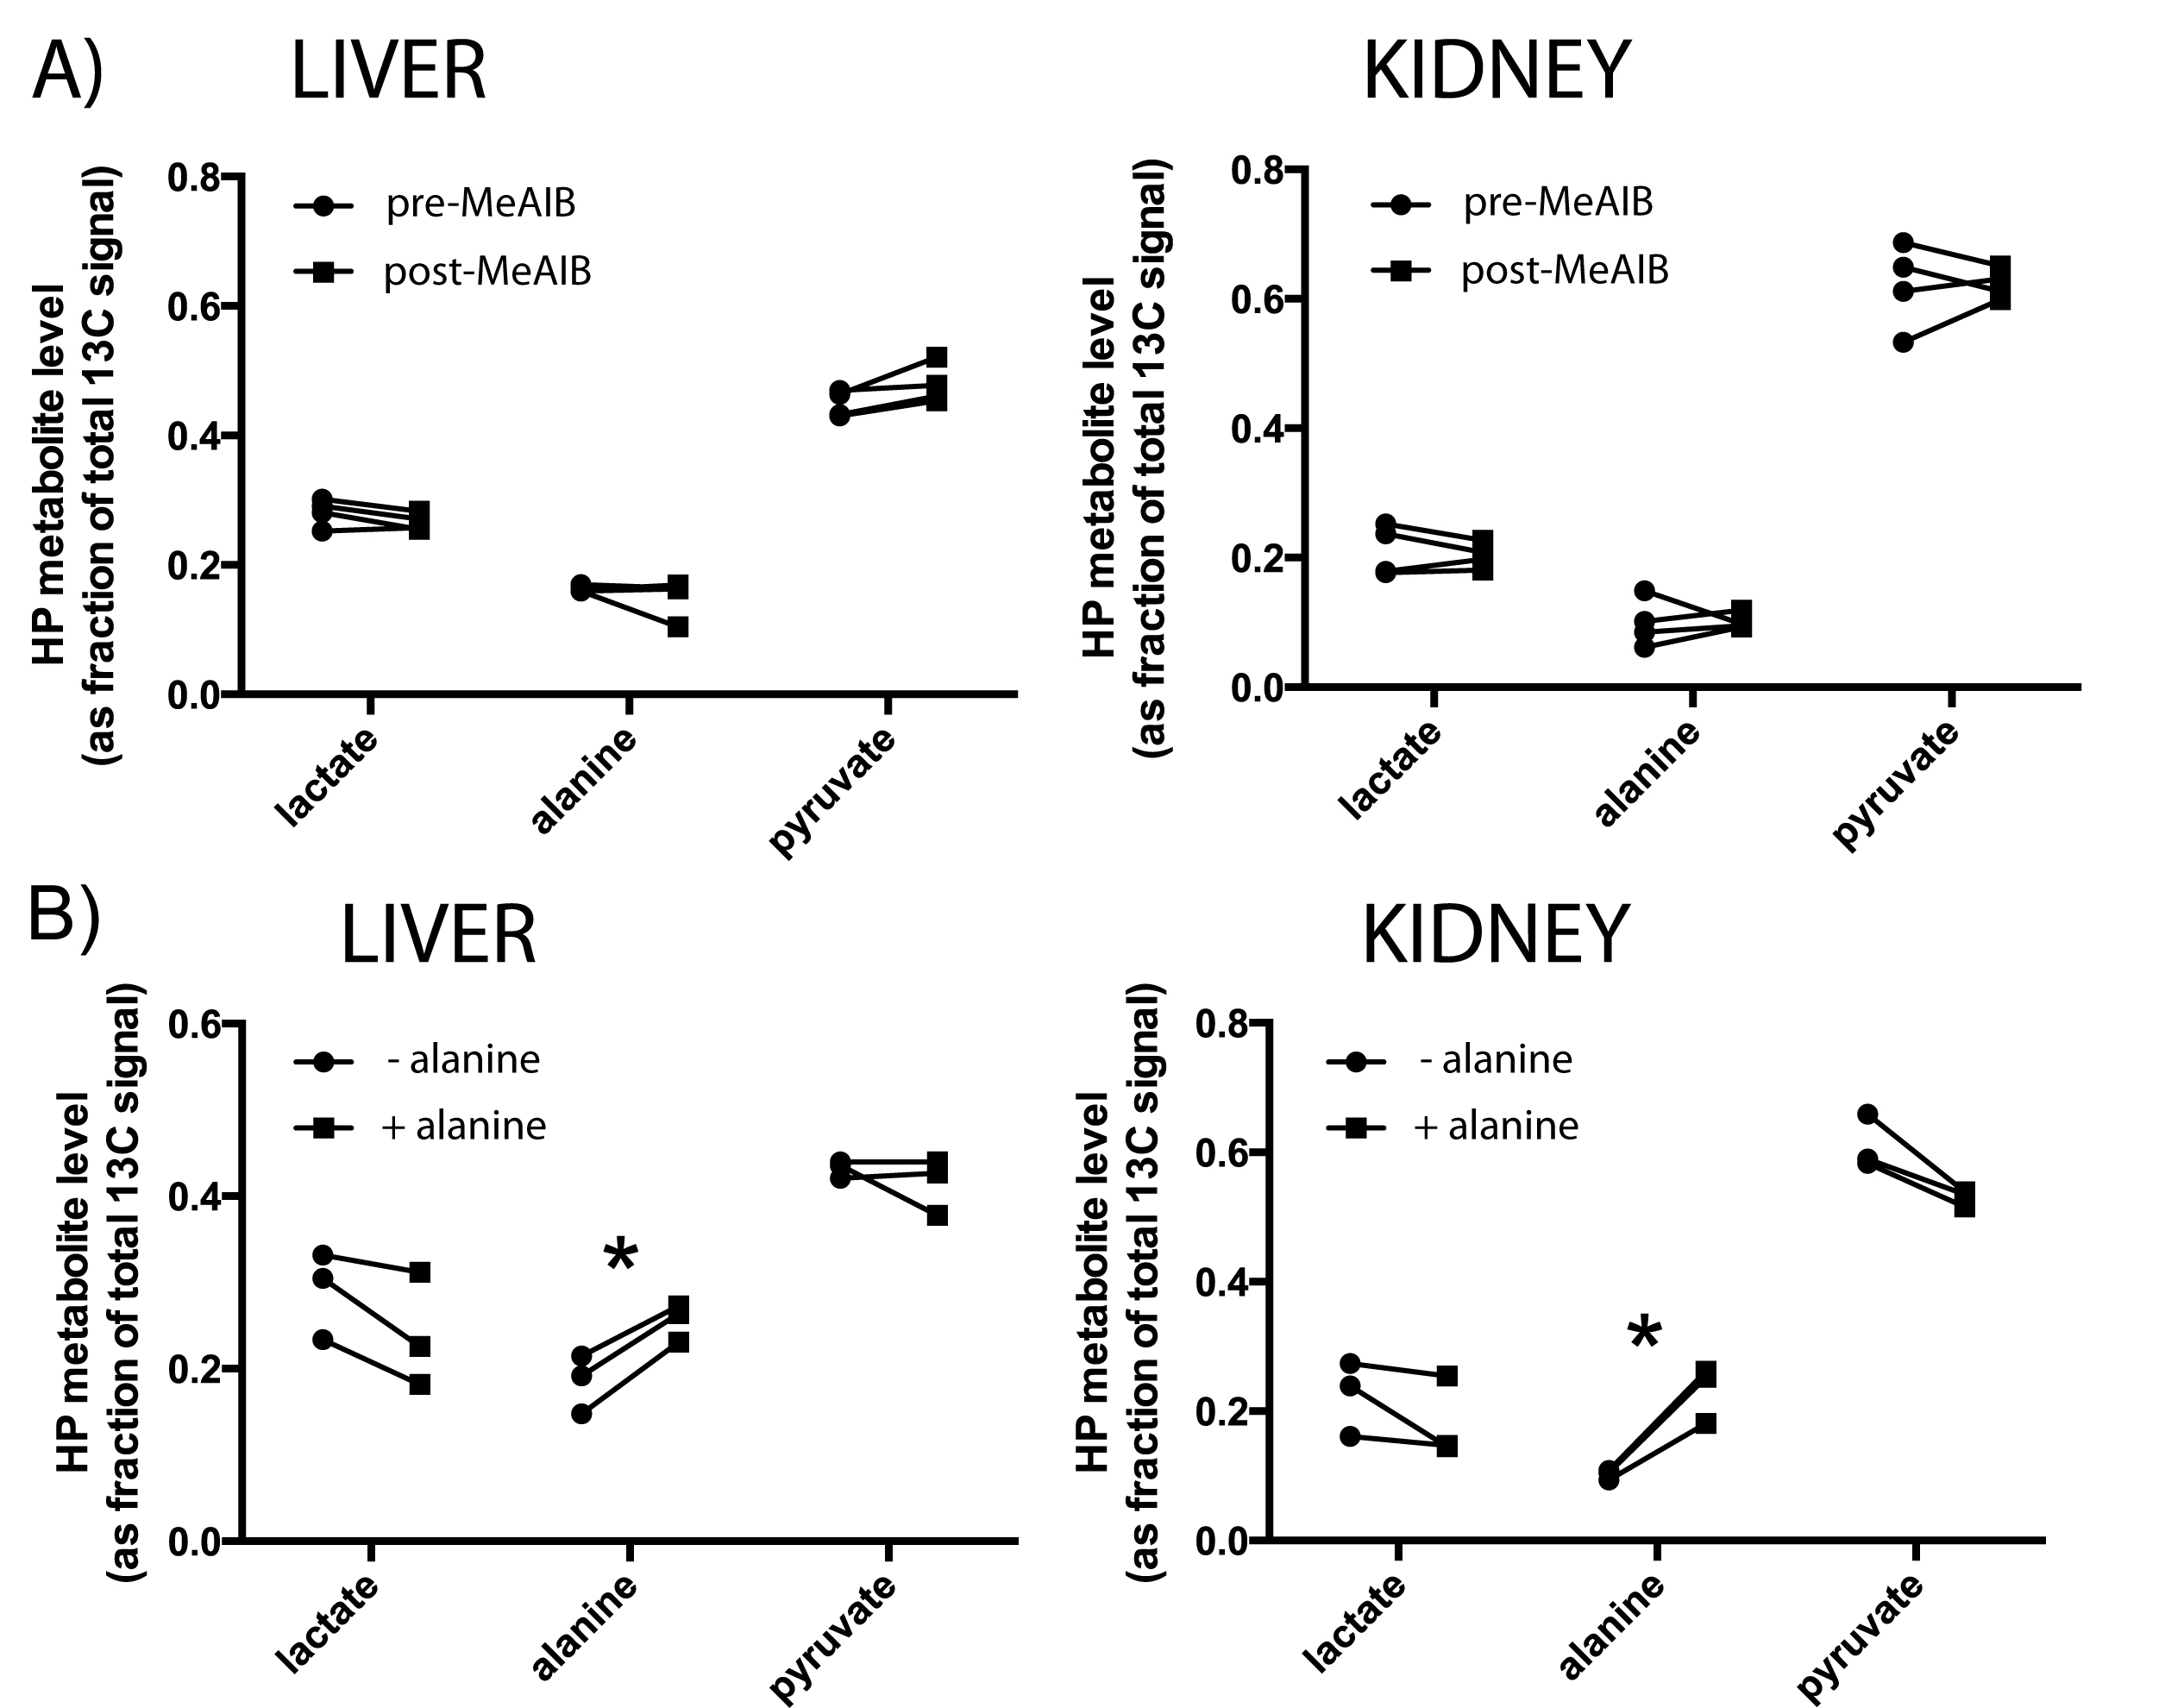
HP MRI- Spectra from each experimental group are shown in Figure 2. As depicted in Figure 3, HP lactate increased in liver and kidneys of both diabetic groups (by one-way ANOVA with Tukey multiple comparison correction), as compared to wild type (Fa/Fa). HP alanine on the other hand clearly diverged between the two models in both organs. Inhibition of alanine transport produced no discernible changes in HP spectra (Fig 4A). Co-injection of unlabeled alanine resulted in a large increase in HP alanine signal (Fig 4B), suggesting that HP alanine signal depends largely on alanine pool size. Co-injection of α-ketoglutarate produced no significant effects (not shown), also consistent with this hypothesis. Transcriptional analysis- ALT expression increased in both the STZ and ZDF models (Fig 5A), and therefore cannot explain the divergent alanine signal. While PEPCK was elevated in liver and kidney of both models (Fig 5B), LPK was selectively upregulated in the liver only of the ZDF (Fig 5C).Discussion
Distinct modulations were observed in HP [1-13C]pyruvate MR spectra of the liver and kidneys of type 1 vs. type 2 diabetes. The increased HP lactate of both models is probably largely due to increased gluconeogenesis in these organs. Gluconeogenesis is coupled to elevation of the cytoplasmic NADH/NAD+ ratio and thus higher lactate levels5,6. While lactate was elevated in both models, alanine clearly diverged, decreasing in type 1 and increasing in type 2. We previously observed a decline in HP alanine in fasting and STZ rats7, consistent with prior measurements from rat liver extracts8. Considering the striking phenotypic difference between STZ and ZDF models in terms of lipogenesis, an attractive explanation relates the differing effect on HP alanine to changes associated with lipogenesis. LPK is transcriptionally activated in liver in conjunction with the lipogenic program by insulin9 and/or glucose directly10, helping to convert glucose to pyruvate for fatty acid synthesis but also slowing gluconeogenesis by shunting PEP back to pyruvate (and alanine via ALT). LPK is also under heavy allosteric control, in fact heavily inhibited by alanine at physiologic levels4 (e.g. 50% inhibition at 0.1mM alanine). High cellular alanine levels in type 2 diabetes, a new observation, could interfere with suppression of hepatic gluconeogenesis by increased LPK expression. The observed failure of insulin and/or glucose to induce LPK, and the elevated renal HP alanine levels in the type 2 animals, may likewise contribute to a significant role of renal gluconeogenesis in diabetes.Acknowledgements
We gratefully acknowledge NIH grants K01DK099451 and P41EB013598.References
1. Brown, M. S. & Goldstein, J. L. Selective versus Total Insulin Resistance: A Pathogenic Paradox. Cell Metab. 7, 95–96 (2008).
2. Peterson, R. G., Shaw, W. N., Neel, M.-A., Little, L. A. & Eichberg, J. Zucker Diabetic Fatty Rat as a Model for Non-insulin-dependent Diabetes Mellitus. ILAR J 32, 16–19 (1990).
3. Bröer, S. The SLC38 family of sodium-amino acid co-transporters. Pflugers Arch. 466, 155–172 (2014).
4. Llorente, P., Marco, R. & Sols, A. Regulation of liver pyruvate kinase and the phosphoenolpyruvate crossroads. Eur. J. Biochem. 13, 45–54 (1970).
5. Krebs, H. A. Gluconeogenesis and redox state. Hoppe-Seyler's Z. Physiol. Chem. 351, 288 (1970).
6. Veech, R. L., Raijman, L. & Krebs, H. A. Equilibrium relations between the cytoplasmic adenine nucleotide system and nicotinamide–adenine nucleotide system in rat liver. Biochem. J. 117, 499–503 (1970).
7. von Morze, C. et al. Detection of localized changes in the metabolism of hyperpolarized gluconeogenic precursors (13) C-lactate and (13) C-pyruvate in kidney and liver. Magn Reson Med (2016). doi:10.1002/mrm.26245
8. Williamson, D. H., Lopes-Vieira, O. & Walker, B. Concentrations of free glucogenic amino acids in livers of rats subjected to various metabolic stresses. Biochem. J. 104, 497–502 (1967).
9. Horton, J. D., Goldstein, J. L. & Brown, M. S. SREBPs: activators of the complete program of cholesterol and fatty acid synthesis in the liver. J. Clin. Invest. 109, 1125–1131 (2002).
10. Kawaguchi, T., Takenoshita, M., Kabashima, T. & Uyeda, K. Glucose and cAMP regulate the L-type pyruvate kinase gene by phosphorylation/dephosphorylation of the carbohydrate response element binding protein. PNAS 98, 13710–13715 (2001).
Figures